
Stevanato Group Q2 2023 Financial Results July 28th, 2023 Exhibit 99.1

Forward-Looking Statements This presentation may include forward-looking statements. The words "expect,” "reiterating,” “durable,” “continue,” “shifting,” “expand,” “believe,” “continued,” “assumes," “continuing,” "rising," “well positioned,” "strong," "increase," "benefitting," "raising," "creating," "expected," and similar expressions (or their negative) identify certain of these forward-looking statements. These forward-looking statements are statements regarding the Company's intentions, beliefs or current expectations concerning, among other things, the investments the Company expects to make, the expansion of manufacturing capacity, the Company’s plans regarding its presence in the U.S., its capital expenditure guidance, business strategies, the Company’s capacity to meet future market demands and support preparedness for future public health emergencies, and results of operations. The forward-looking statements in this presentation are based on numerous assumptions regarding the Company’s present and future business strategies and the environment in which the Company will operate in the future. Forward-looking statements involve inherent known and unknown risks, uncertainties and contingencies because they relate to events and depend on circumstances that may or may not occur in the future and may cause the actual results, performance or achievements of the Company to be materially different from those expressed or implied by such forward looking statements. Many of these risks and uncertainties relate to factors that are beyond the Company's ability to control or estimate precisely, such as future market conditions, currency fluctuations, the behavior of other market participants, the actions of regulators and other factors such as the Company's ability to continue to obtain financing to meet its liquidity needs, changes in the political, social and regulatory framework in which the Company operates or in economic or technological trends or conditions. For a description of the risks that could cause the Company’s future results to differ from those expressed in any such forward looking statements, refer to the risk factors discussed in the Company’s most recent annual report on Form 20-F filed with the U.S. Securities and Exchange Commission. Readers should therefore not place undue reliance on these statements, particularly not in connection with any contract or investment decision. Except as required by law, the Company assumes no obligation to update any such forward-looking statements. Non-GAAP Financial Information This presentation contains non-GAAP financial measures. Please refer to the tables included in this presentation for a reconciliation of non-GAAP financial measures. Management monitors and evaluates its operating and financial performance using several non-GAAP financial measures, including Constant Currency Revenue, EBITDA, Adjusted EBITDA, Adjusted EBITDA Margin, Adjusted Operating Profit, Adjusted Operating Profit Margin, Adjusted Income Taxes, Adjusted Net Profit, Adjusted Diluted EPS, Capital Employed, Net Cash, Free Cash Flow and CAPEX. The Company believes that these non-GAAP financial measures provide useful and relevant information regarding its performance and improve its ability to assess its financial condition. While similar measures are widely used in the industry in which the Company operates, the financial measures it uses may not be comparable to other similarly titled measures used by other companies, nor are they intended to be substitutes for measures of financial performance or financial position as prepared in accordance with IFRS. Safe Harbor Statement Q2 2023 Financial Results
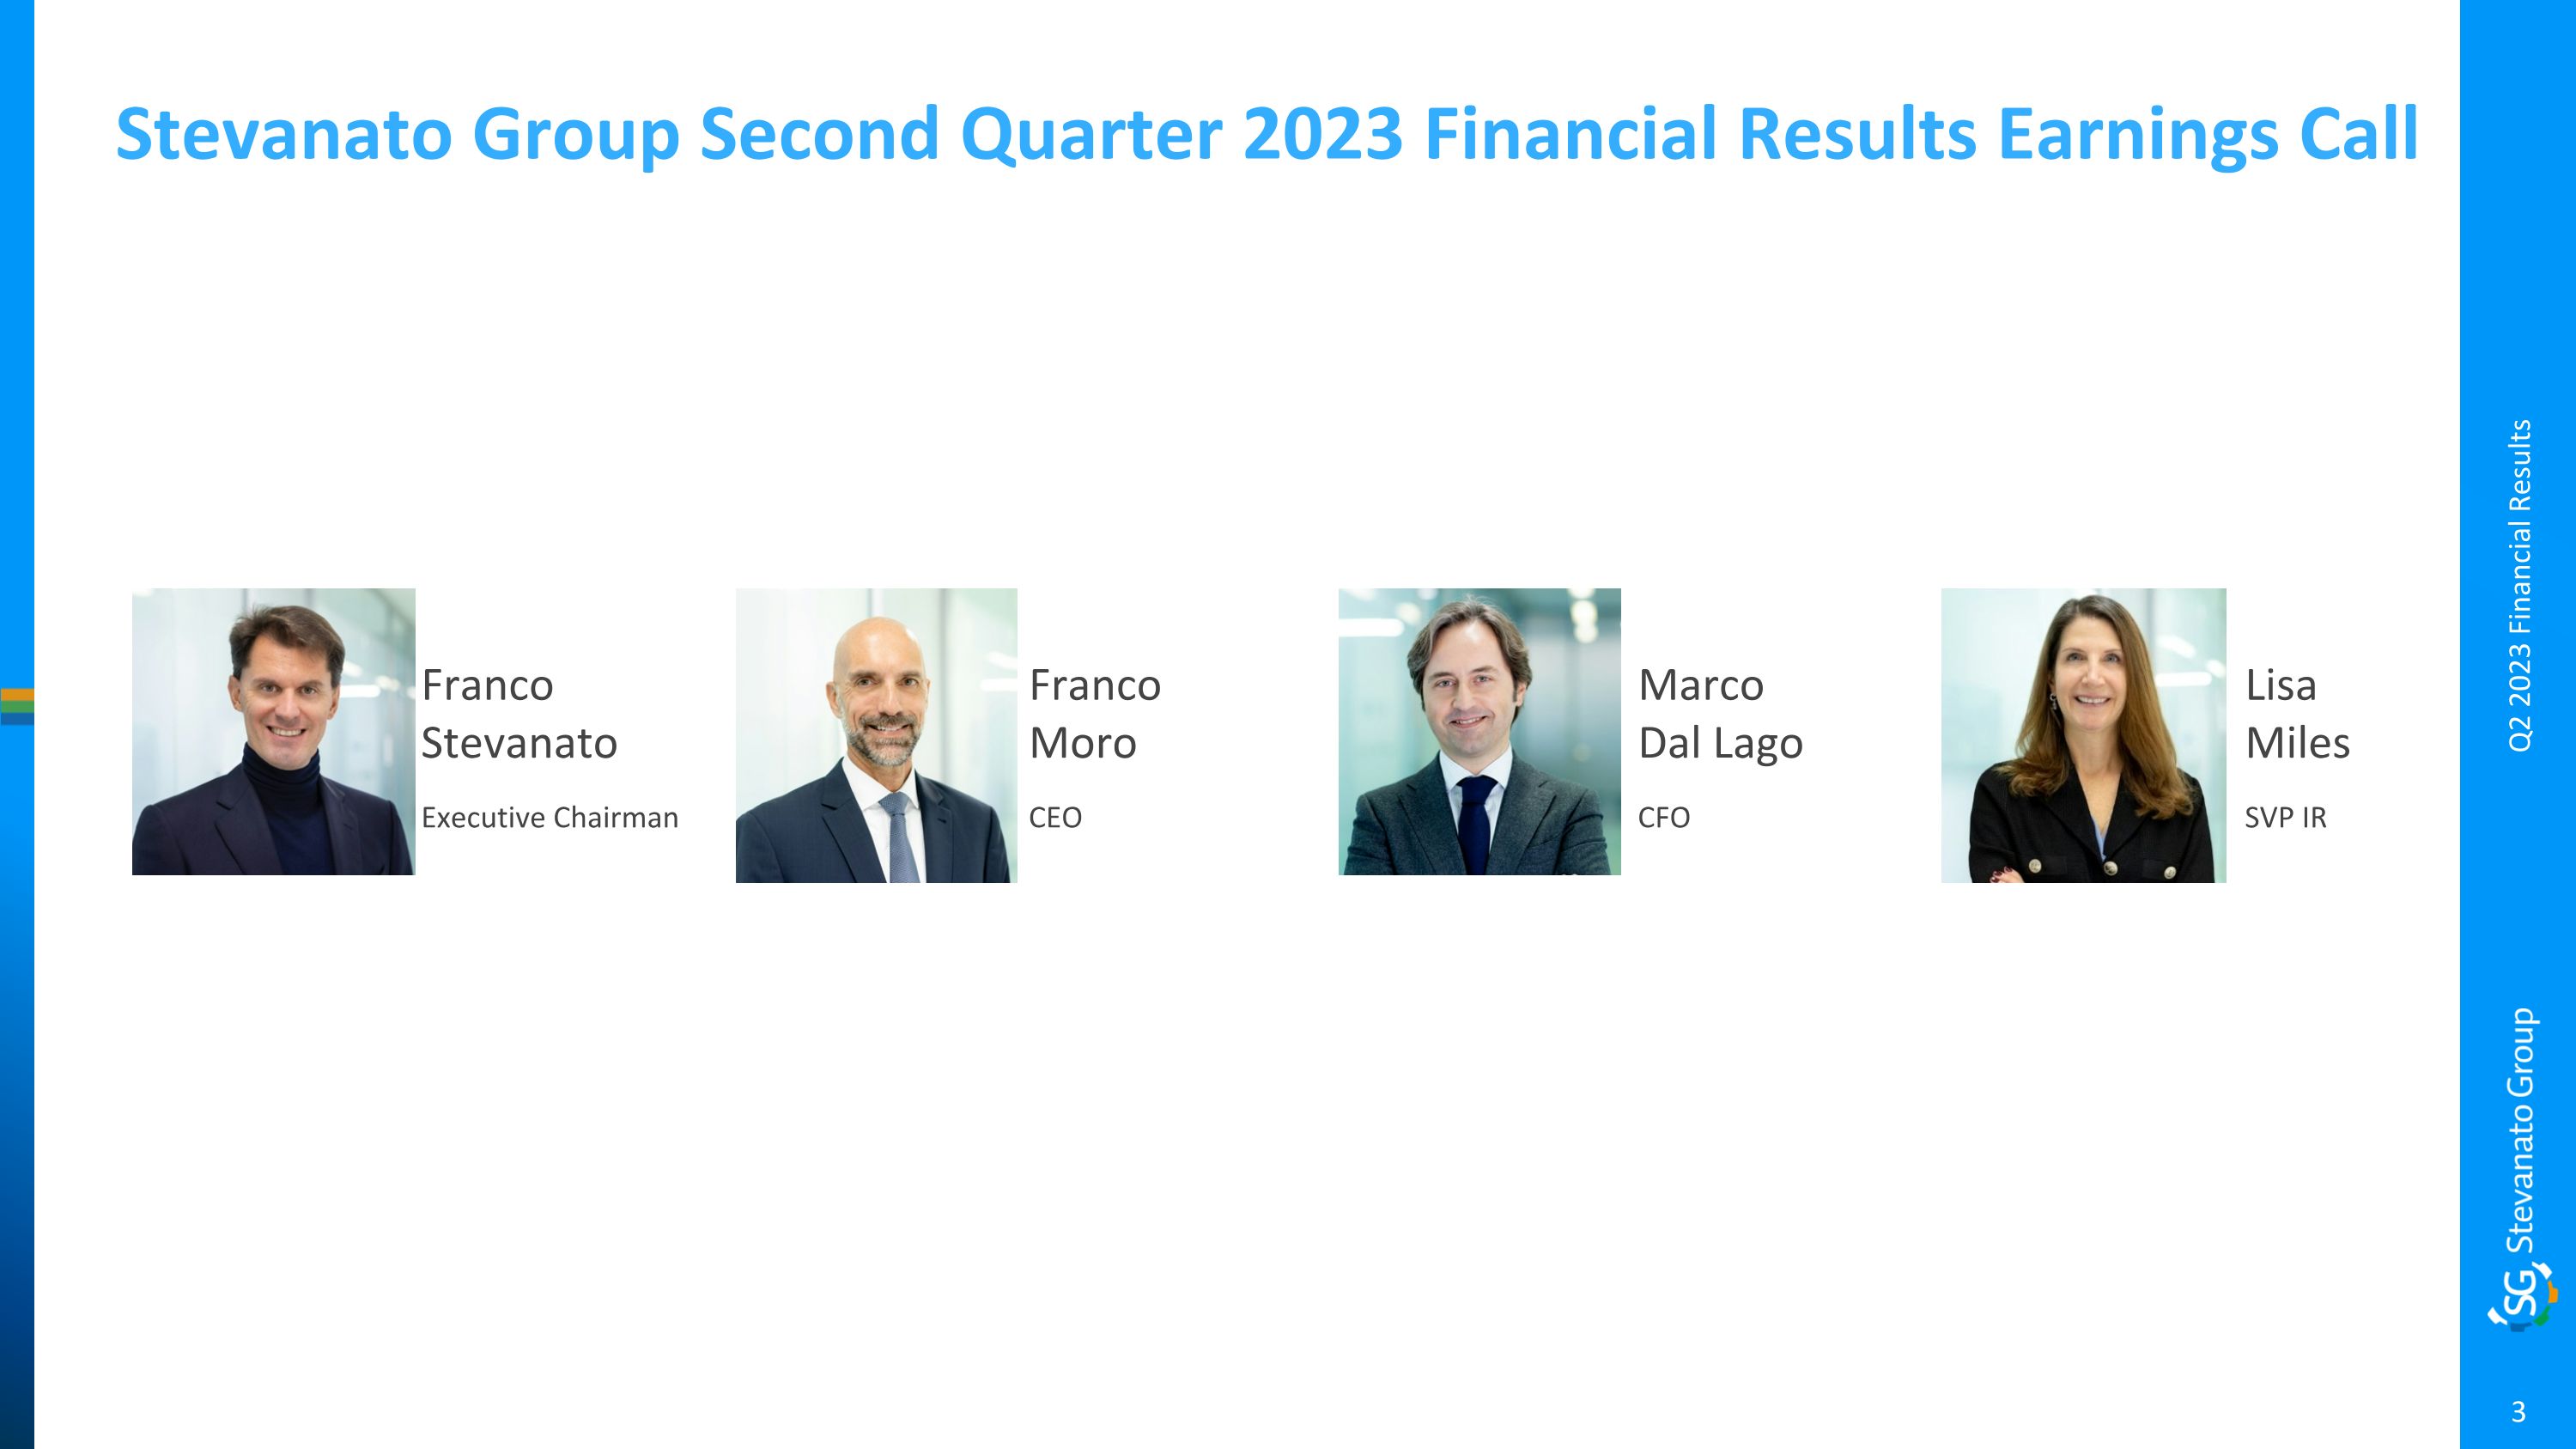
Stevanato Group Second Quarter 2023 Financial Results Earnings Call Franco Stevanato Executive Chairman Franco Moro CEO Marco Dal Lago CFO Lisa Miles SVP IR Q2 2023 Financial Results
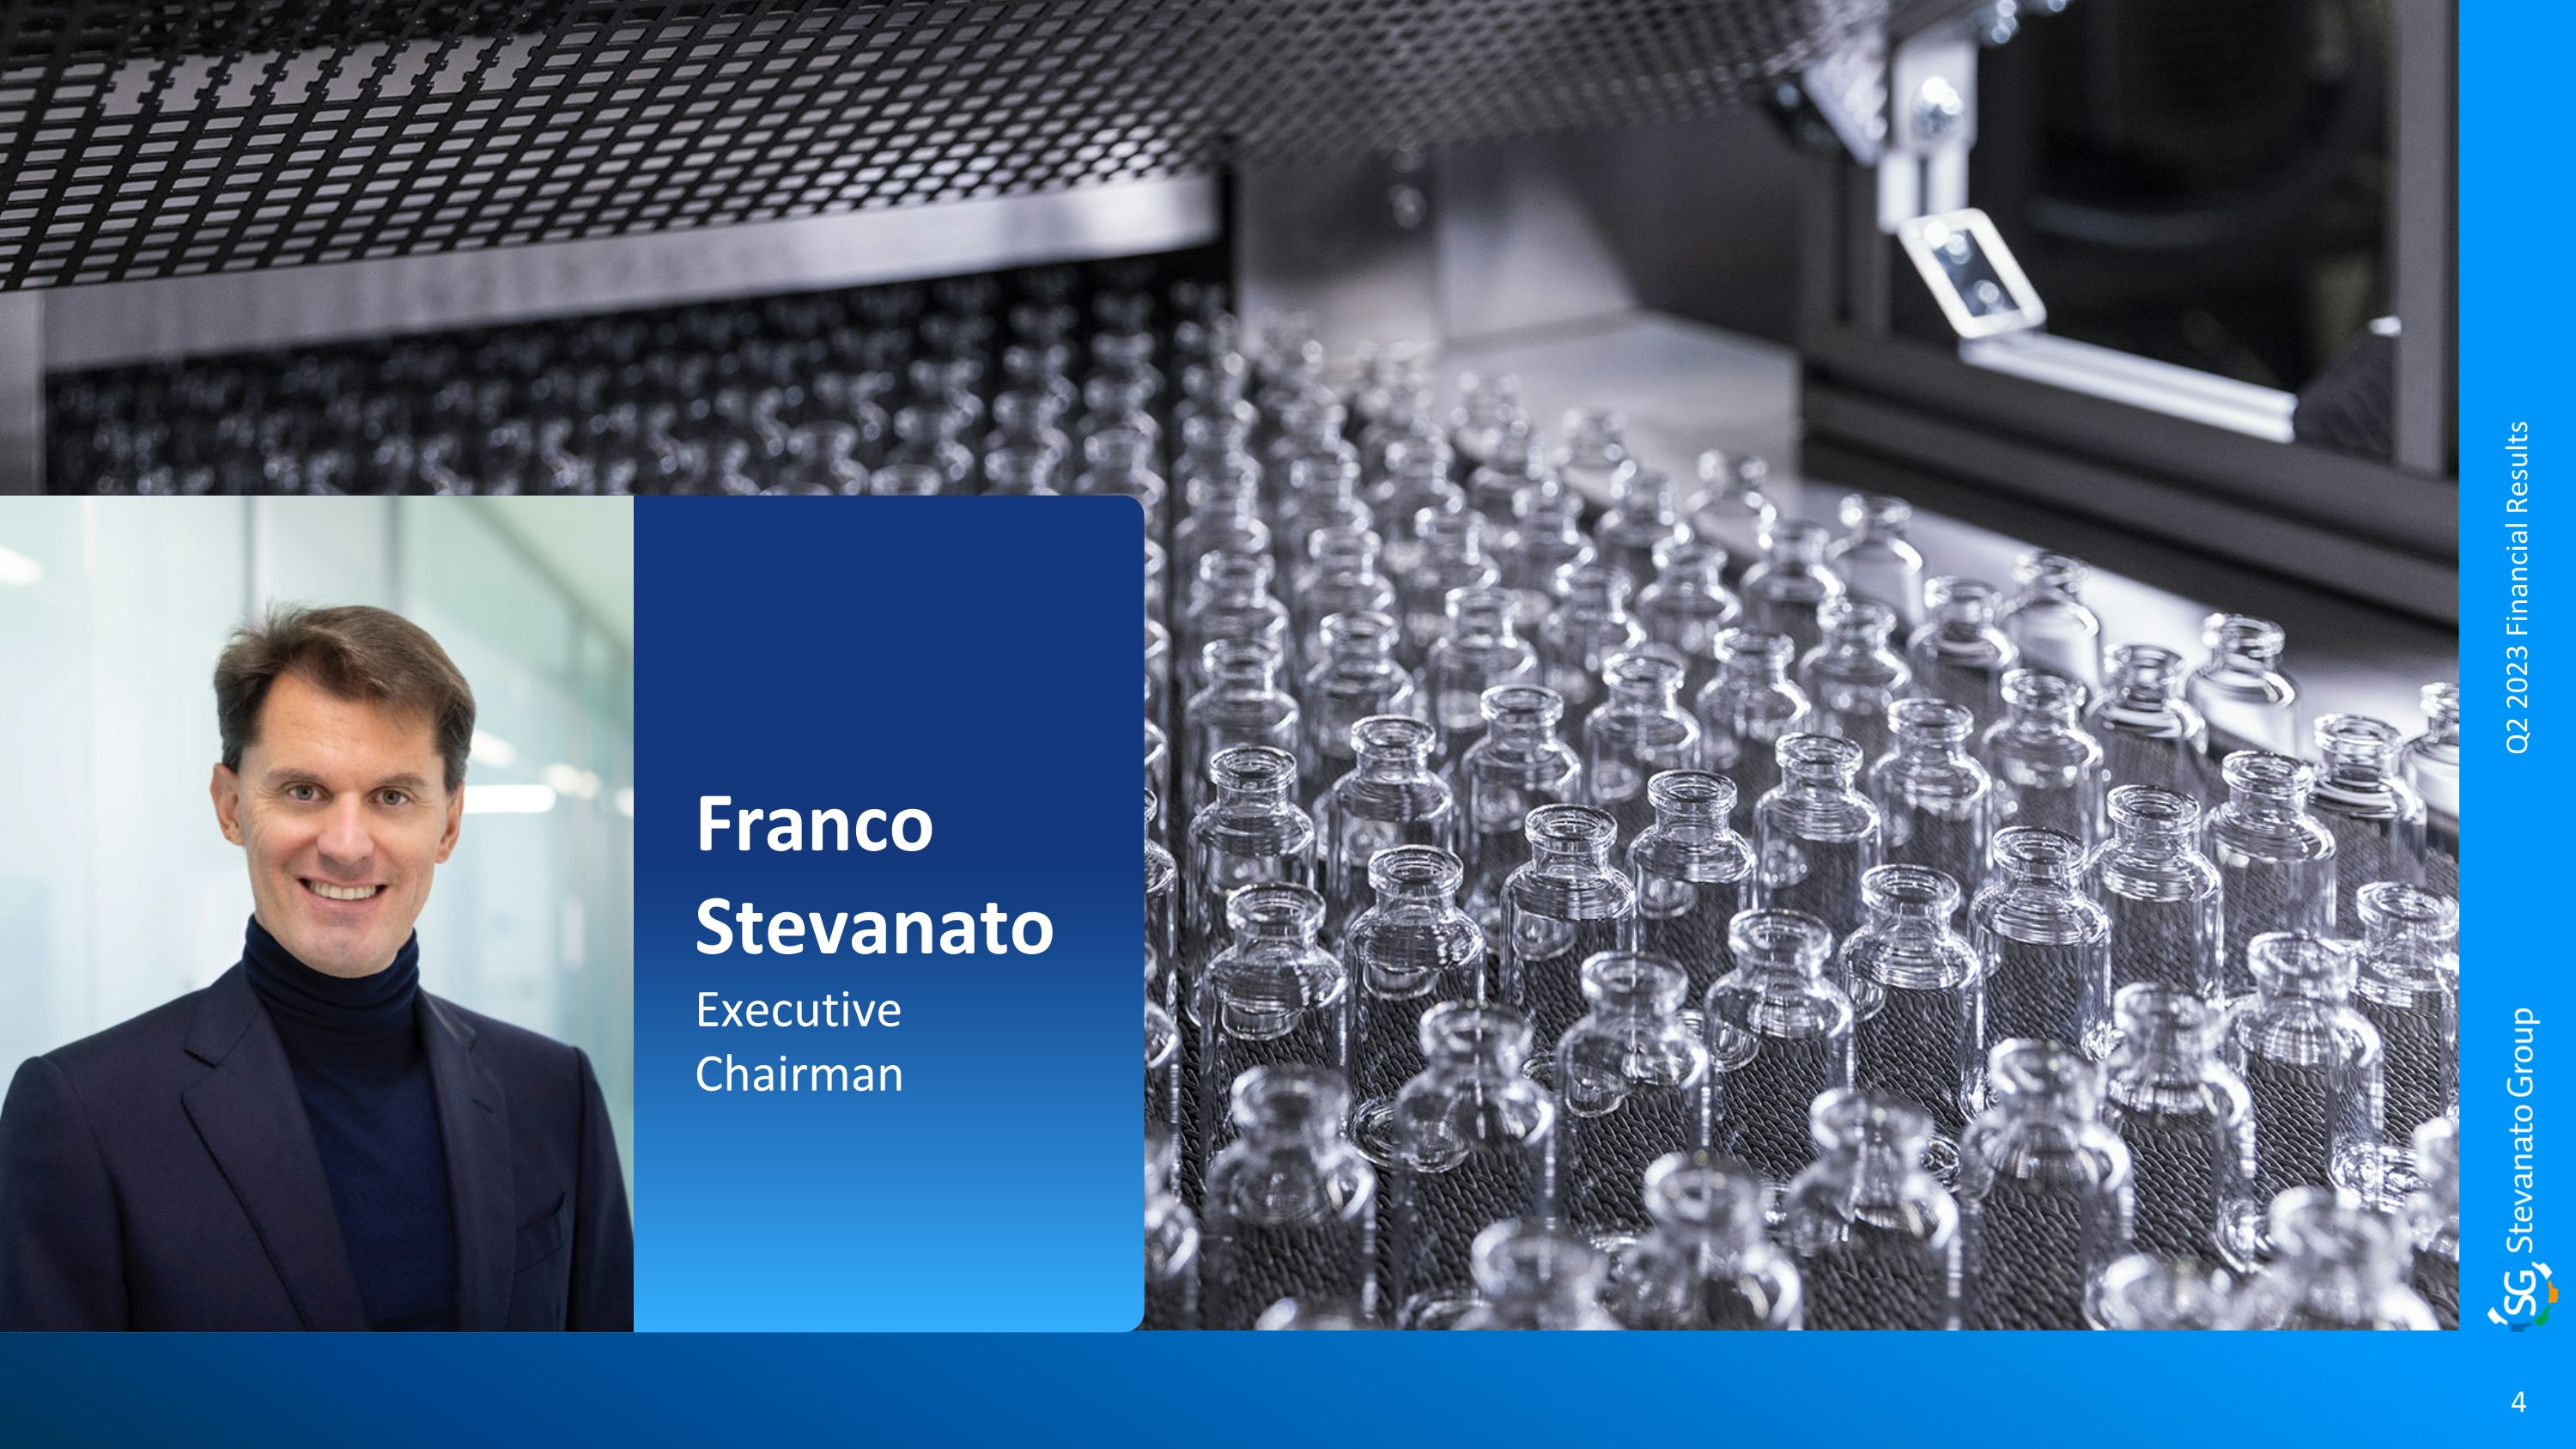
Franco Stevanato Executive Chairman 4 Q2 2023 Financial Results
Substantial Progress in Building Durable Organic Growth Continue to achieve high-single digit to low double-digit growth Successfully responding to market demand, which in turn, is shifting our revenue mix toward High-Value Solutions Investments in growth platforms are going as planned as we expand capacity for high-value solutions to satisfy strong demand in key end markets like biologics. Benefitting from growth in biologics, which has a projected CAGR of 15% through 2027 and is currently our fastest growing end market. Differentiated EZ-fill® products ideally suited to meet mission critical needs of biologics. Our pipeline is heavily weighted towards this market Q2 2023 Financial Results The foundation is in place to drive sustainable long-term organic growth and we believe we are well positioned to capitalize on the many secular tailwinds as we continue to create shareholder value
Franco Moro Chief Executive Officer 6 Q2 2023 Financial Results
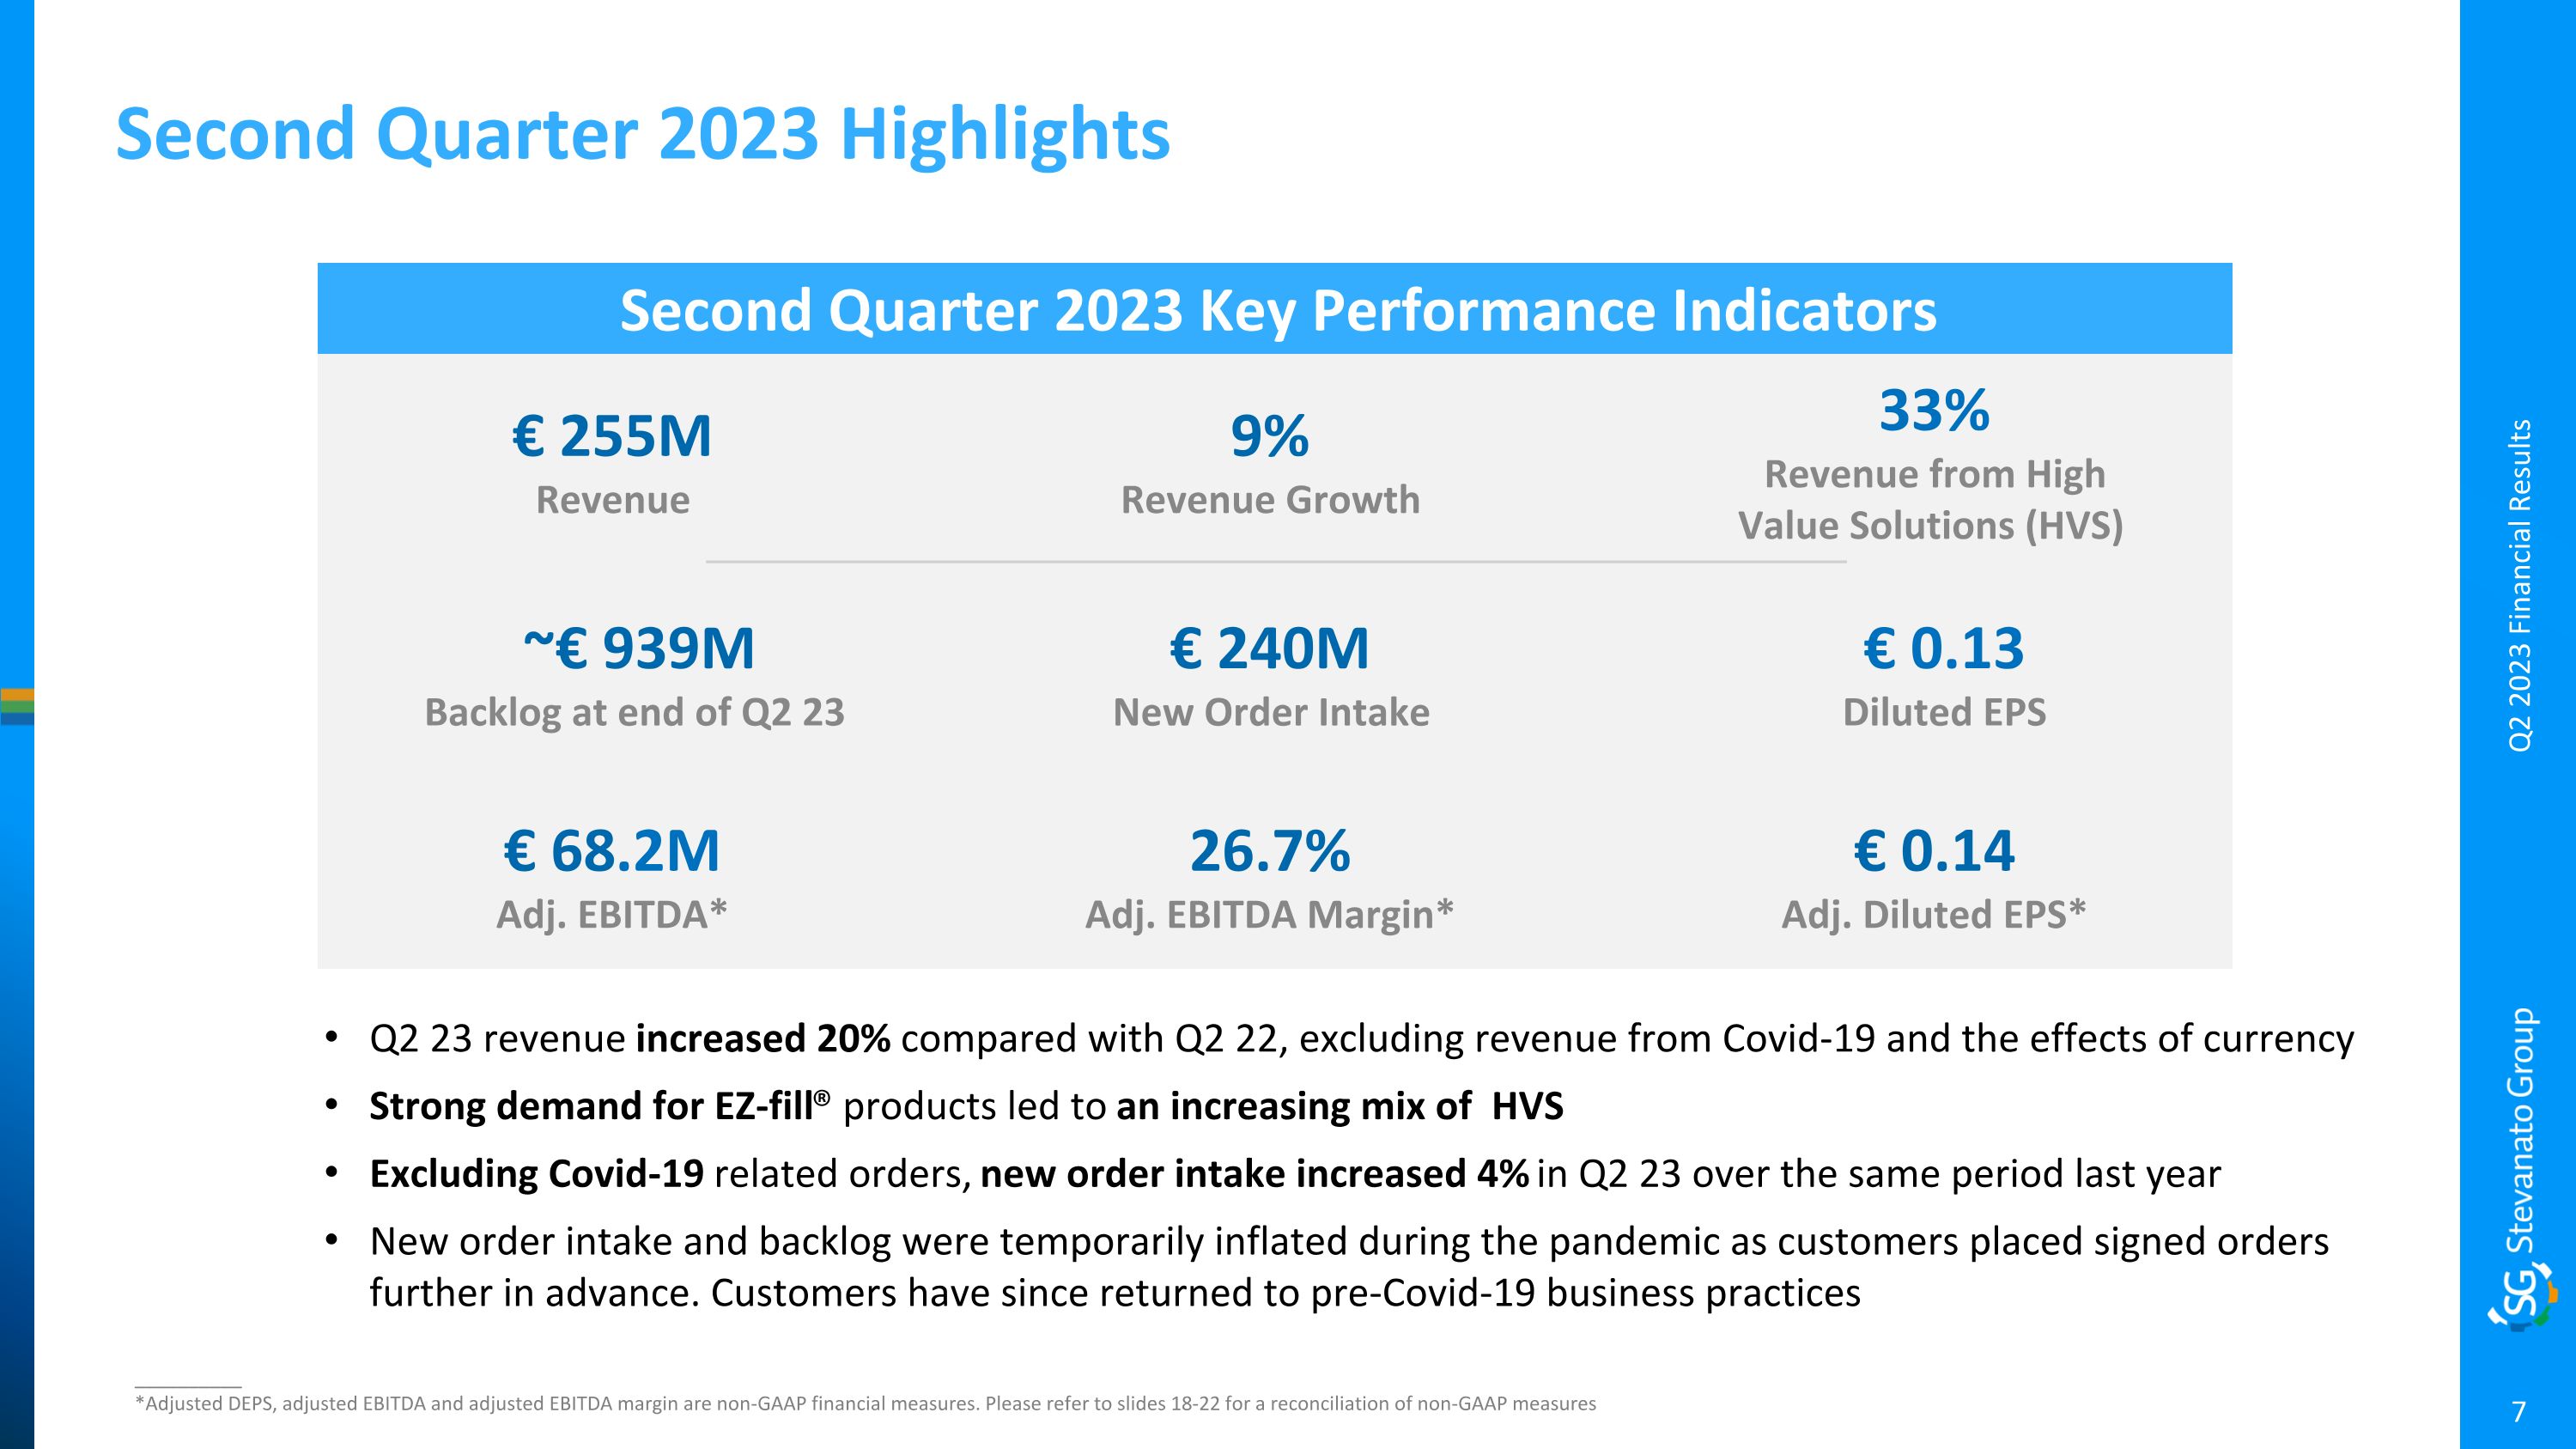
Second Quarter 2023 Highlights Q2 23 revenue increased 20% compared with Q2 22, excluding revenue from Covid-19 and the effects of currency Strong demand for EZ-fill® products led to an increasing mix of HVS Excluding Covid-19 related orders, new order intake increased 4% in Q2 23 over the same period last year New order intake and backlog were temporarily inflated during the pandemic as customers placed signed orders further in advance. Customers have since returned to pre-Covid-19 business practices __________ *Adjusted DEPS, adjusted EBITDA and adjusted EBITDA margin are non-GAAP financial measures. Please refer to slides 18-22 for a reconciliation of non-GAAP measures Q2 2023 Financial Results Second Quarter 2023 Key Performance Indicators € 255M Revenue 33% Revenue from High Value Solutions (HVS) € 68.2M Adj. EBITDA* 9% Revenue Growth 26.7% Adj. EBITDA Margin* € 0.14 Adj. Diluted EPS* € 0.13 Diluted EPS € 240M New Order Intake ~€ 939M Backlog at end of Q2 23
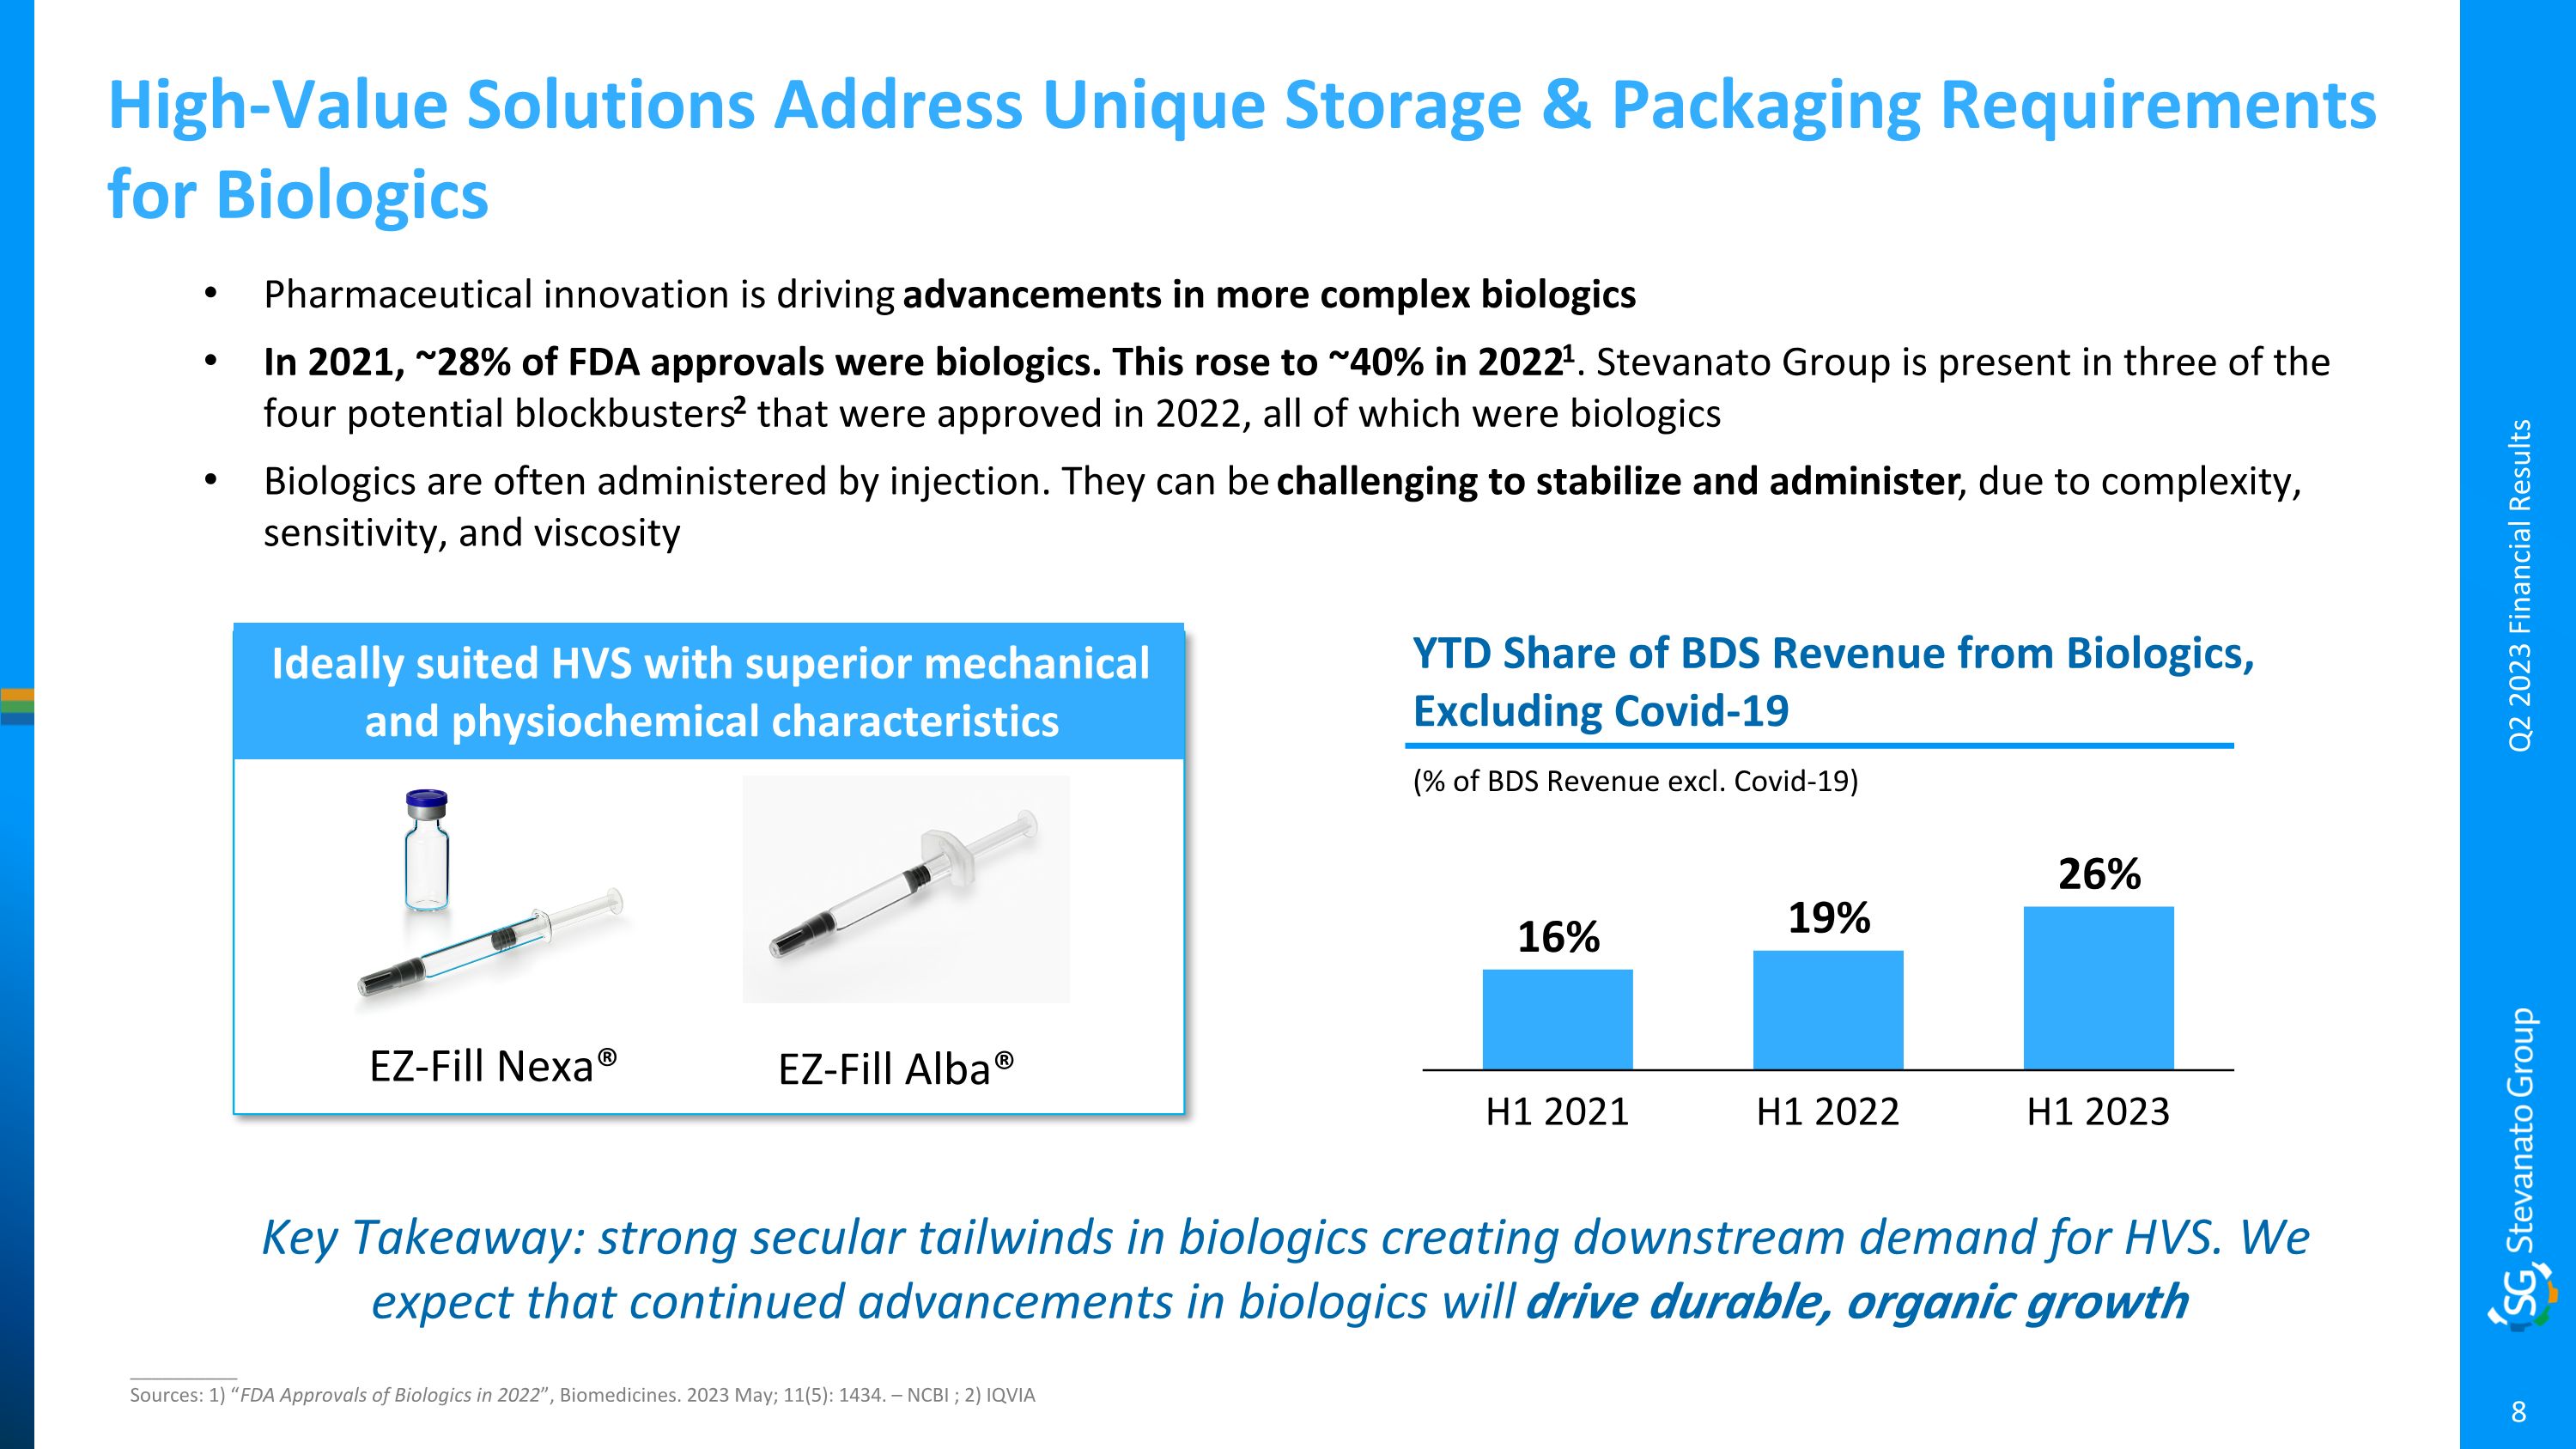
High-Value Solutions Address Unique Storage & Packaging Requirements for Biologics Key Takeaway: strong secular tailwinds in biologics creating downstream demand for HVS. We expect that continued advancements in biologics will drive durable, organic growth Pharmaceutical innovation is driving advancements in more complex biologics In 2021, ~28% of FDA approvals were biologics. This rose to ~40% in 20221. Stevanato Group is present in three of the four potential blockbusters2 that were approved in 2022, all of which were biologics Biologics are often administered by injection. They can be challenging to stabilize and administer, due to complexity, sensitivity, and viscosity __________ Sources: 1) “FDA Approvals of Biologics in 2022”, Biomedicines. 2023 May; 11(5): 1434. – NCBI ; 2) IQVIA H1 2022 H1 2021 H1 2023 (% of BDS Revenue excl. Covid-19) YTD Share of BDS Revenue from Biologics, Excluding Covid-19 Ideally suited HVS with superior mechanical and physiochemical characteristics EZ-Fill Nexa® EZ-Fill Alba® Q2 2023 Financial Results
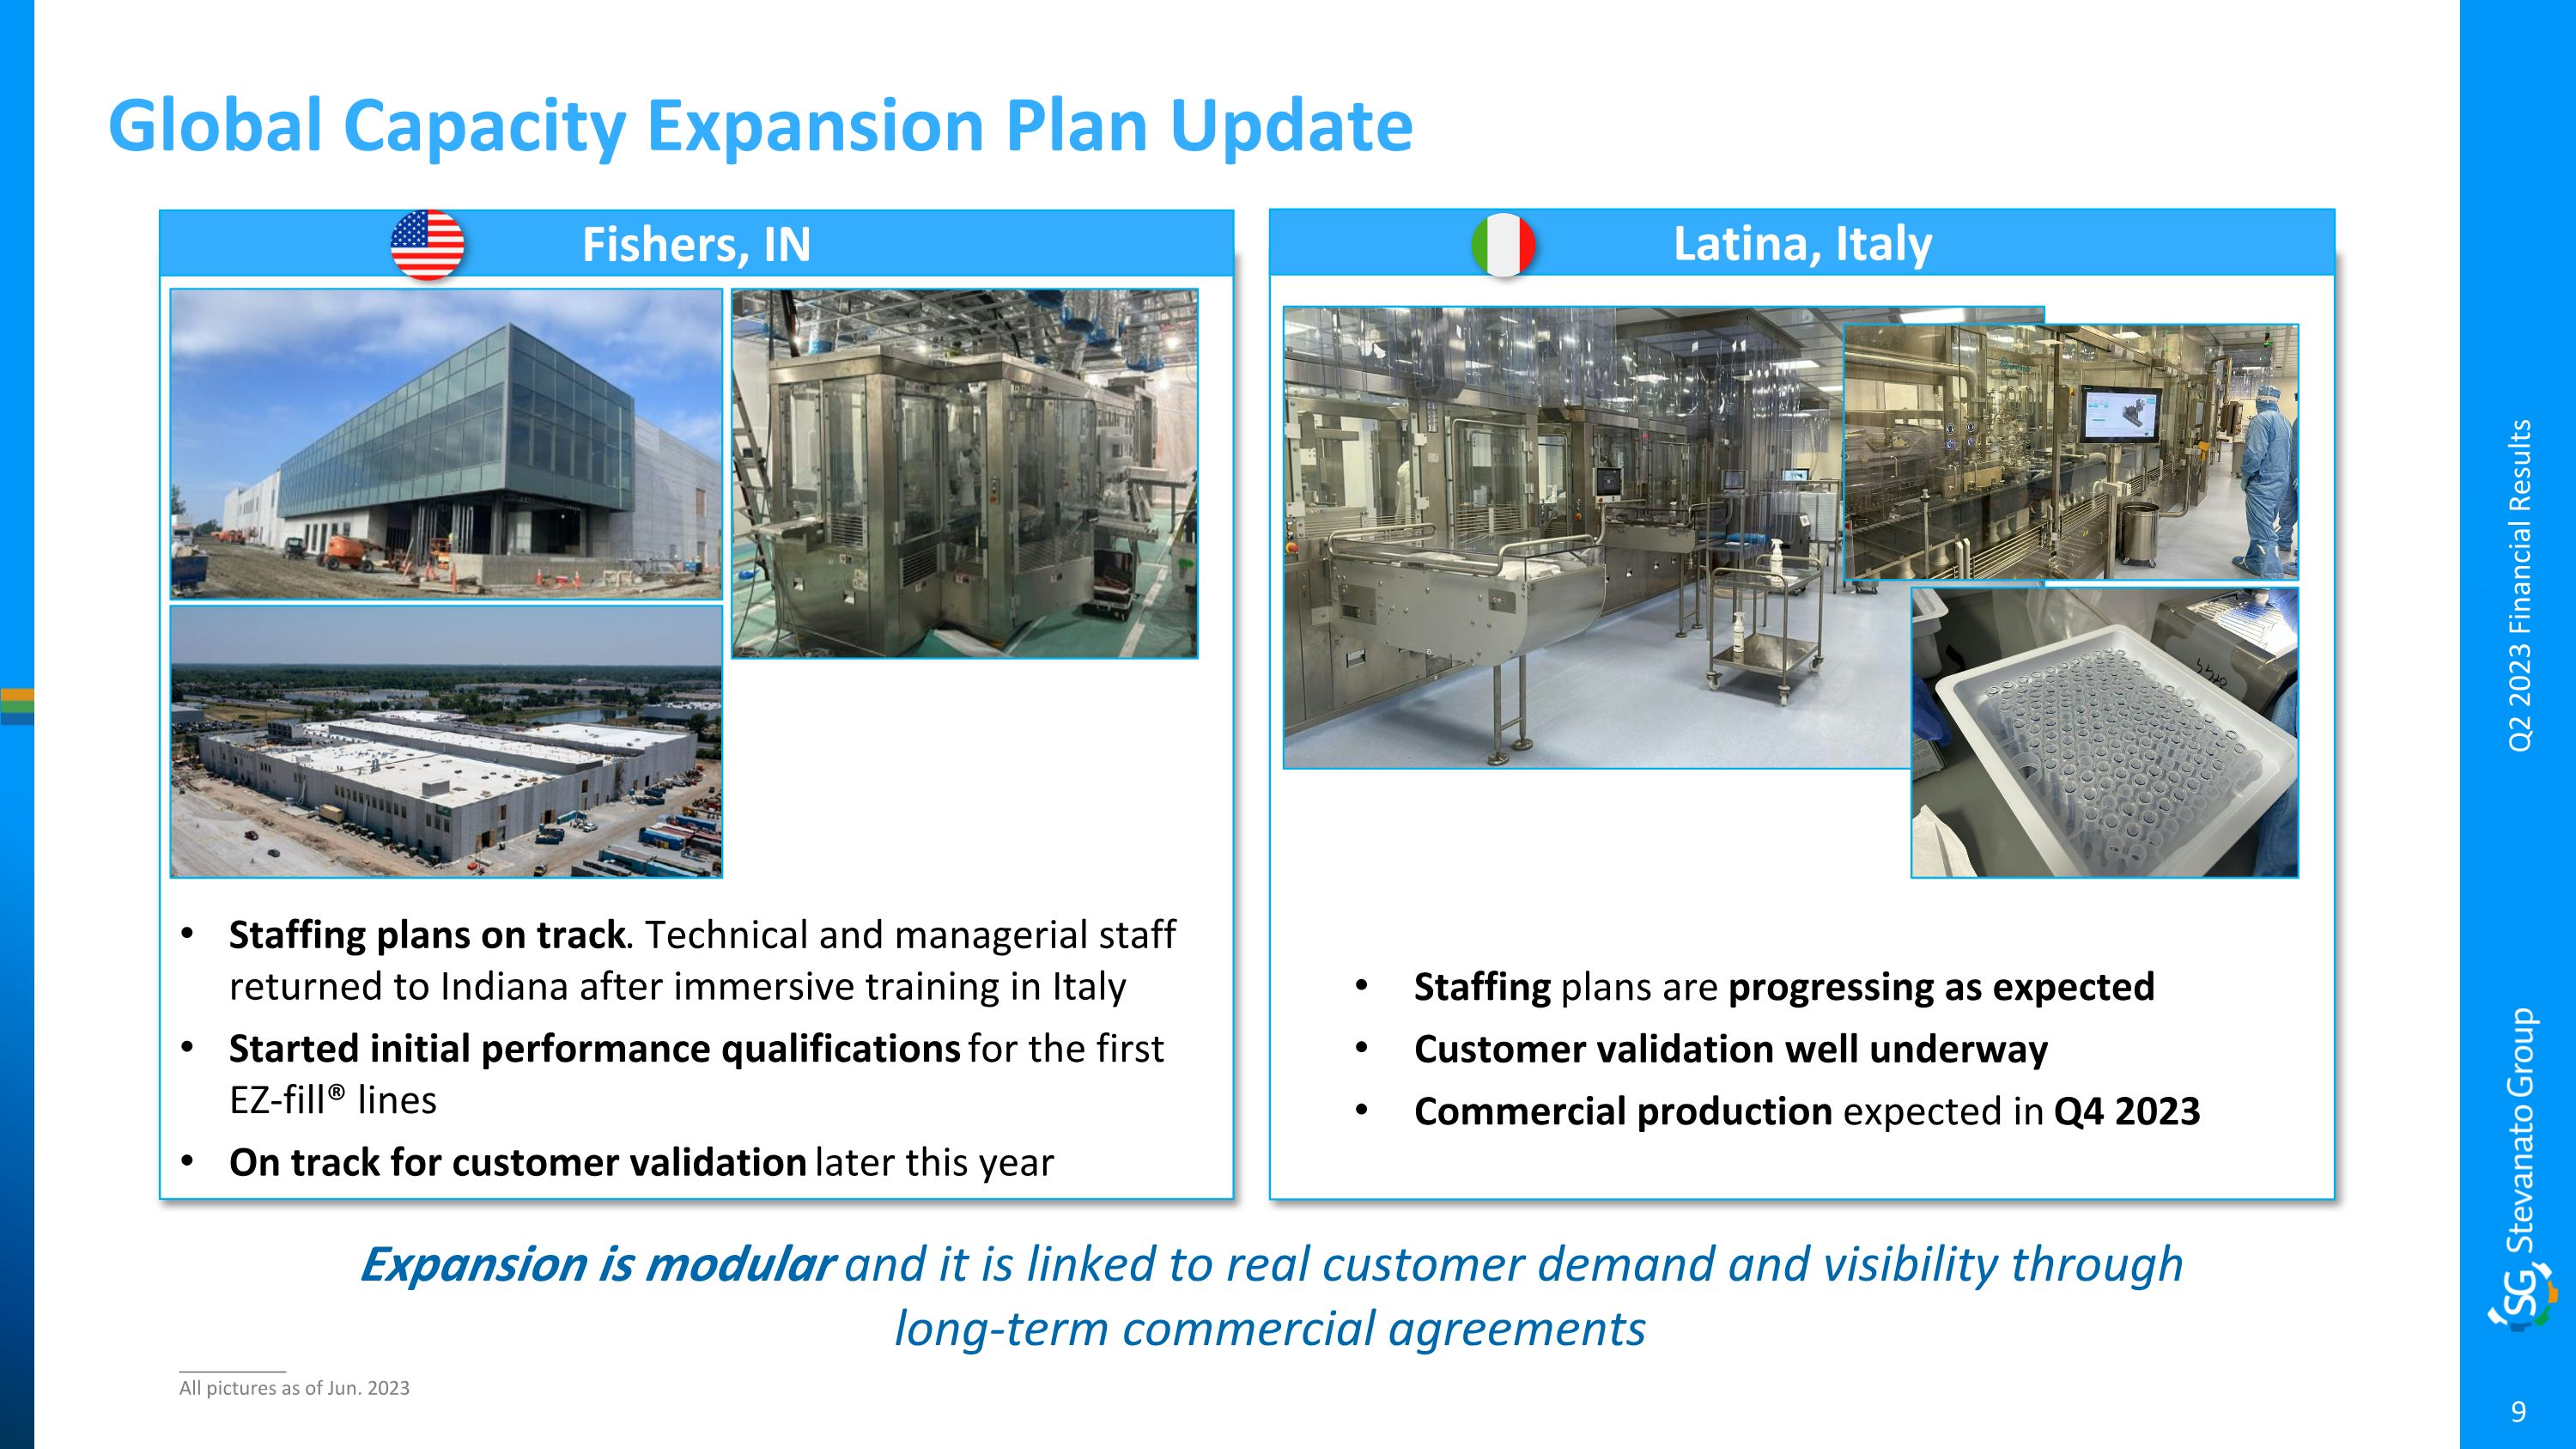
Global Capacity Expansion Plan Update Q2 2023 Financial Results Fishers, IN Latina, Italy Staffing plans on track. Technical and managerial staff returned to Indiana after immersive training in Italy Started initial performance qualifications for the first EZ-fill® lines On track for customer validation later this year Staffing plans are progressing as expected Customer validation well underway Commercial production expected in Q4 2023 __________ All pictures as of Jun. 2023 Expansion is modular and it is linked to real customer demand and visibility through long-term commercial agreements
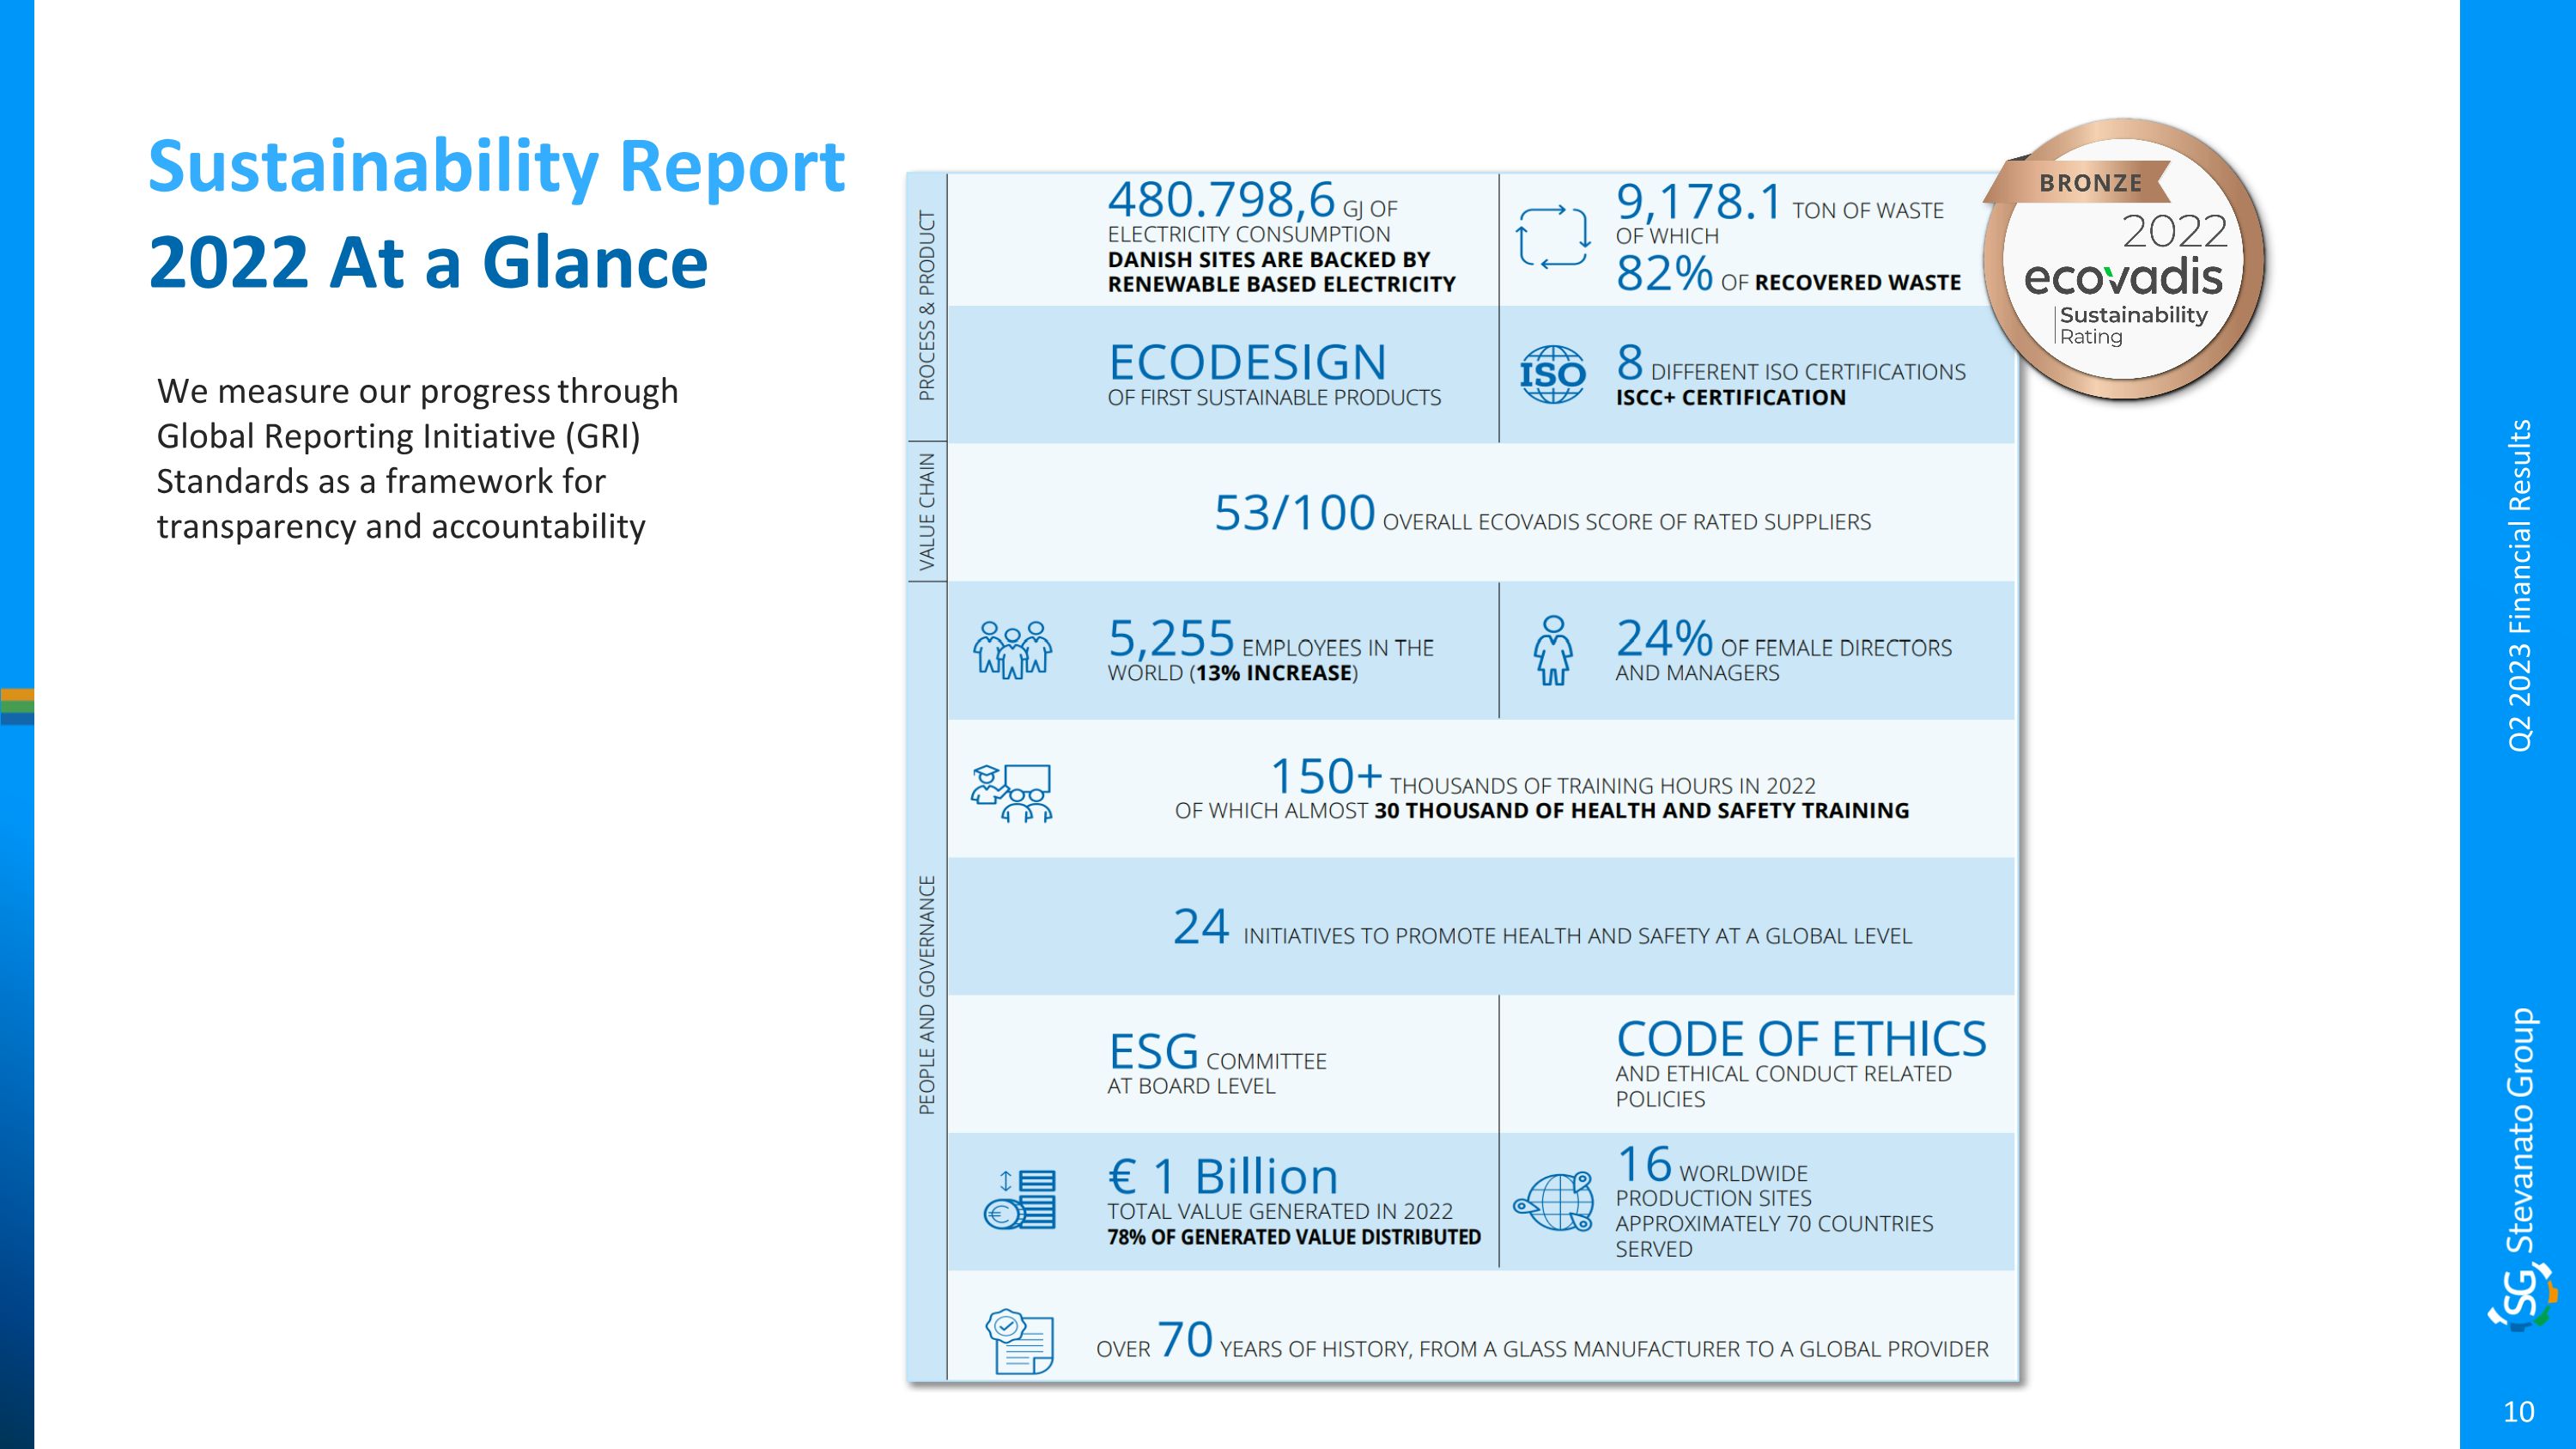
Sustainability Report 2022 At a Glance Q2 2023 Financial Results We measure our progress through Global Reporting Initiative (GRI) Standards as a framework for transparency and accountability
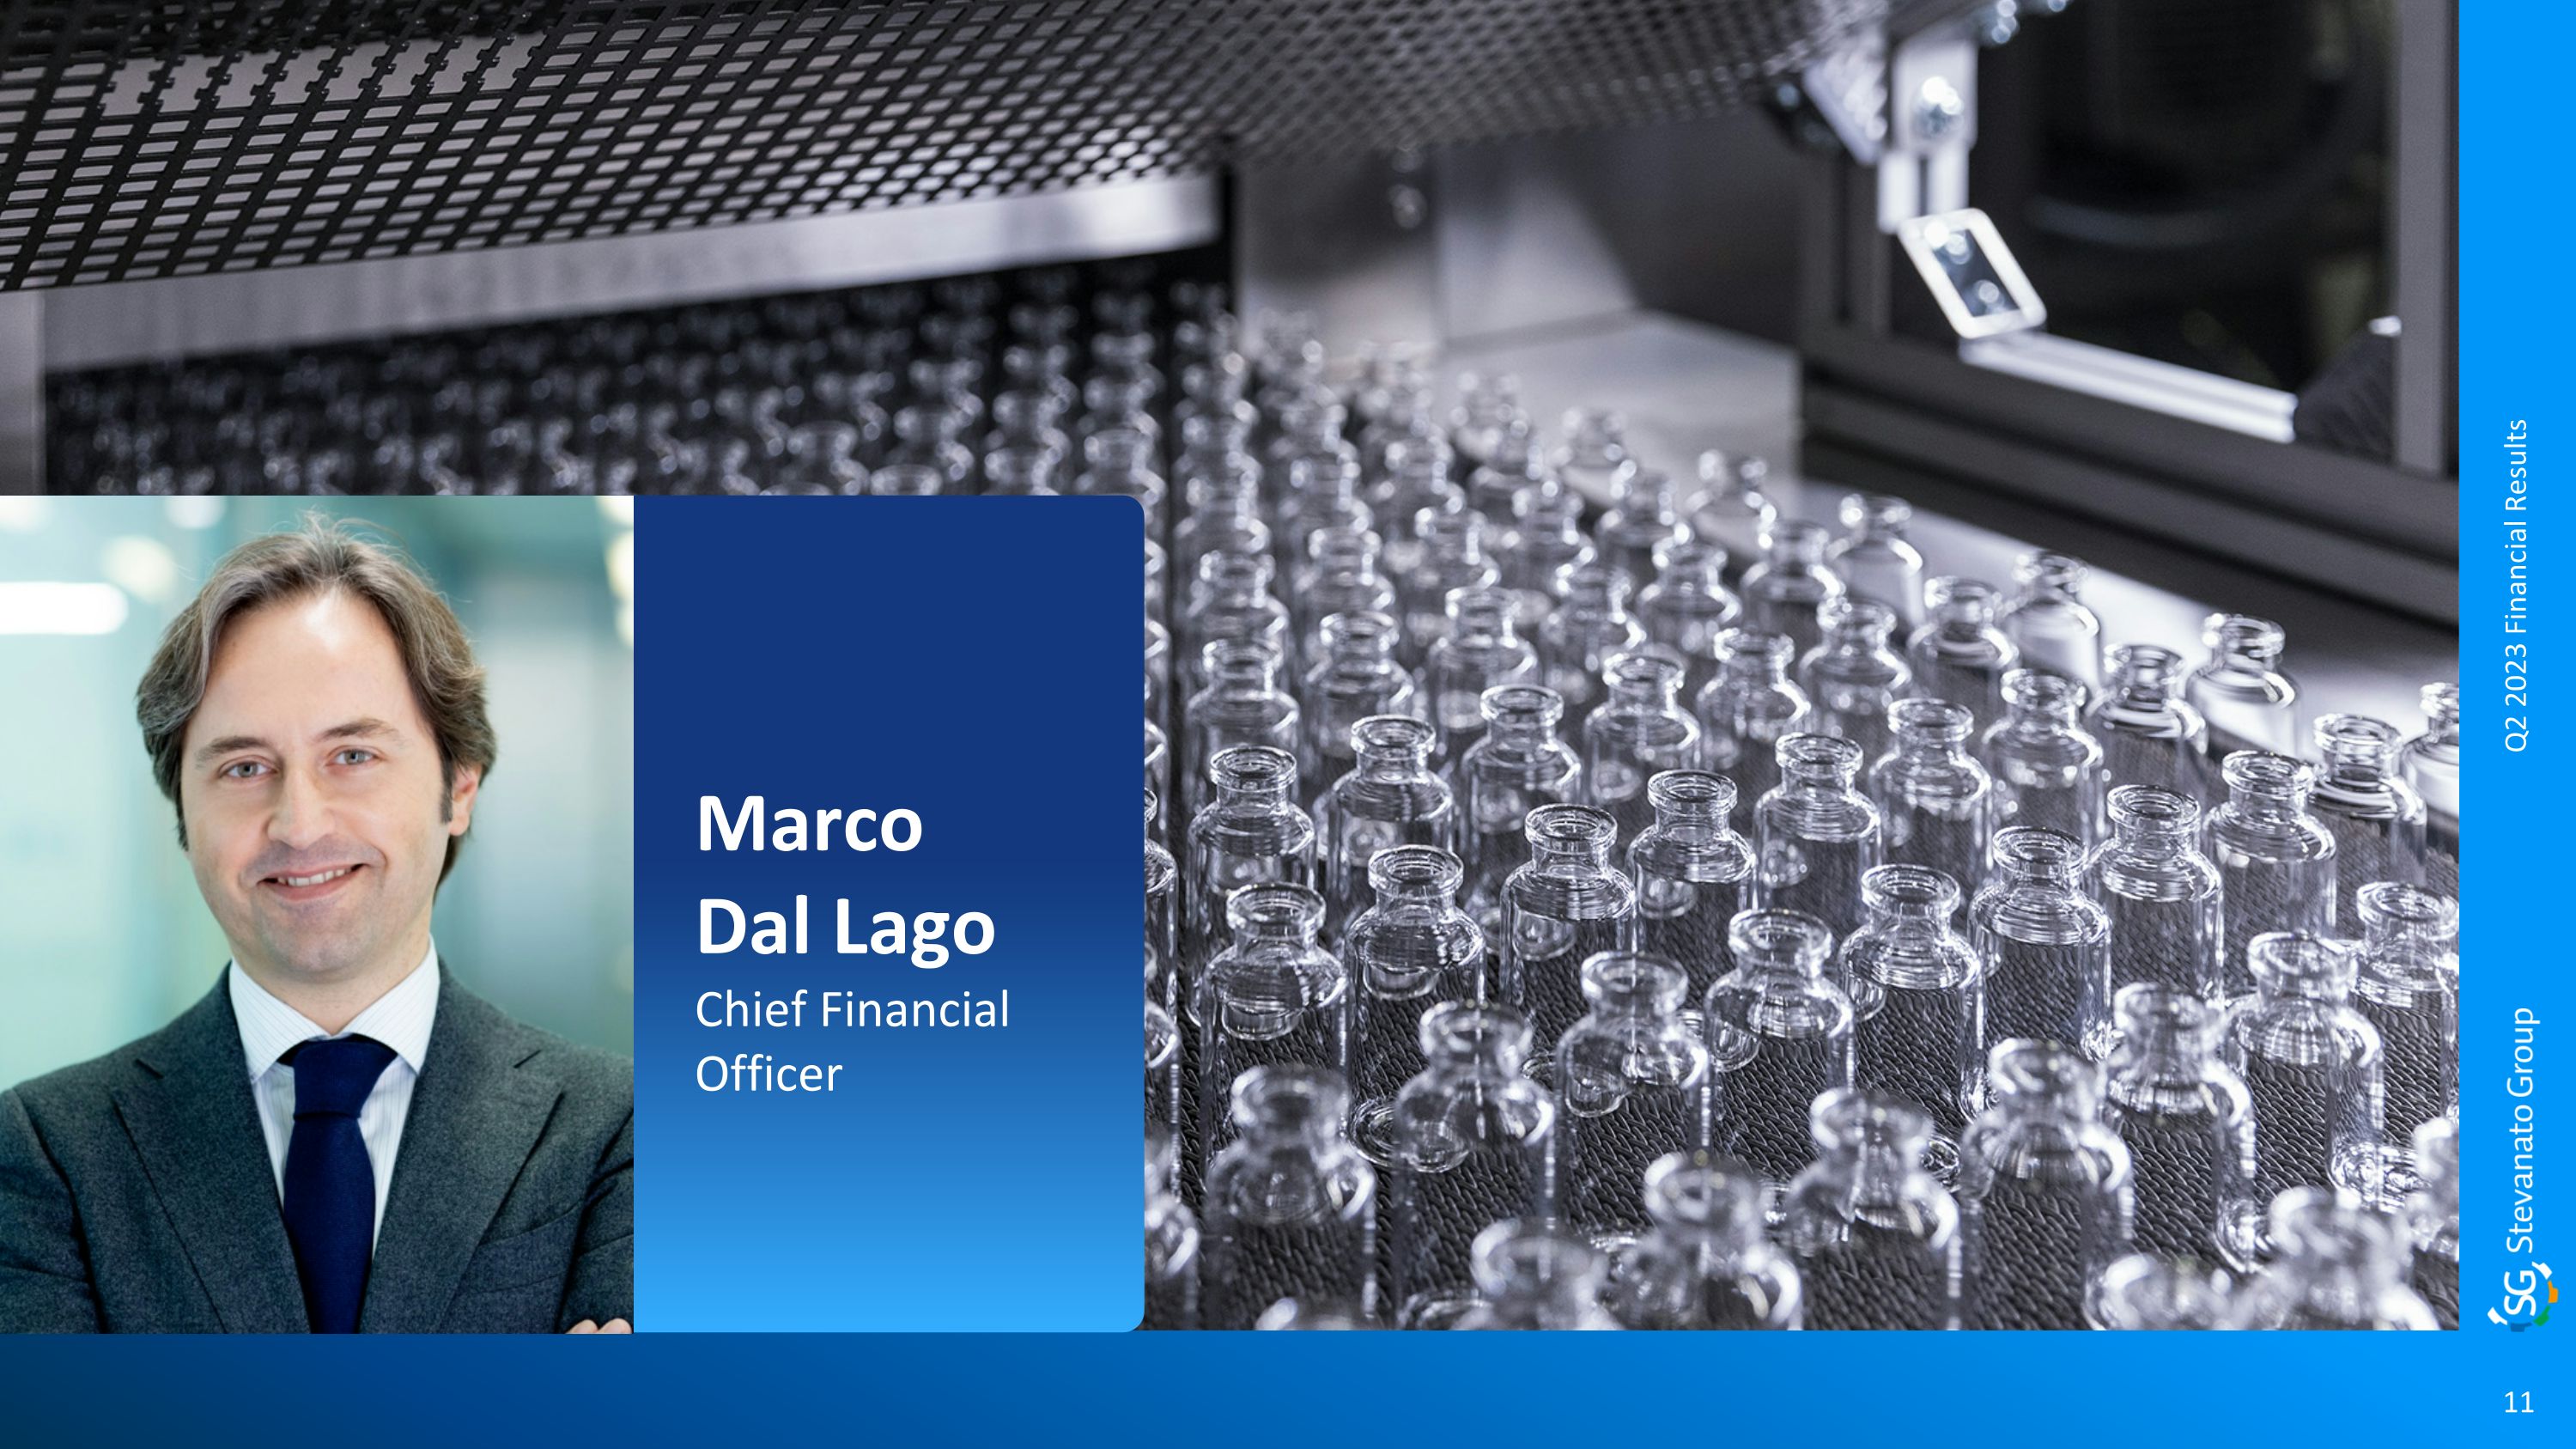
Marco Dal Lago Chief Financial Officer 11 Q2 2023 Financial Results
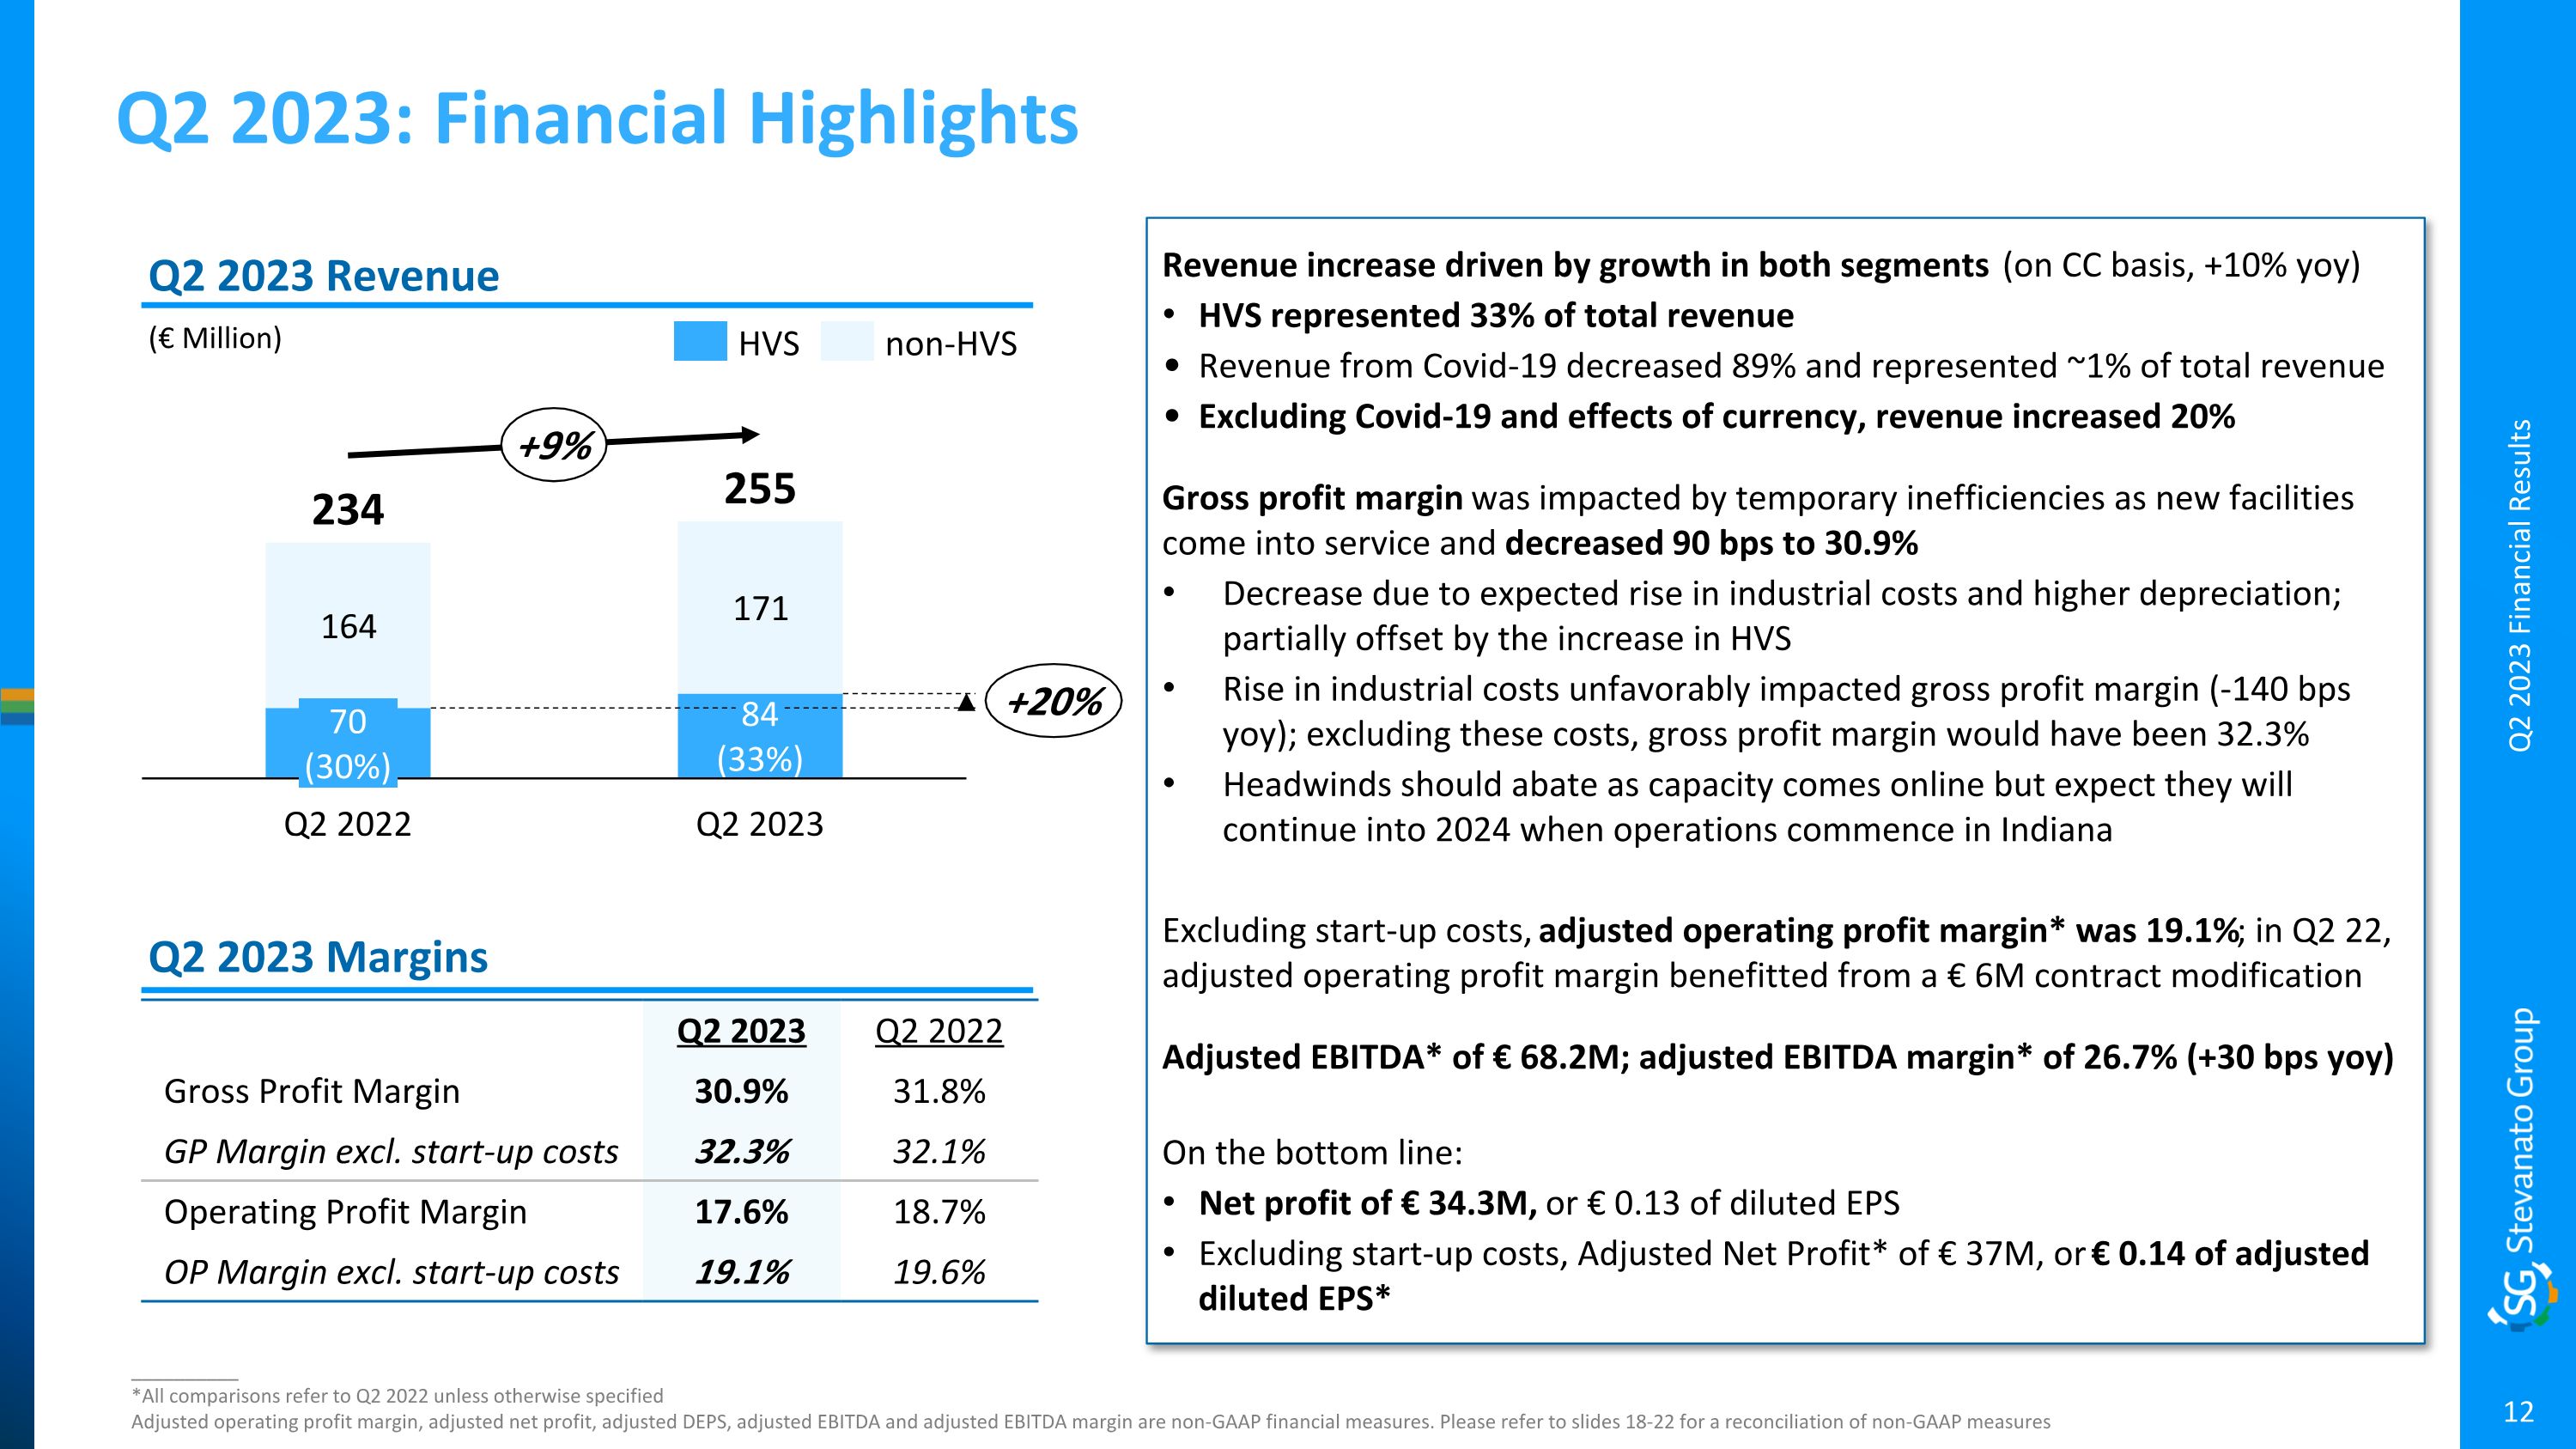
Q2 2023: Financial Highlights __________ *All comparisons refer to Q2 2022 unless otherwise specified Adjusted operating profit margin, adjusted net profit, adjusted DEPS, adjusted EBITDA and adjusted EBITDA margin are non-GAAP financial measures. Please refer to slides 18-22 for a reconciliation of non-GAAP measures (€ Million) Q2 2023 Revenue Q2 2023 Margins Q2 2023 Q2 2022 Gross Profit Margin 30.9% 31.8% GP Margin excl. start-up costs 32.3% 32.1% Operating Profit Margin 17.6% 18.7% OP Margin excl. start-up costs 19.1% 19.6% Q2 2023 Financial Results Q2 2023 Q2 2022 234 255 84 (33%) 70 (30%) +20% +9% HVS non-HVS Revenue increase driven by growth in both segments (on CC basis, +10% yoy) HVS represented 33% of total revenue Revenue from Covid-19 decreased 89% and represented ~1% of total revenue Excluding Covid-19 and effects of currency, revenue increased 20% Gross profit margin was impacted by temporary inefficiencies as new facilities come into service and decreased 90 bps to 30.9% Decrease due to expected rise in industrial costs and higher depreciation; partially offset by the increase in HVS Rise in industrial costs unfavorably impacted gross profit margin (-140 bps yoy); excluding these costs, gross profit margin would have been 32.3% Headwinds should abate as capacity comes online but expect they will continue into 2024 when operations commence in Indiana Excluding start-up costs, adjusted operating profit margin* was 19.1%; in Q2 22, adjusted operating profit margin benefitted from a € 6M contract modification Adjusted EBITDA* of € 68.2M; adjusted EBITDA margin* of 26.7% (+30 bps yoy) On the bottom line: Net profit of € 34.3M, or € 0.13 of diluted EPS Excluding start-up costs, Adjusted Net Profit* of € 37M, or € 0.14 of adjusted diluted EPS*
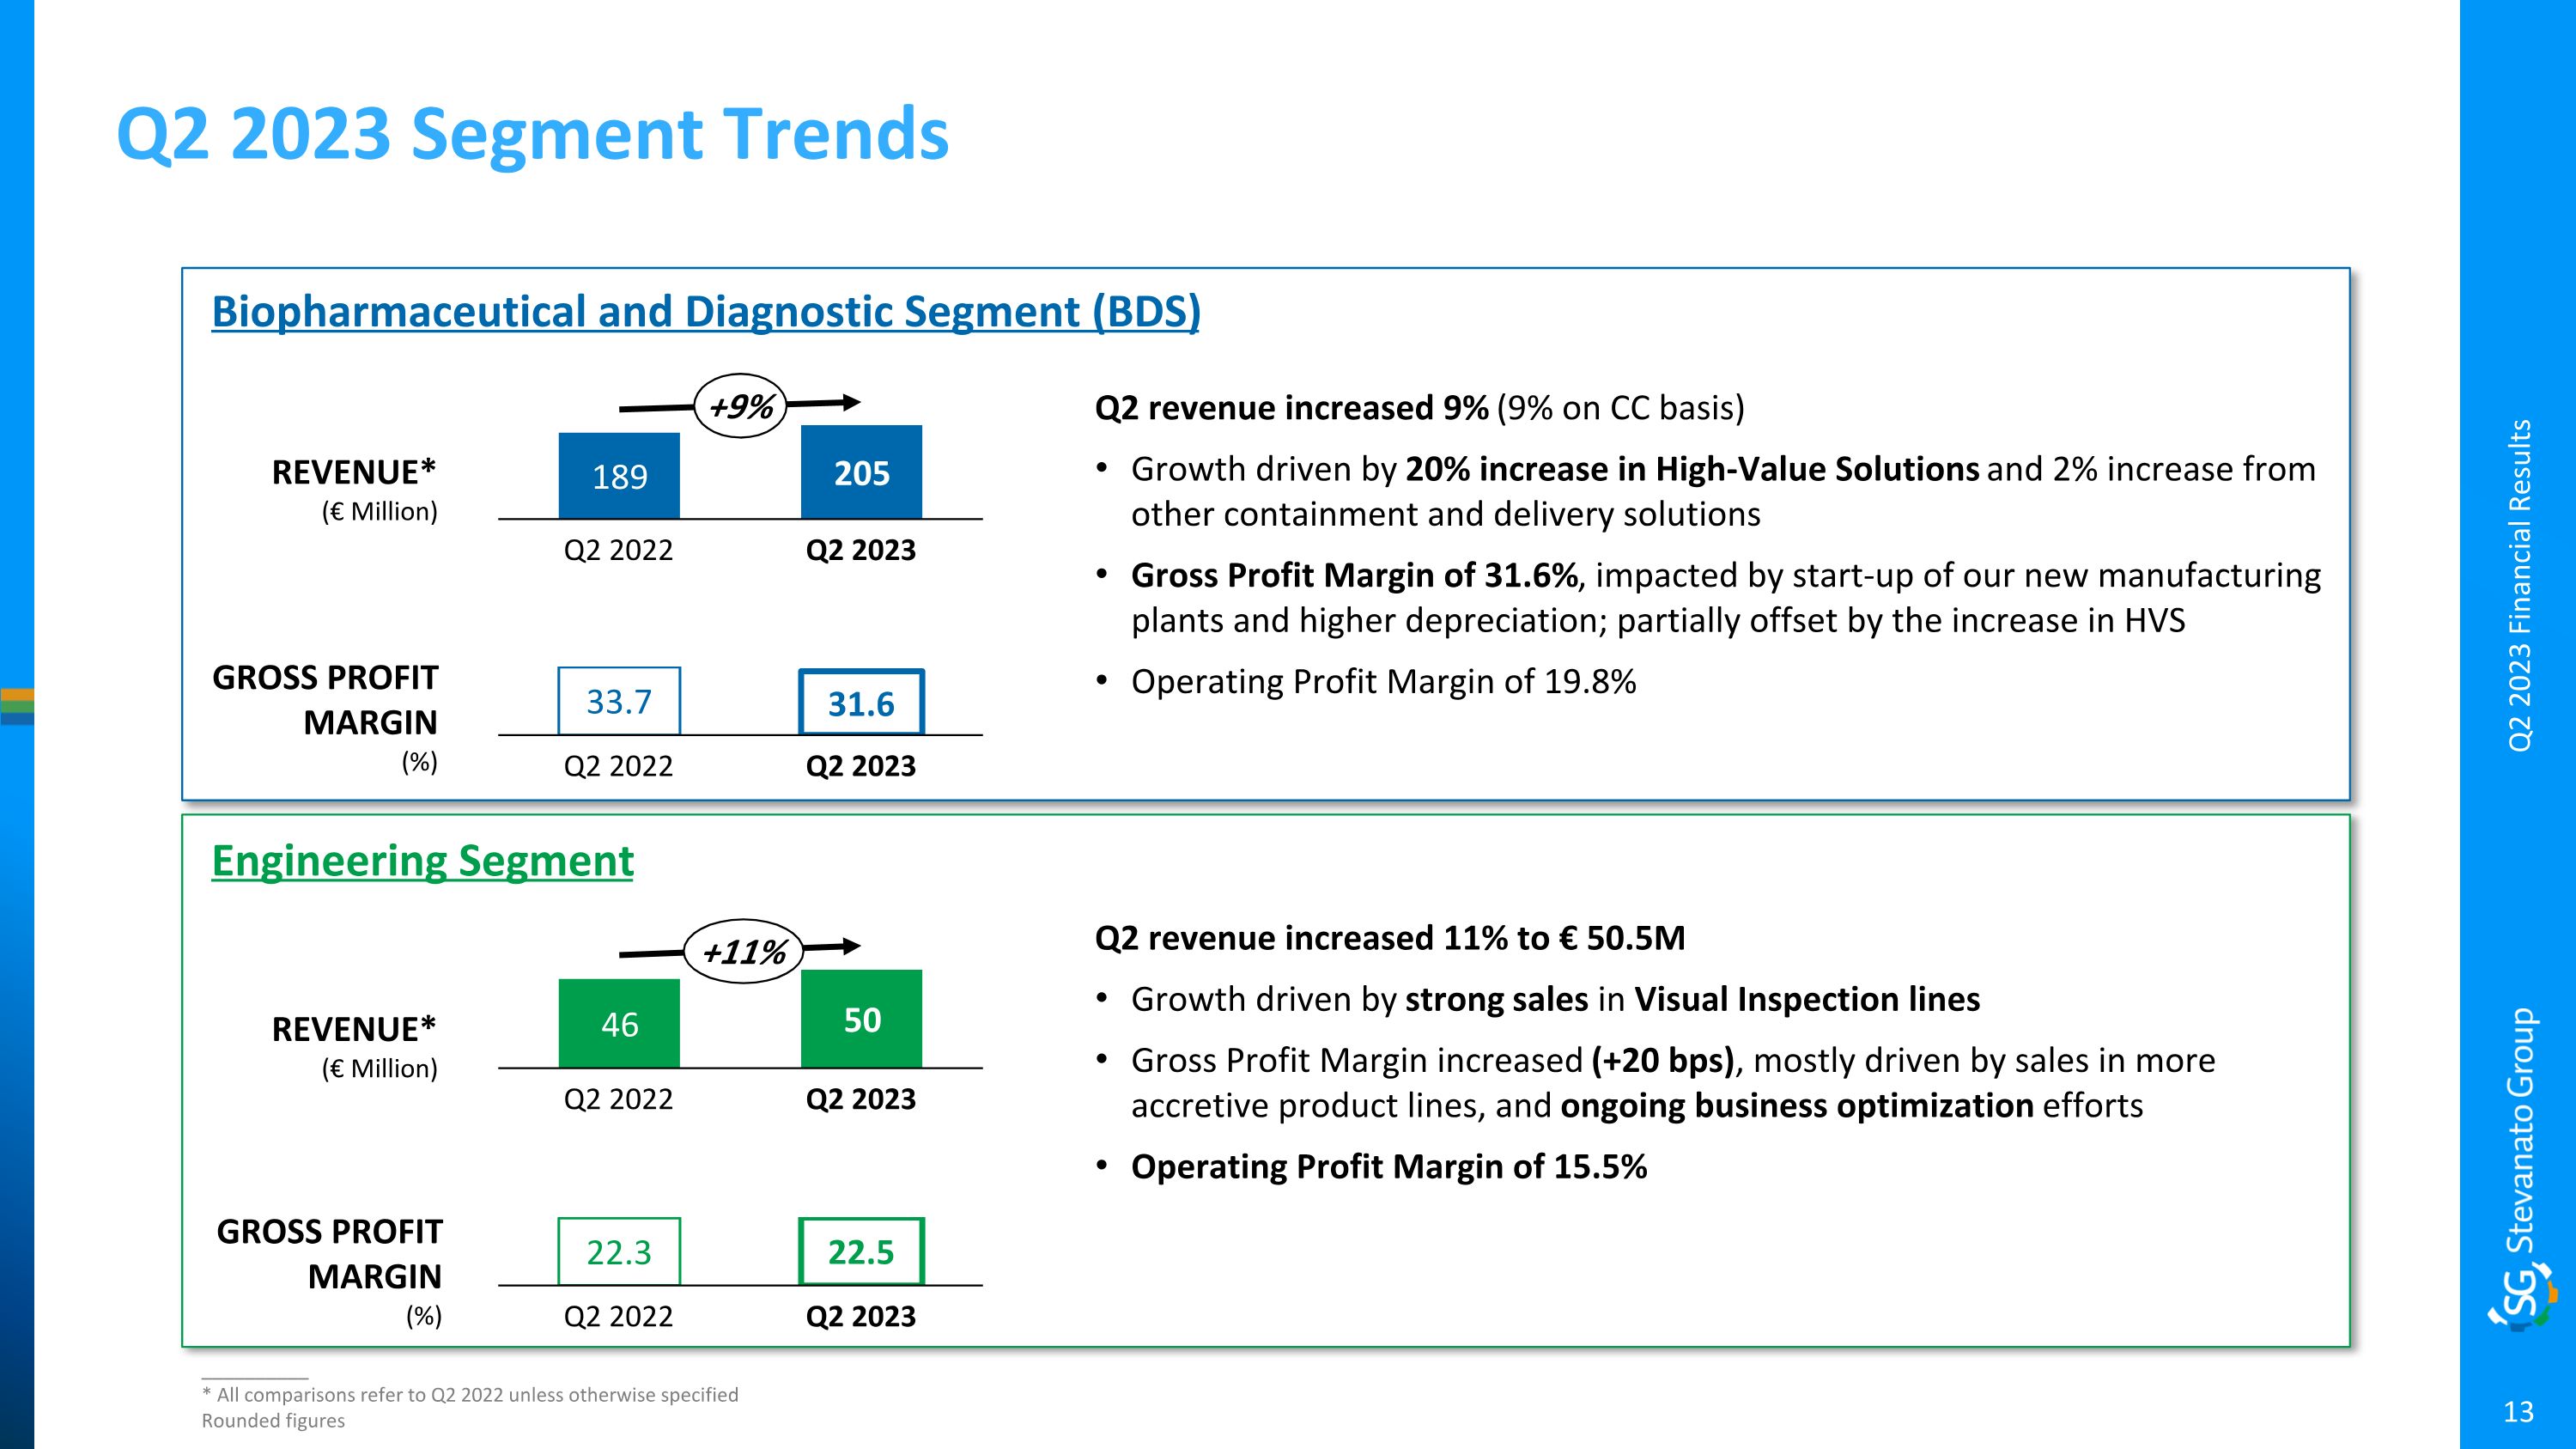
Q2 2023 Segment Trends __________ * All comparisons refer to Q2 2022 unless otherwise specified Rounded figures Q2 2022 Q2 2023 +9% Q2 revenue increased 9% (9% on CC basis) Growth driven by 20% increase in High-Value Solutions and 2% increase from other containment and delivery solutions Gross Profit Margin of 31.6%, impacted by start-up of our new manufacturing plants and higher depreciation; partially offset by the increase in HVS Operating Profit Margin of 19.8% Biopharmaceutical and Diagnostic Segment (BDS) REVENUE* (€ Million) GROSS PROFIT MARGIN (%) Engineering Segment Q2 2022 33.7 31.6 Q2 2023 Q2 2022 Q2 2023 Q2 revenue increased 11% to € 50.5M Growth driven by strong sales in Visual Inspection lines Gross Profit Margin increased (+20 bps), mostly driven by sales in more accretive product lines, and ongoing business optimization efforts Operating Profit Margin of 15.5% REVENUE* (€ Million) GROSS PROFIT MARGIN (%) 22.3 22.5 Q2 2022 Q2 2023 Q2 2023 Financial Results +11%
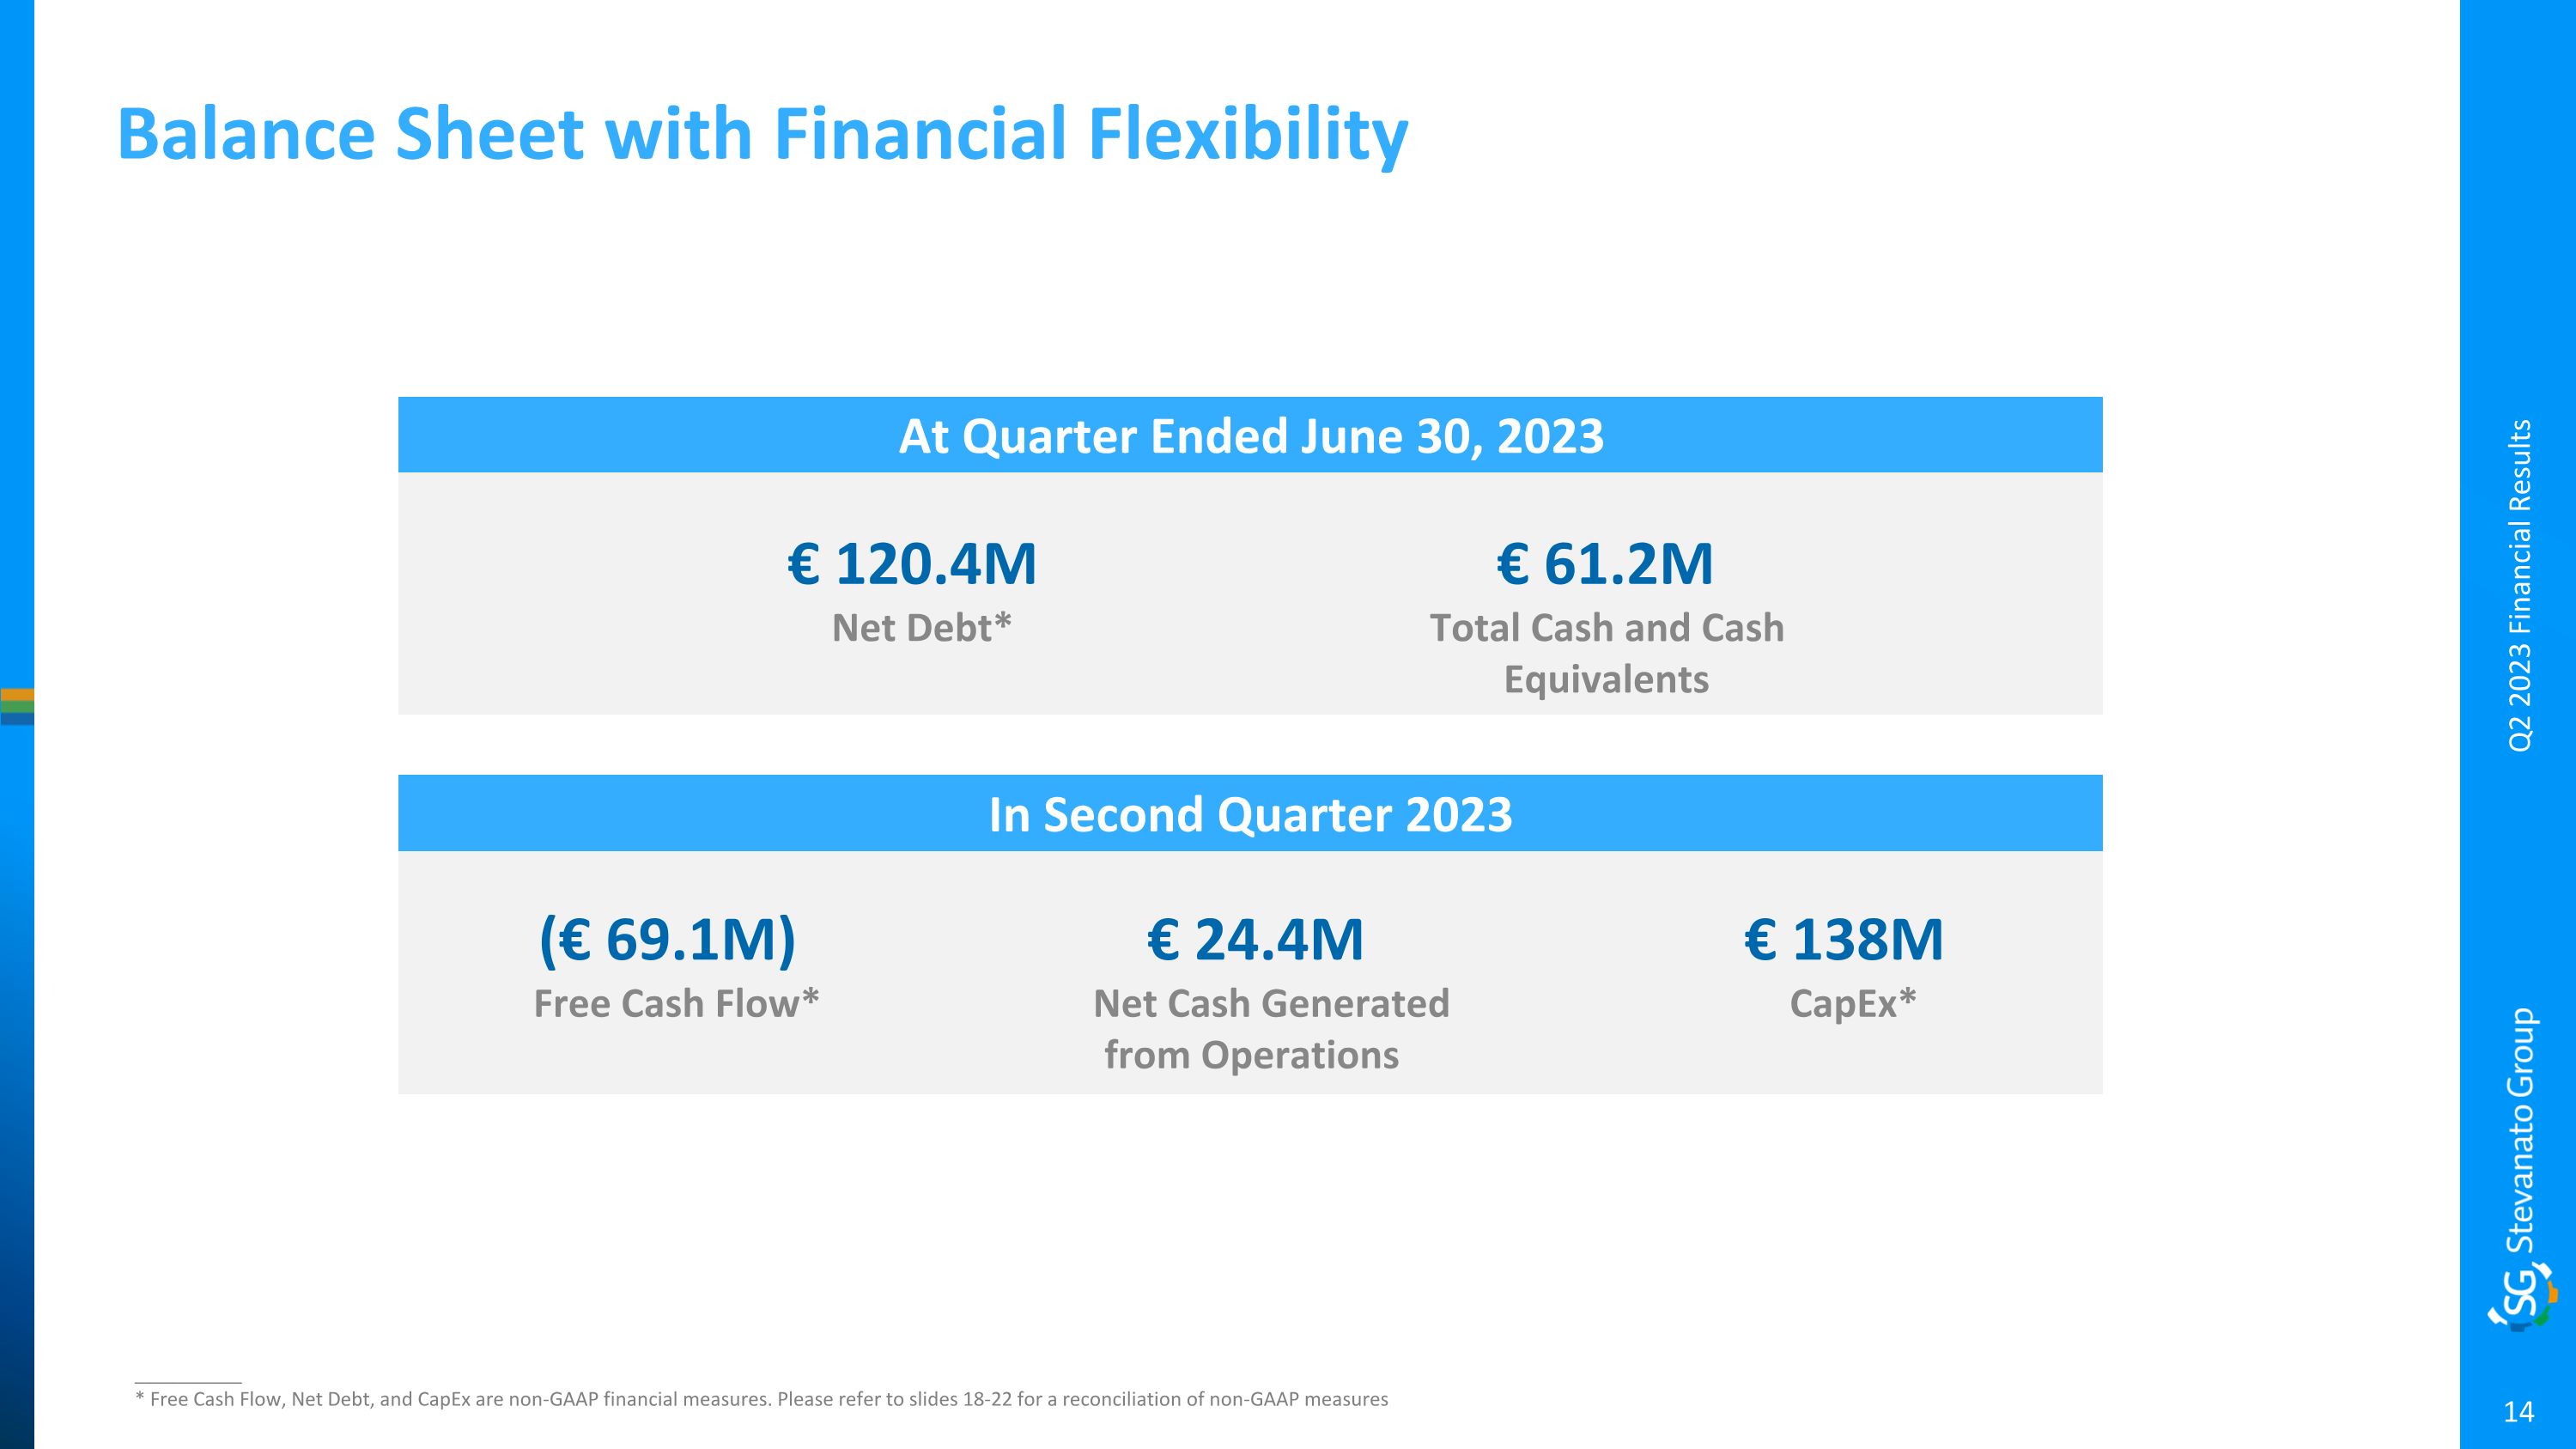
In Second Quarter 2023 Balance Sheet with Financial Flexibility At Quarter Ended June 30, 2023 __________ * Free Cash Flow, Net Debt, and CapEx are non-GAAP financial measures. Please refer to slides 18-22 for a reconciliation of non-GAAP measures Q2 2023 Financial Results (€ 69.1M) Free Cash Flow* € 120.4M Net Debt* € 61.2M Total Cash and Cash Equivalents € 138M CapEx* € 24.4M Net Cash Generated from Operations
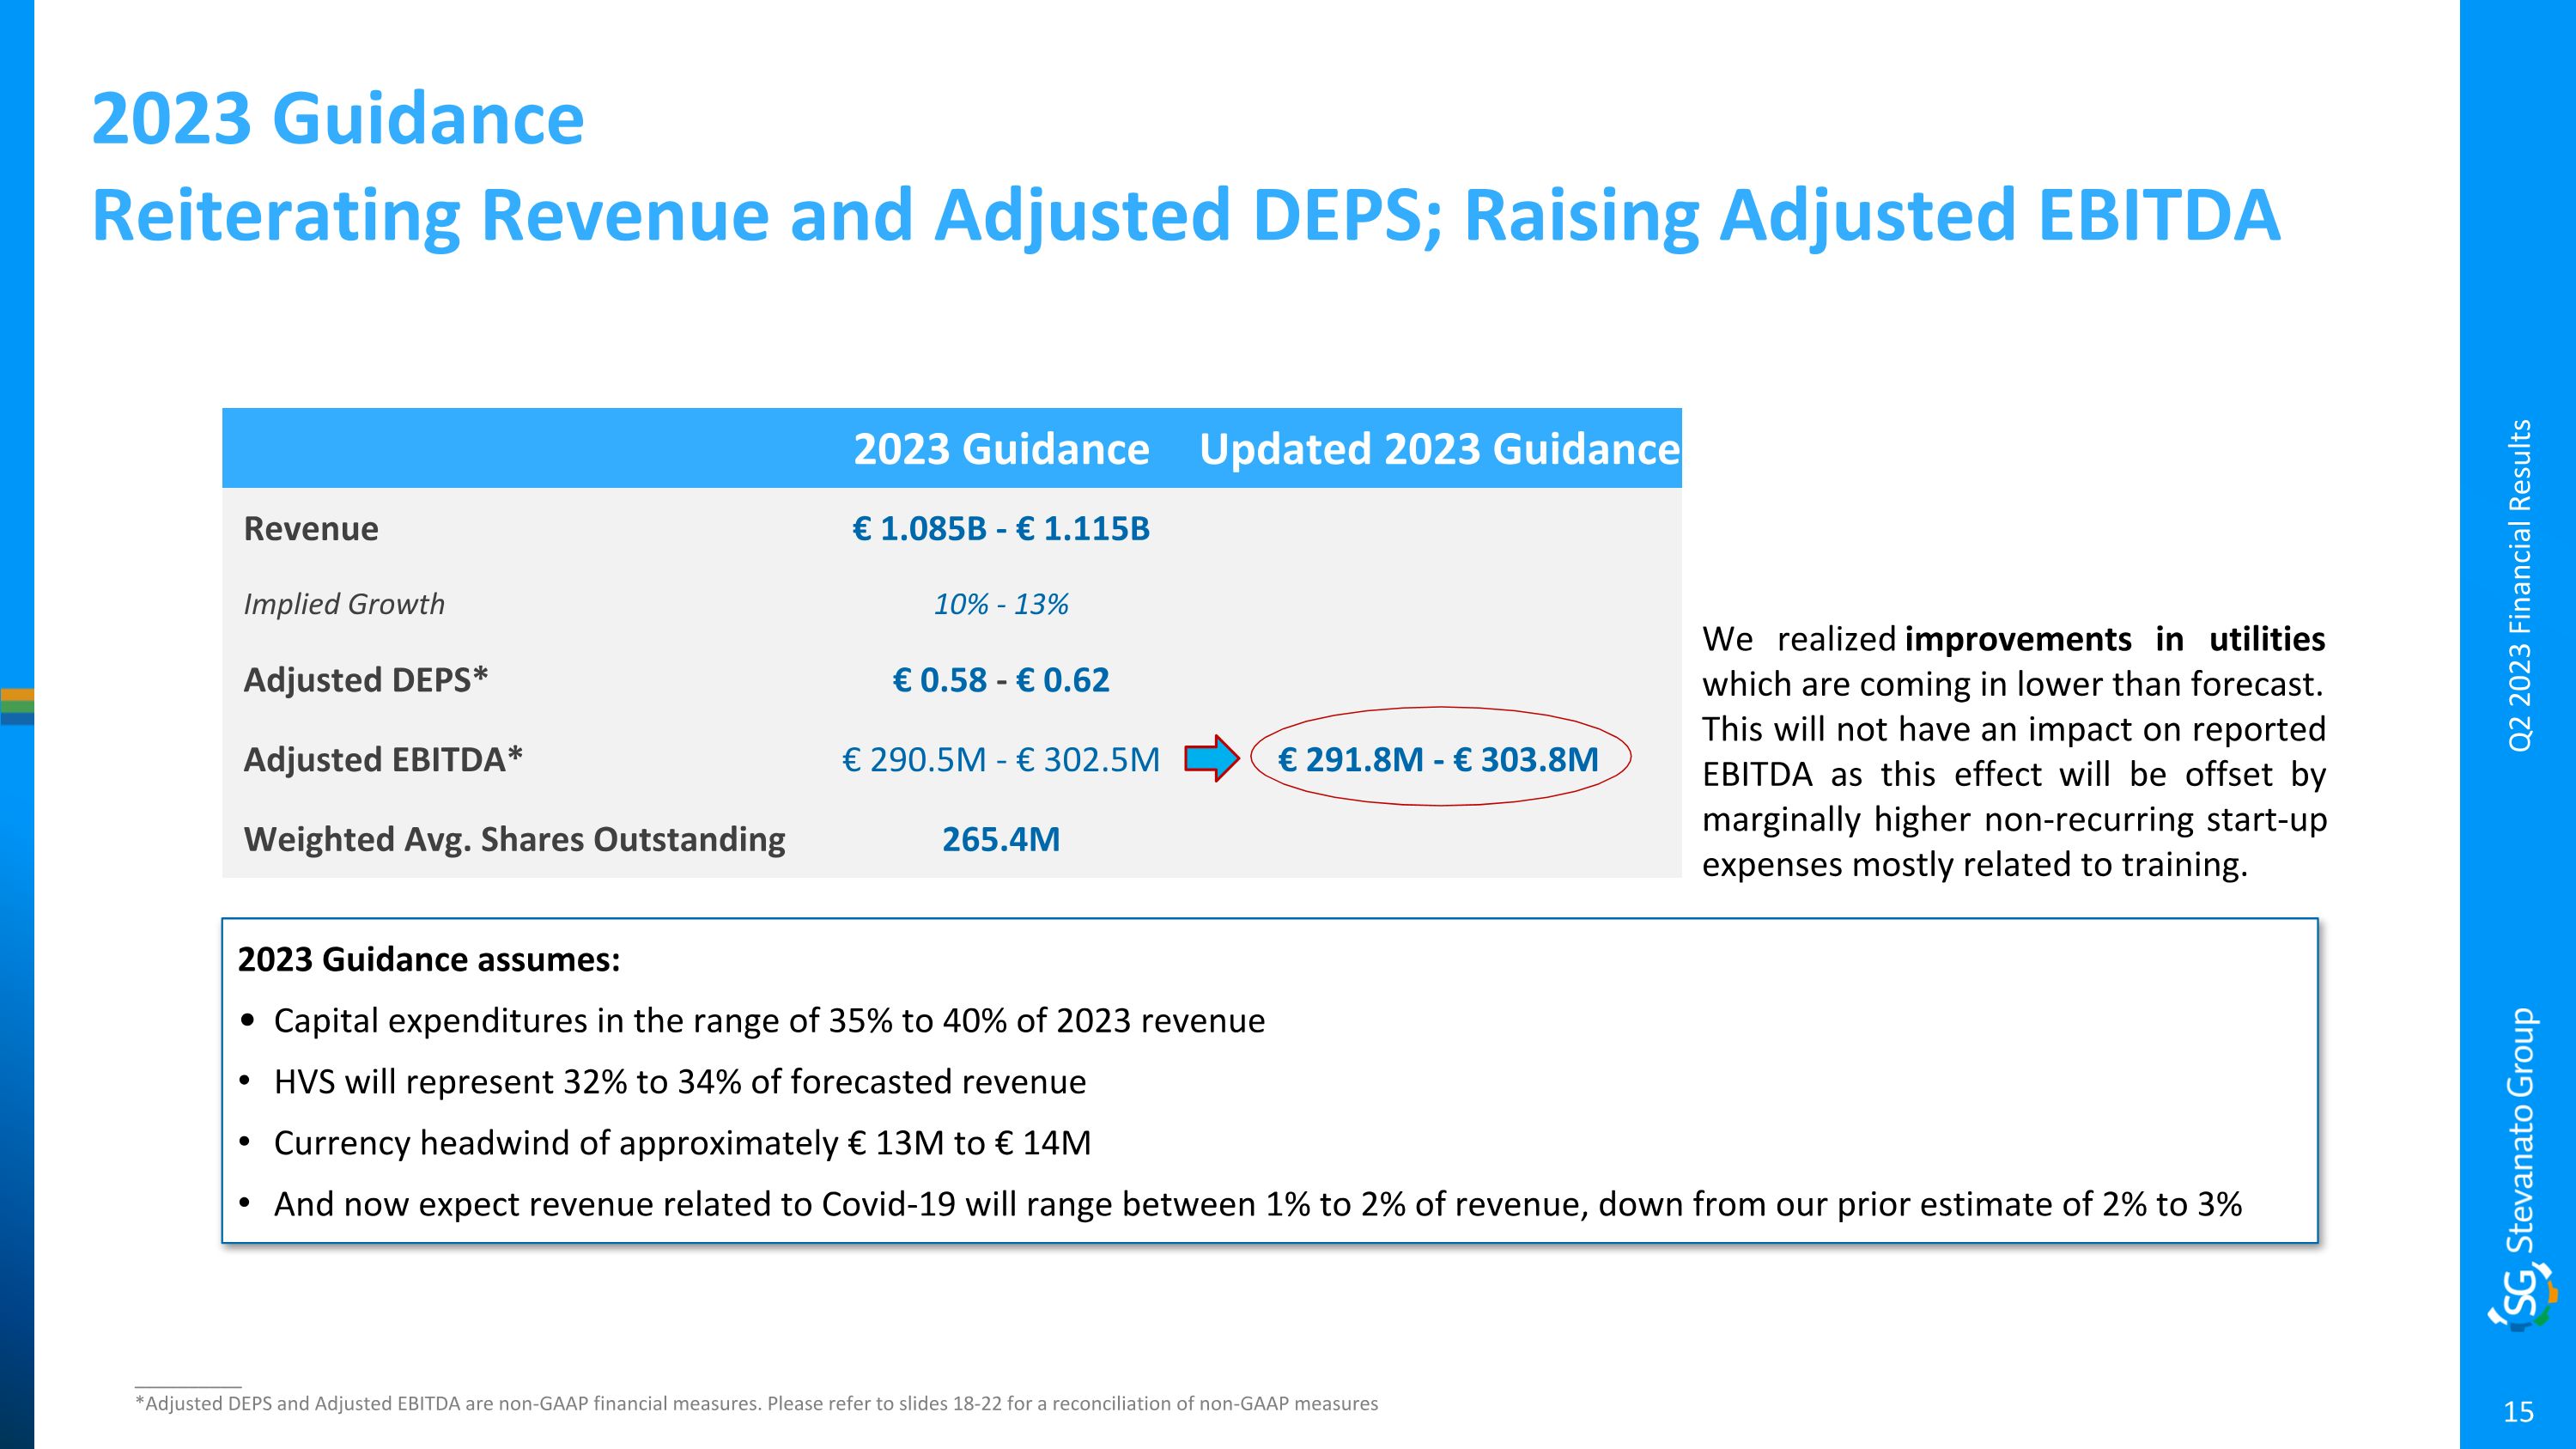
2023 Guidance assumes: Capital expenditures in the range of 35% to 40% of 2023 revenue HVS will represent 32% to 34% of forecasted revenue Currency headwind of approximately € 13M to € 14M And now expect revenue related to Covid-19 will range between 1% to 2% of revenue, down from our prior estimate of 2% to 3% 2023 Guidance Reiterating Revenue and Adjusted DEPS; Raising Adjusted EBITDA __________ *Adjusted DEPS and Adjusted EBITDA are non-GAAP financial measures. Please refer to slides 18-22 for a reconciliation of non-GAAP measures Q2 2023 Financial Results 2023 Guidance Updated 2023 Guidance Revenue € 1.085B - € 1.115B Implied Growth 10% - 13% Adjusted DEPS* € 0.58 - € 0.62 Adjusted EBITDA* € 290.5M - € 302.5M € 291.8M - € 303.8M Weighted Avg. Shares Outstanding 265.4M We realized improvements in utilities which are coming in lower than forecast. This will not have an impact on reported EBITDA as this effect will be offset by marginally higher non-recurring start-up expenses mostly related to training.
Franco Moro Chief Executive Officer 16 Q2 2023 Financial Results
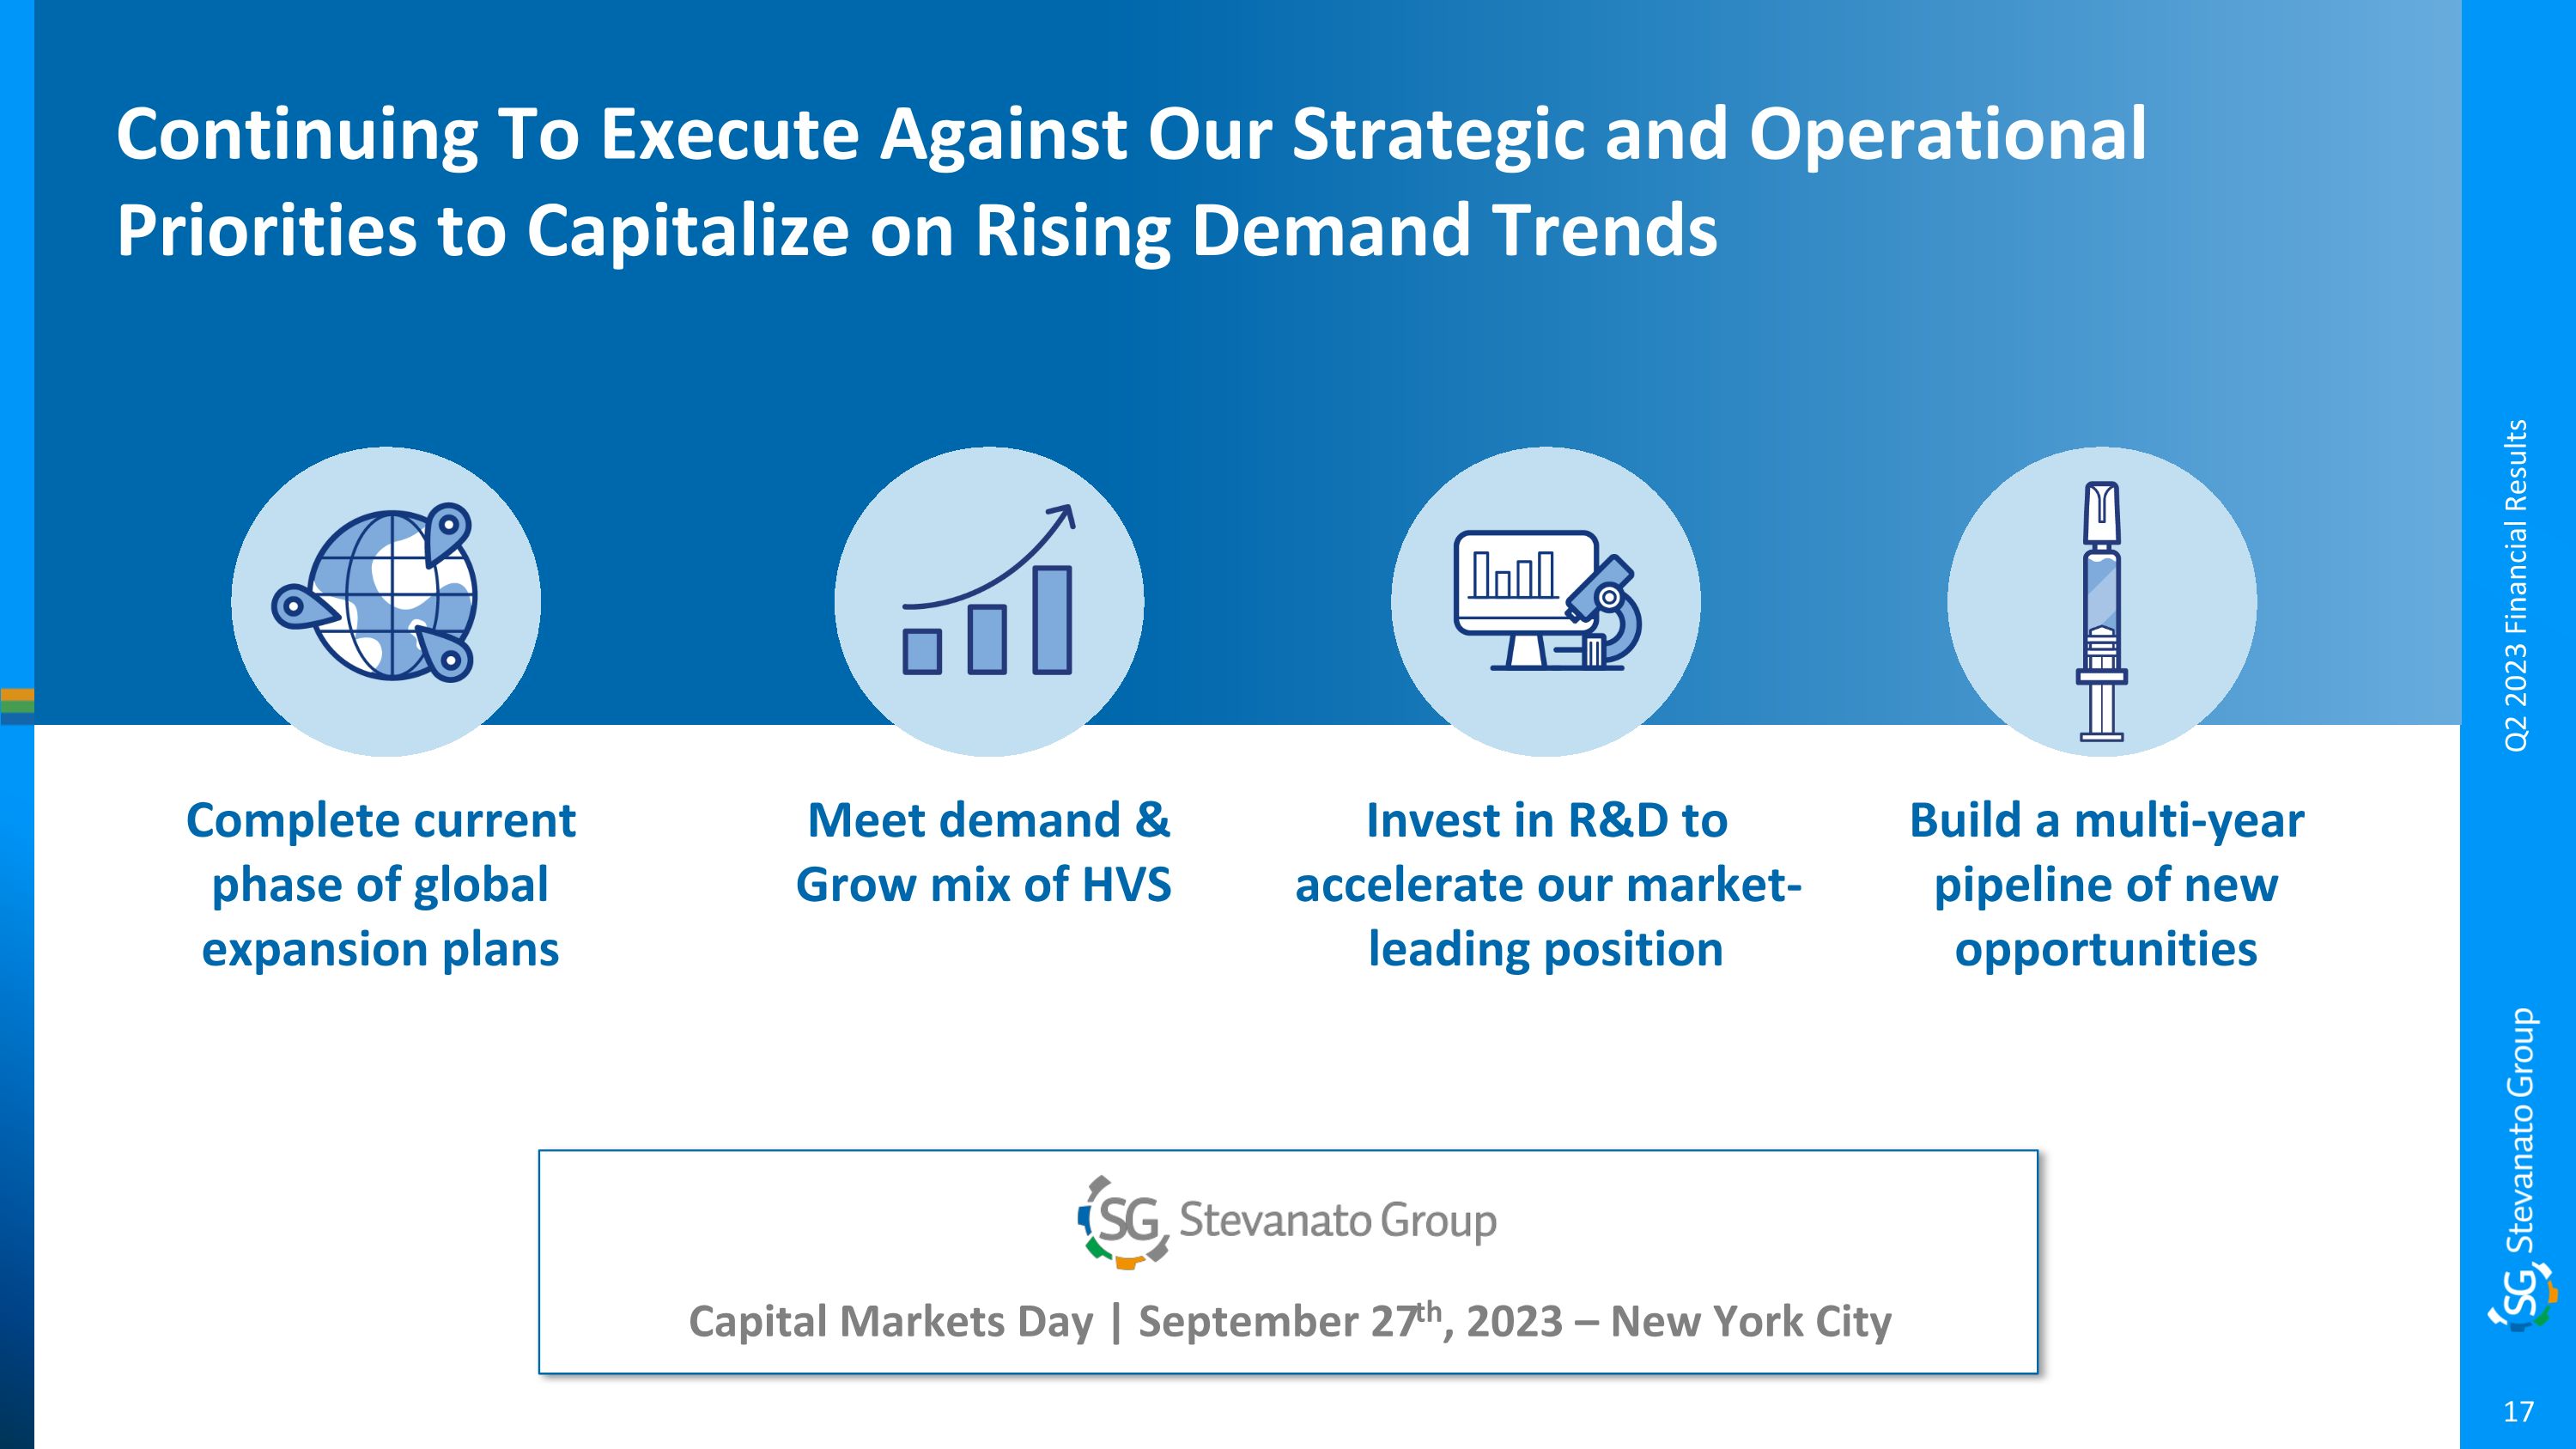
Continuing To Execute Against Our Strategic and Operational Priorities to Capitalize on Rising Demand Trends Complete current phase of global expansion plans Meet demand & Grow mix of HVS Invest in R&D to accelerate our market-leading position Build a multi-year pipeline of new opportunities 17 Q2 2023 Financial Results Capital Markets Day | September 27th, 2023 – New York City
Reconciliation of Non-GAAP Financial Measures (Unaudited) This presentation contains non-GAAP financial measures. Please refer to the tables included in this presentation for a reconciliation of non-GAAP measures. Management monitors and evaluates our operating and financial performance using several non-GAAP financial measures, including Constant Currency Revenue, EBITDA, Adjusted EBITDA, Adjusted EBITDA Margin, Adjusted Operating Profit, Adjusted Operating Profit Margin, Adjusted Income Taxes, Adjusted Net Profit, Adjusted Diluted EPS, Capital Employed, Net Cash, Free Cash Flow, and CapEx. We believe that these non-GAAP financial measures provide useful and relevant information regarding our performance and improve our ability to assess our financial condition. While similar measures are widely used in the industry in which we operate, the financial measures we use may not be comparable to other similarly titled measures used by other companies, nor are they intended to be substitutes for measures of financial performance or financial position as prepared in accordance with IFRS. 18 Notes to Non-GAAP Financial Measures Q2 2023 Financial Results
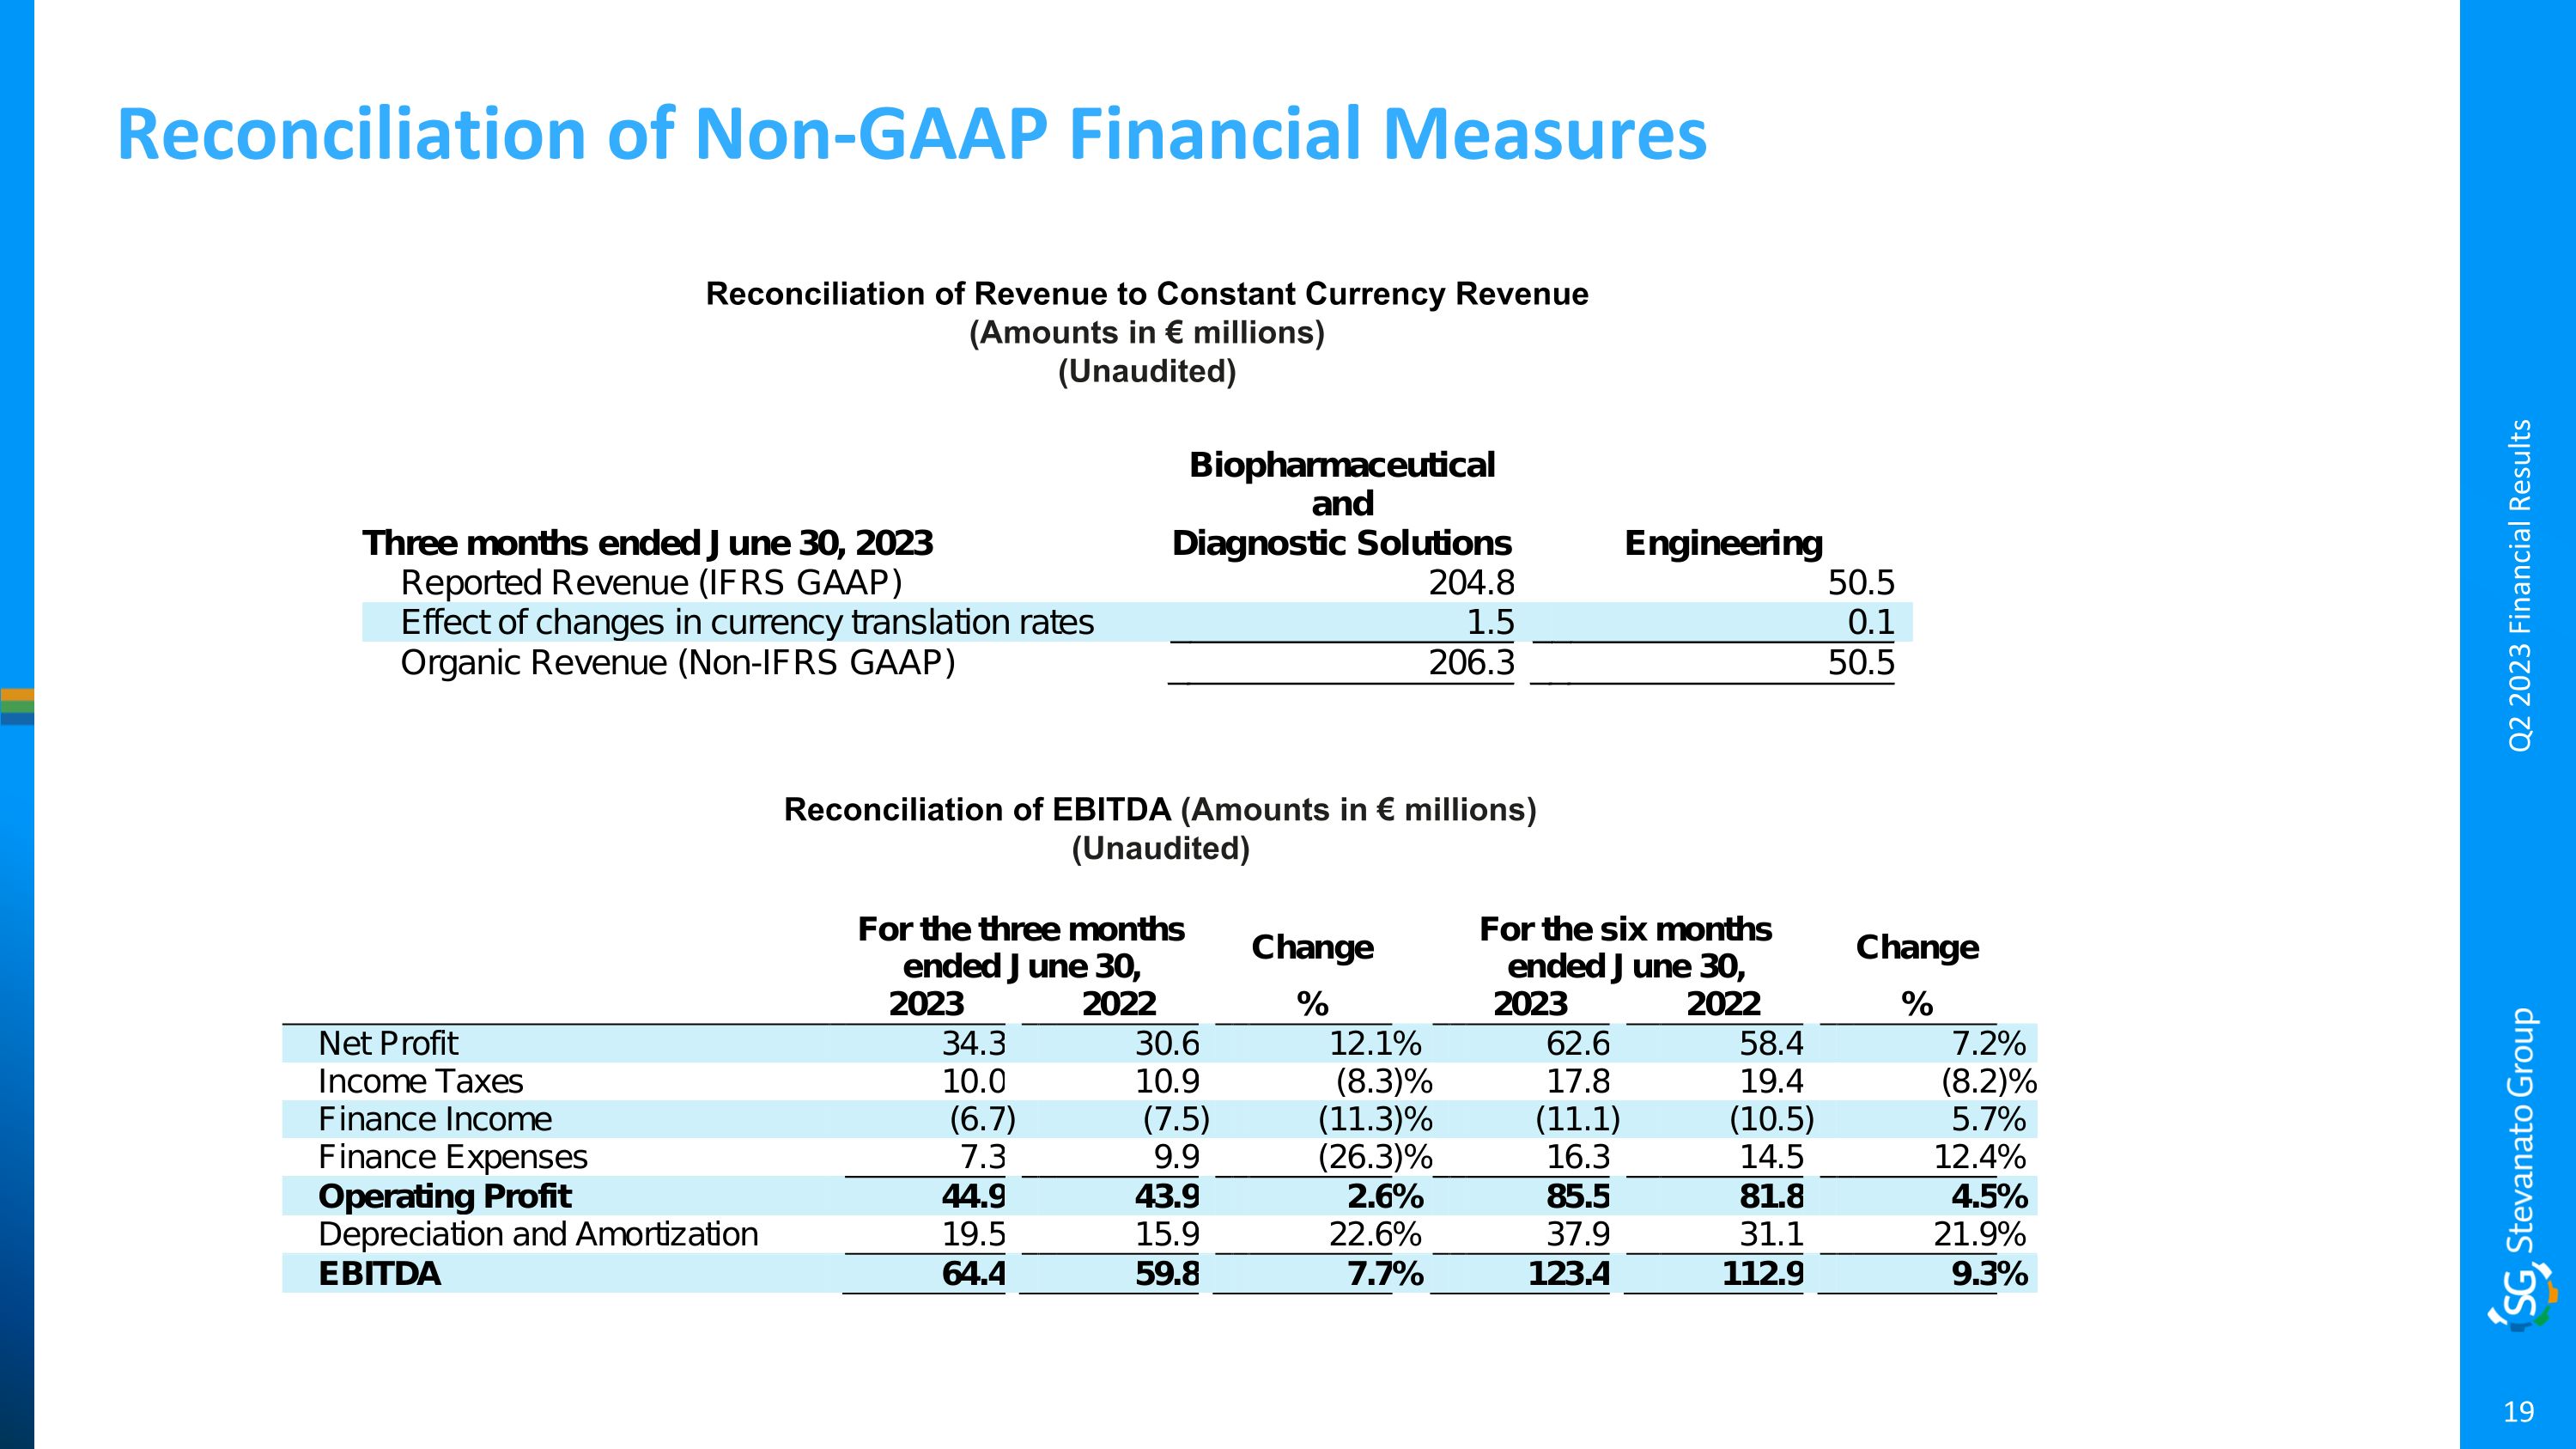
Reconciliation of Non-GAAP Financial Measures Reconciliation of Revenue to Constant Currency Revenue (Amounts in € millions) (Unaudited) Q2 2023 Financial Results Reconciliation of EBITDA (Amounts in € millions) (Unaudited)
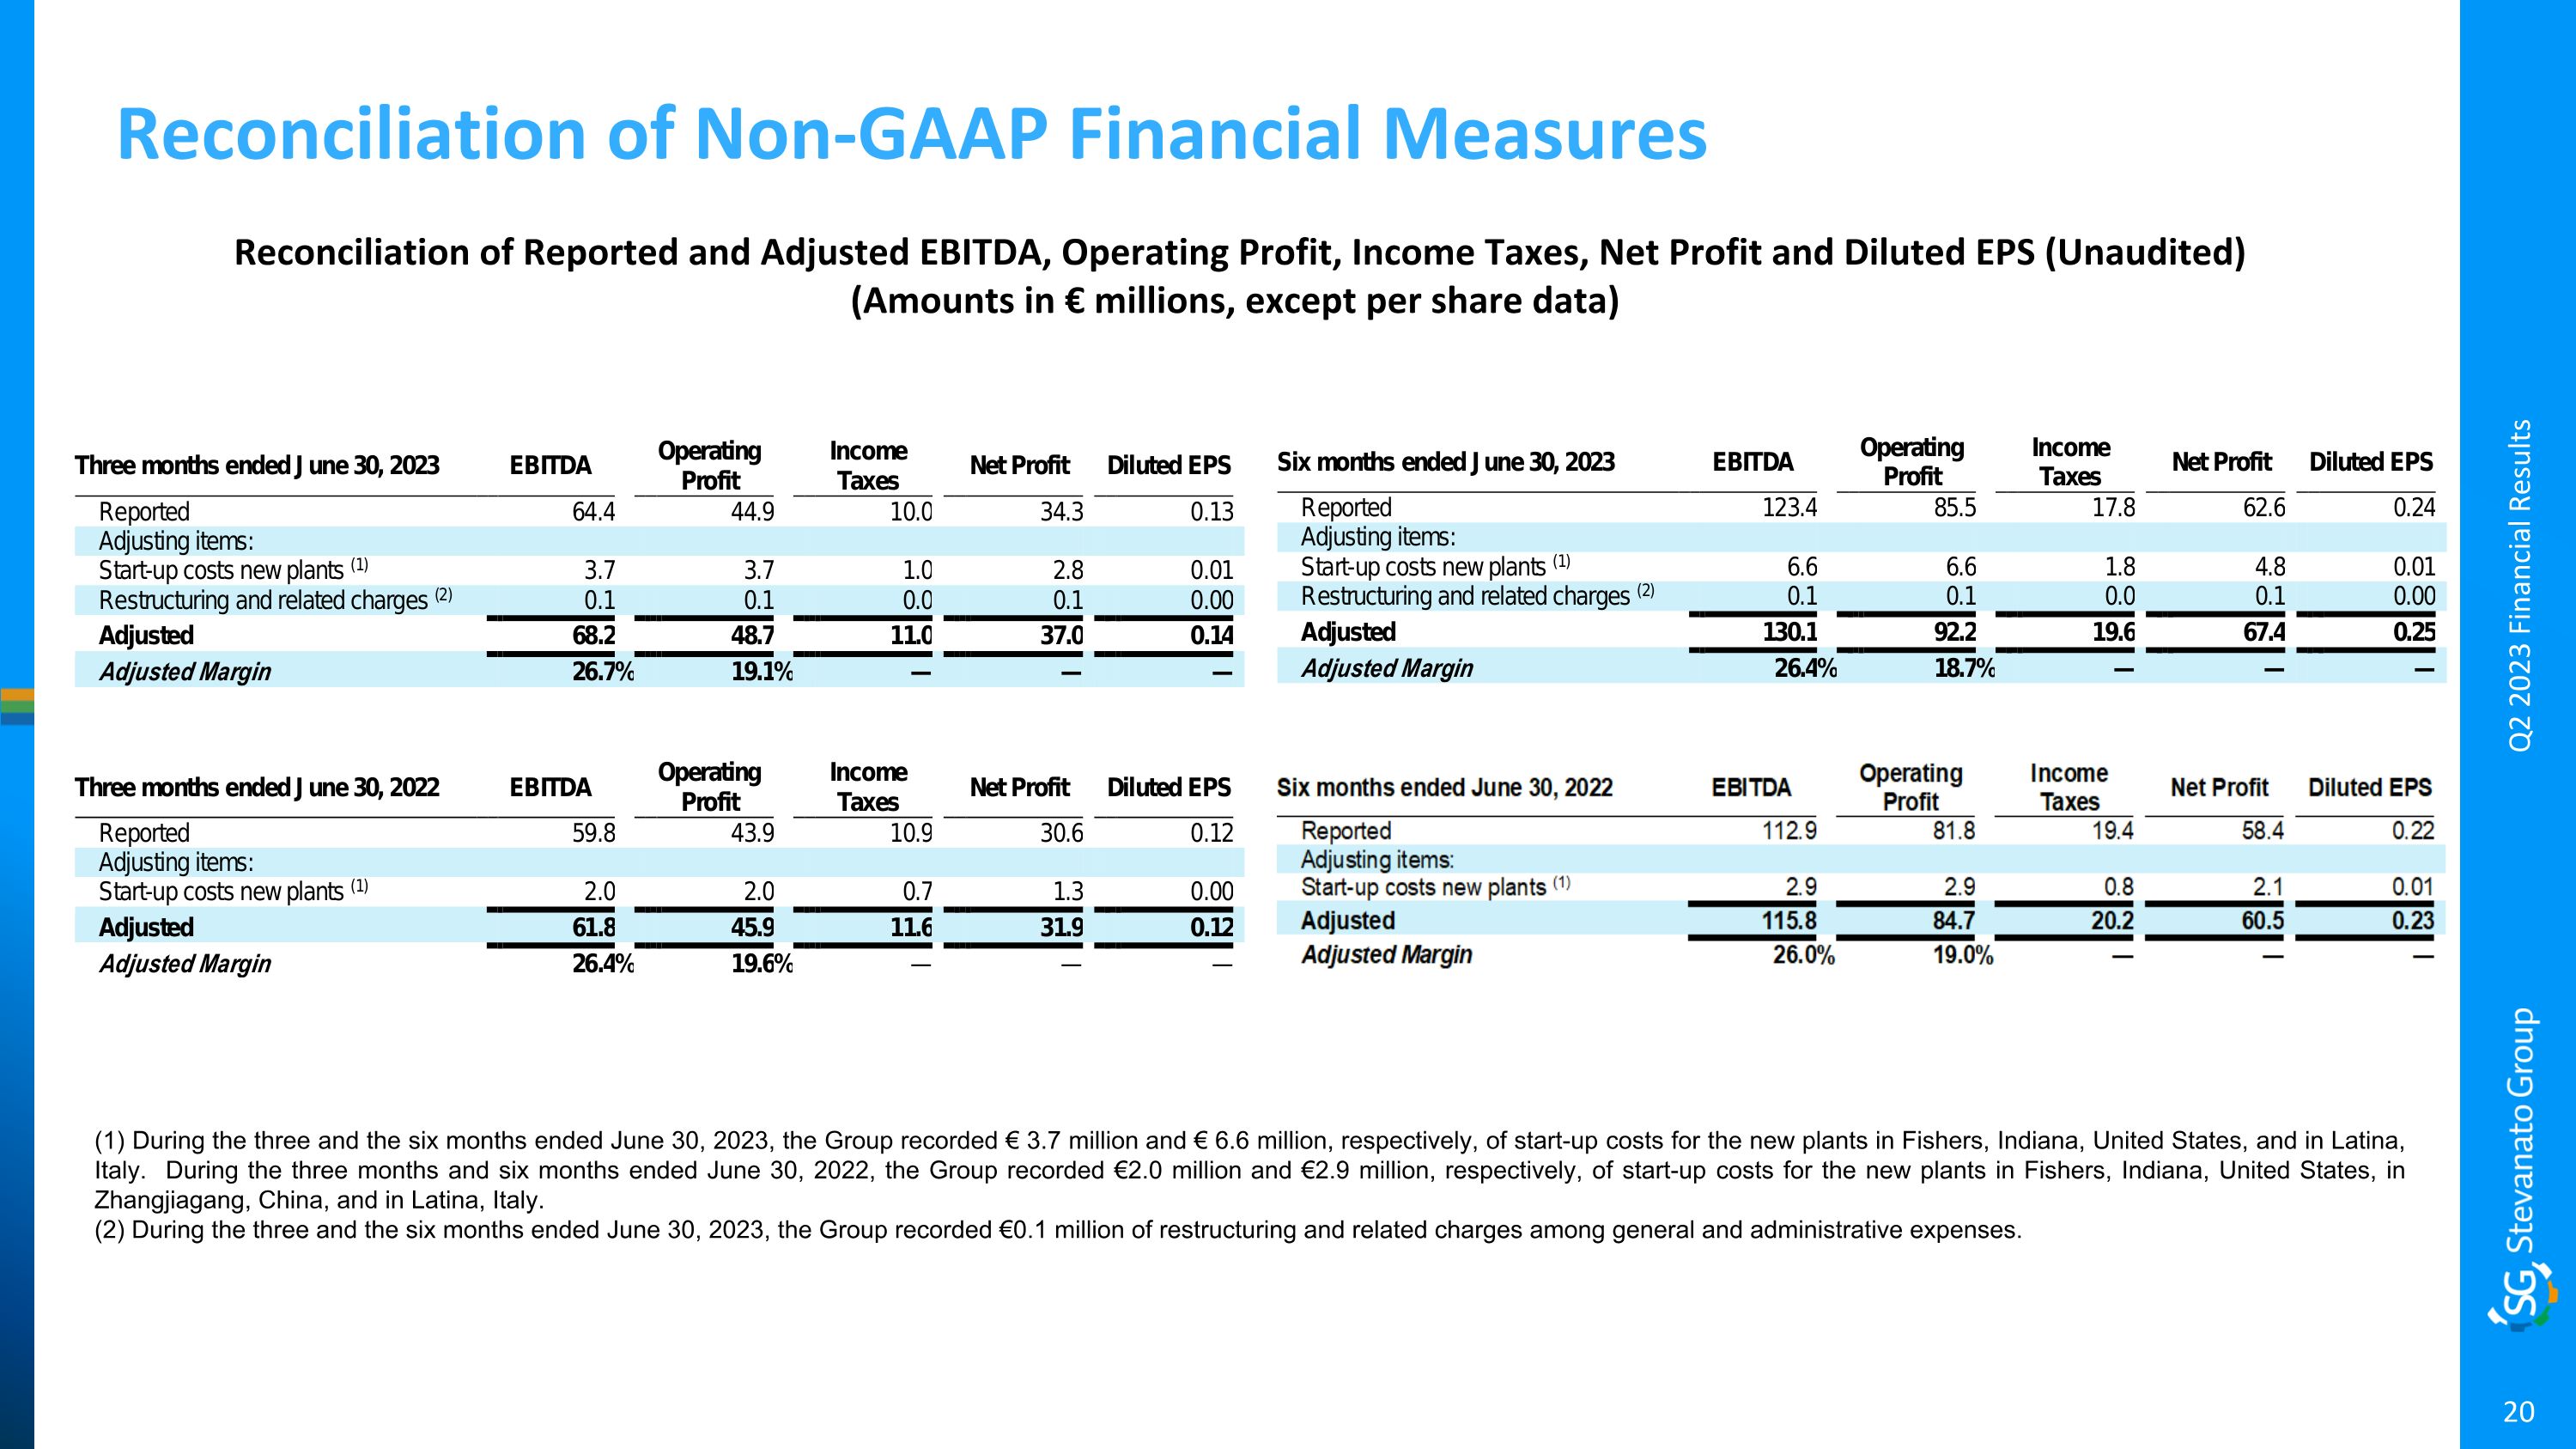
Reconciliation of Reported and Adjusted EBITDA, Operating Profit, Income Taxes, Net Profit and Diluted EPS (Unaudited) (Amounts in € millions, except per share data) Reconciliation of Non-GAAP Financial Measures (1) During the three and the six months ended June 30, 2023, the Group recorded € 3.7 million and € 6.6 million, respectively, of start-up costs for the new plants in Fishers, Indiana, United States, and in Latina, Italy. During the three months and six months ended June 30, 2022, the Group recorded €2.0 million and €2.9 million, respectively, of start-up costs for the new plants in Fishers, Indiana, United States, in Zhangjiagang, China, and in Latina, Italy. (2) During the three and the six months ended June 30, 2023, the Group recorded €0.1 million of restructuring and related charges among general and administrative expenses. Q2 2023 Financial Results
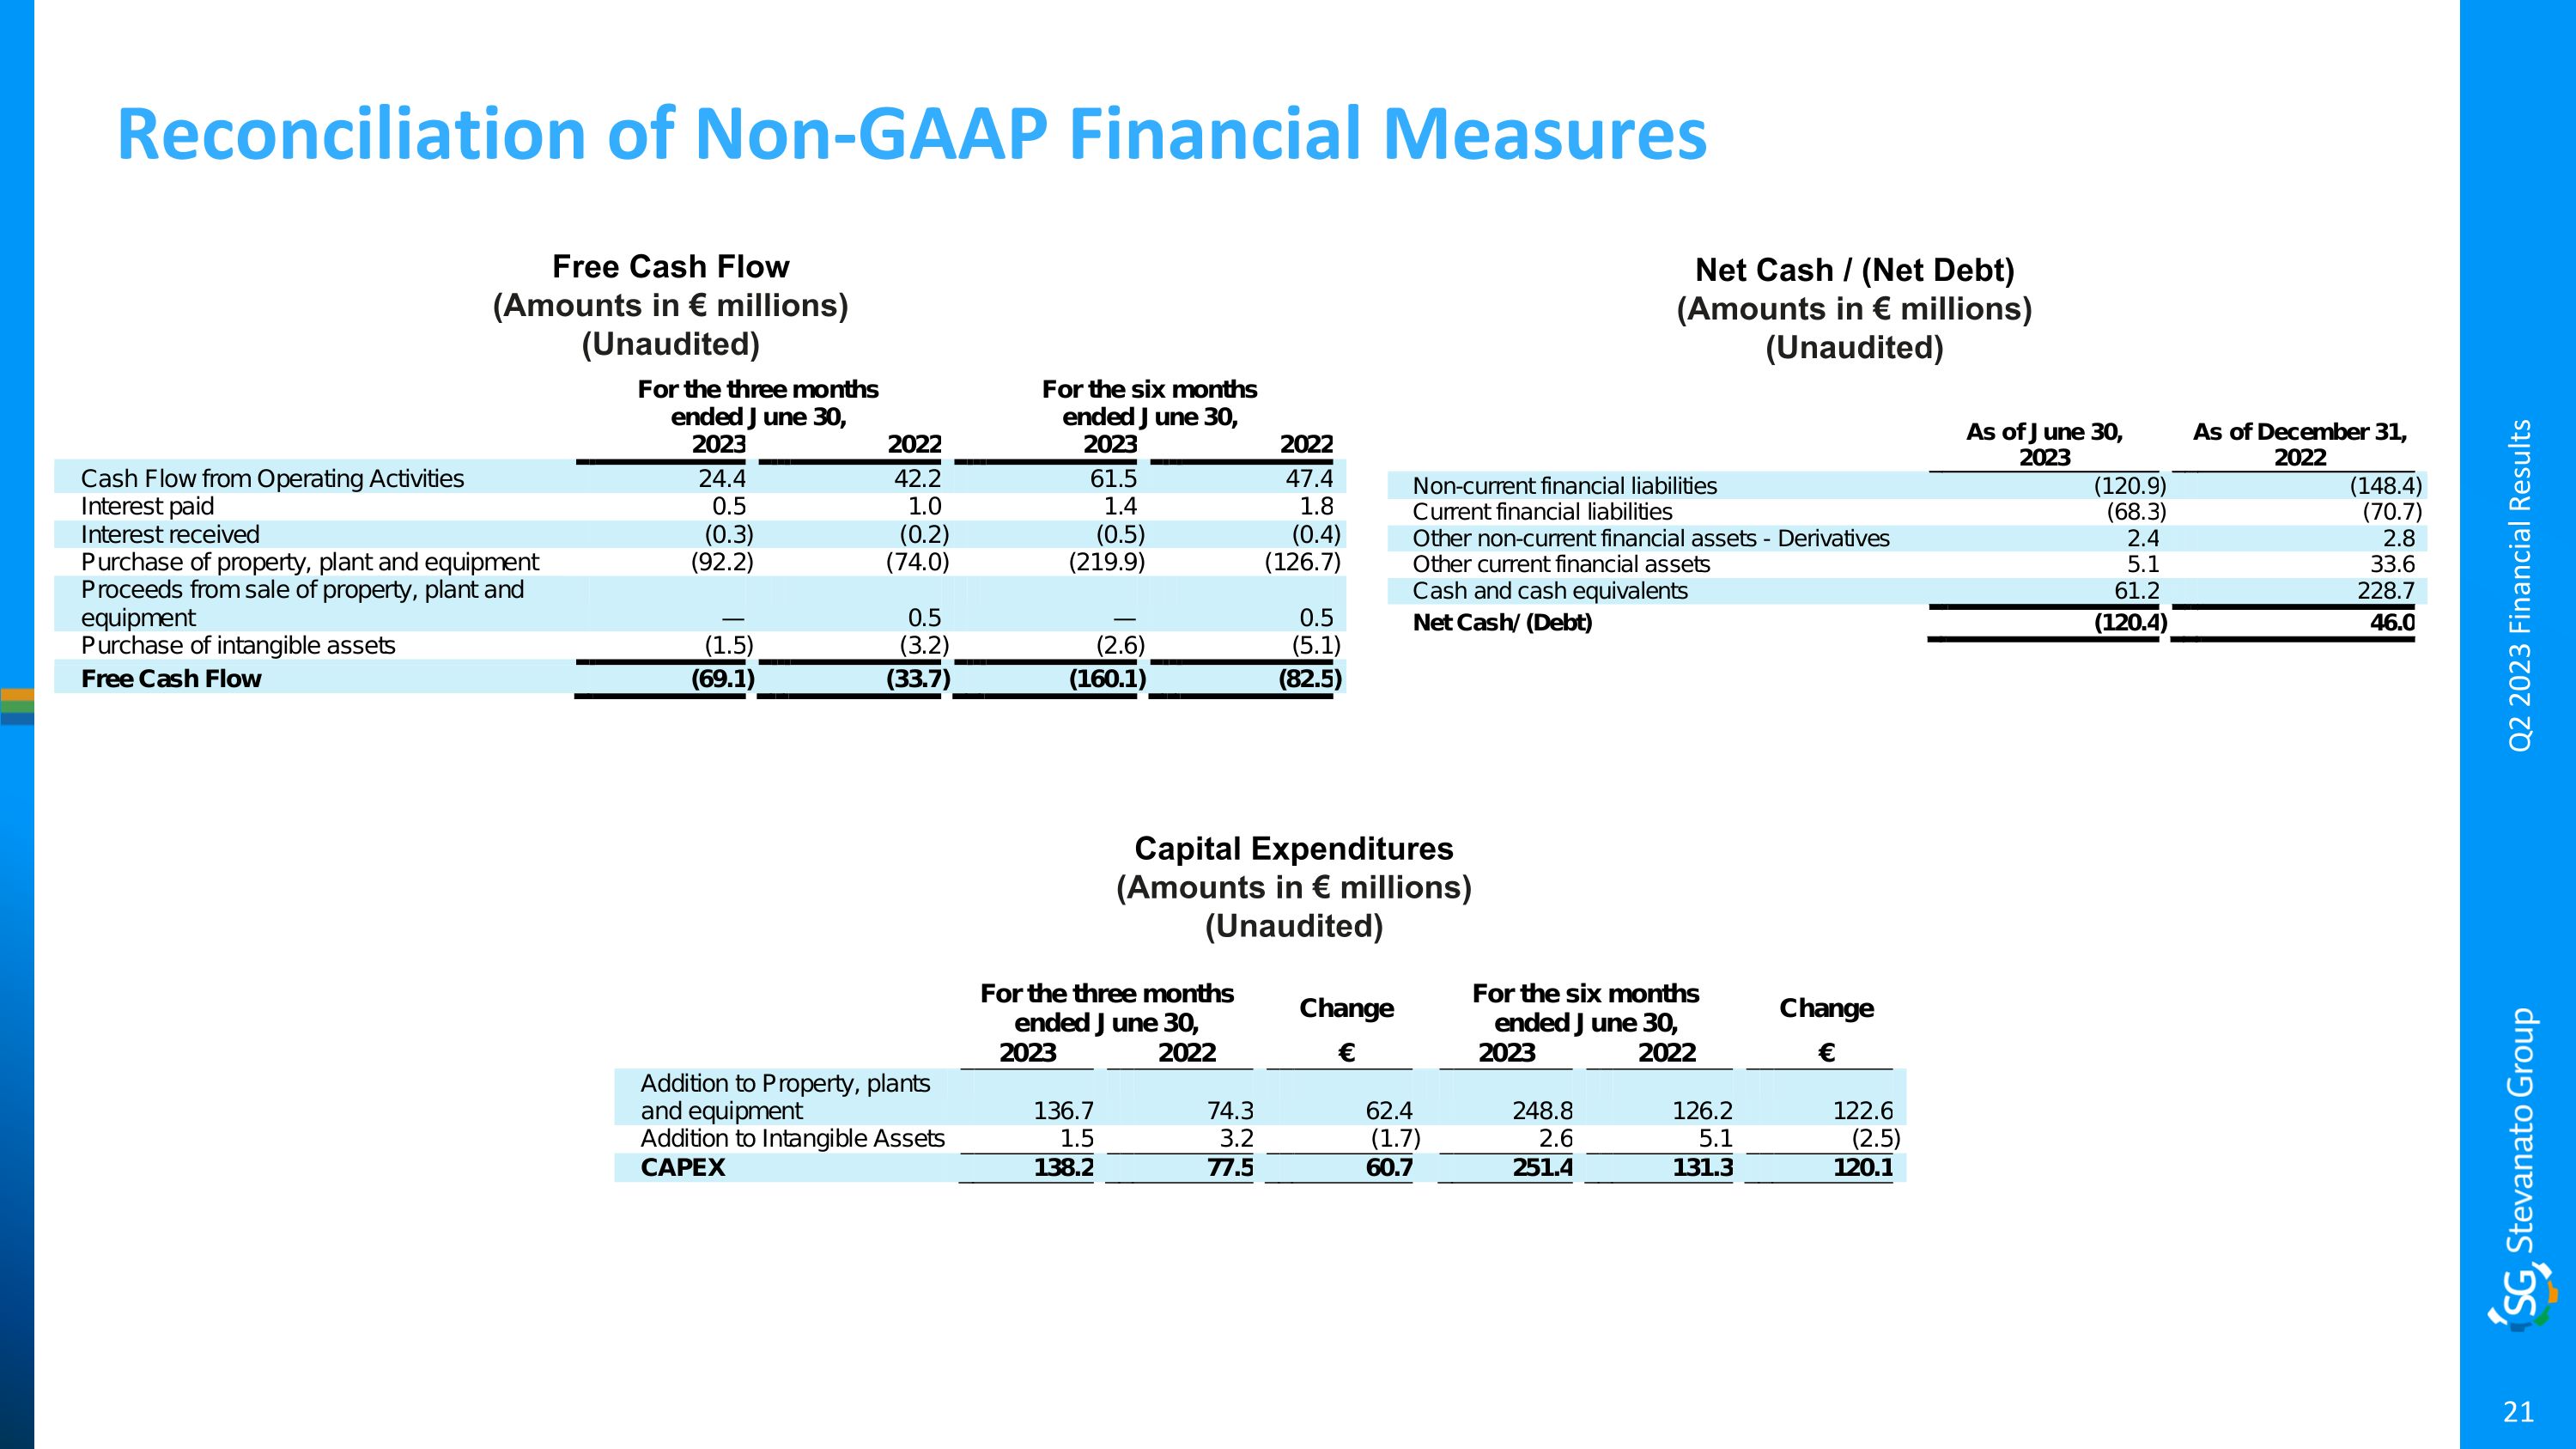
Reconciliation of Non-GAAP Financial Measures Free Cash Flow (Amounts in € millions) (Unaudited) Q2 2023 Financial Results Net Cash / (Net Debt) (Amounts in € millions) (Unaudited) Capital Expenditures (Amounts in € millions) (Unaudited)
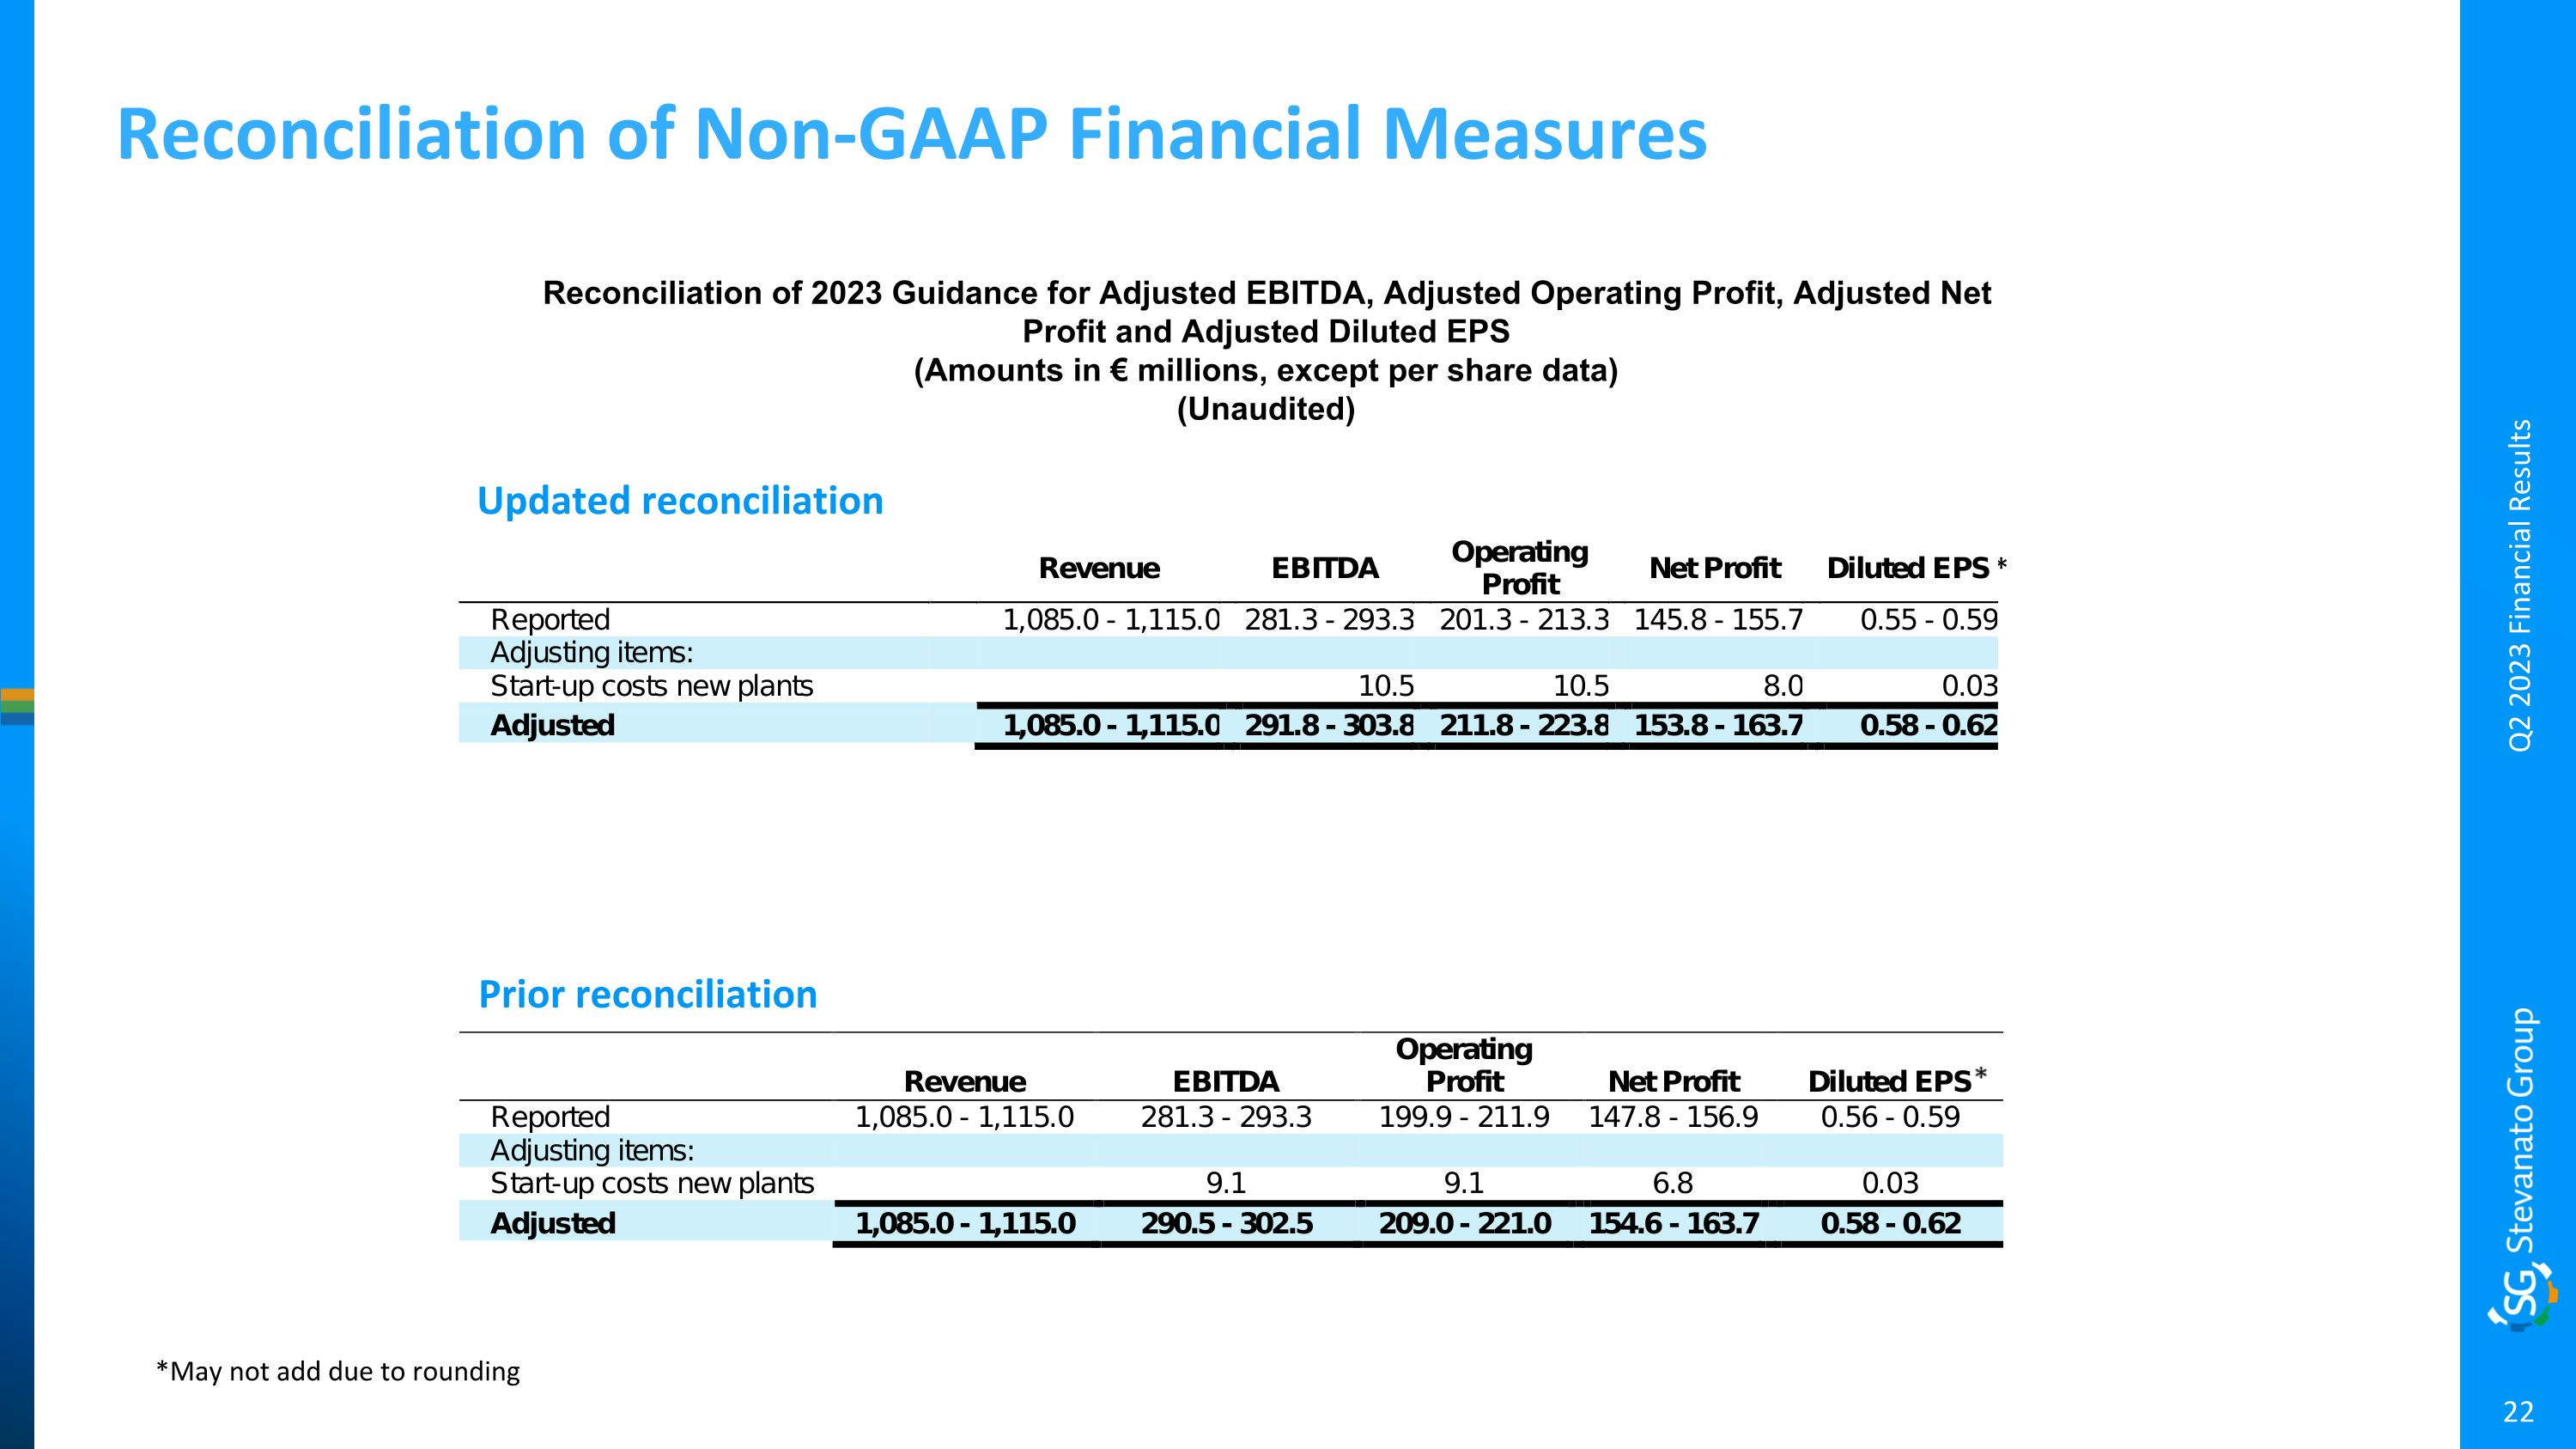
Reconciliation of Non-GAAP Financial Measures Reconciliation of 2023 Guidance for Adjusted EBITDA, Adjusted Operating Profit, Adjusted Net Profit and Adjusted Diluted EPS (Amounts in € millions, except per share data) (Unaudited) Q2 2023 Financial Results *May not add due to rounding * Prior reconciliation Updated reconciliation