
Stevanato Group Q2 2025 Financial Results August 5, 2025 Exhibit 99.1
Q2 2025 Financial Results Safe Harbor Statement Forward-Looking Statements This presentation contains certain forward-looking statements within the meaning of the Private Securities Litigation Reform Act of 1995 that reflect the current views of Stevanato Group S.p.A. (“we”, “our”, “us”, “Stevanato Group” or the “Company”) and which involve known and unknown risks, uncertainties and assumptions because they relate to events and depend on circumstances that will occur in the future whether or not within the control of the Company. These forward-looking statements include, or may include words such as "is fueling," "growing," "rising," "are seeing," "believe," "will," "continue," "continued," "expected," "assumes," "sustained," "rise," "continuing," "remain," and other similar terminology. Forward-looking statements contained in this presentation include, but are not limited to, statements about: our future financial performance, including our revenue, operating expenses and our ability to maintain profitability and operational and commercial capabilities; our expectations regarding the development of our industry and the competitive environment in which we operate; the expansion of our plants and sites, and our expectations related to our capacity expansion; the global supply chain and our committed orders; customer demand; the success of the Company's initiatives to optimize the industrial footprint, harmonize processes and enhance supply chain and logistics strategies; our geographical and industrial footprint; and our goals, strategies, and investment plans. These statements are neither promises nor guarantees but involve known and unknown risks, uncertainties and other important factors and circumstances that may cause Stevanato Group’s actual results, performance or achievements to be materially different from its expectations expressed or implied by the forward-looking statements, including conditions of the U.S. capital markets, negative global economic conditions, inflation, the impact of the conflict between Russia and Ukraine, the evolving events in Israel and Gaza, supply chain and logistical challenges and other negative developments affecting Stevanato Group’s business or unfavorable legislative or regulatory developments. The following are some of the factors that could cause our actual results to differ materially from those expressed in or underlying our forward-looking statements: (i) our product offerings are highly complex, and, if our products do not satisfy applicable quality criteria, specifications and performance standards, we could experience lost sales, delayed or reduced market acceptance of our products, increased costs and damage to our reputation; (ii) we must develop new products and enhance existing products, adapt to significant technological and innovative changes and respond to introductions of new products by competitors to remain competitive; (iii) if we fail to maintain and enhance our brand and reputation, our business, results of operations and prospects may be materially and adversely affected; (iv) we are highly dependent on our management and employees. Competition for our employees is intense, and we may not be able to attract and retain the highly skilled employees that we need to support our business and our intended future growth; (v) our business, financial condition and results of operations depend upon maintaining our relationships with suppliers and service providers; (vi) our business, financial condition and results of operations depend upon the availability and price of high-quality materials and energy supply and our ability to contain production costs; (vii) significant interruptions in our operations could harm our business, financial condition and results of operations; (viii) as a consequence of the COVID-19 pandemic, sales of vials to and for vaccination programs globally increased resulting in a revenue growth acceleration. The demand for such products may shrink, as the need for COVID-19 related solutions continue to decline; (ix) our manufacturing facilities are subject to operating hazards which may lead to production curtailments or shutdowns and have an adverse effect on our business, results of operations, financial condition or cash flows; (x) our business, financial condition and results of operations may be impacted by our ability to successfully expand capacity to meet customer demand ; (xi) the loss of a significant number of customers or a reduction in orders from a significant number of customers, including through destocking initiatives or lack of transparency of our products held by customers, could reduce our sales and harm our financial performance; (xii) we may face significant competition in implementing our strategies for revenue growth in light of actions taken by our competitors; (xiii) our global operations are subject to international market risks that may have a material effect on our liquidity, financial condition, results of operations and cash flows; (xiv) we are required to comply with a wide variety of laws and regulations and are subject to regulation by various federal, state and foreign agencies; (xv) given the relevance of our activities in the healthcare sector, investments by non-Italian entities in the Company, as well as certain asset disposals by the Company, may be subject to the prior authorization of the Italian Government (so called “golden powers”); (xvi) if relations between China and the U.S. deteriorate (including in connection with the current trade policy of the U.S. government), our business in the U.S. and China could be materially and adversely affected; (xvii) the U.S. government recently imposed tariffs on certain product manufactured in several jurisdictions, including China and the European Union, and has made announcements regarding the potential imposition of tariffs on other jurisdictions. Such tariffs as well as other trade policies that the U.S. government may implement in the future and the restrictive trade measures that other countries may adopt in response thereto, could adversely affect our business by making it more difficult or costly to trade goods between different jurisdictions; (xviii) cyber security risks and the failure to maintain the confidentiality, integrity and availability of our computer hardware, software and internet applications and related tools and functions, could result in damage to our reputation, data integrity and/or subject us to costs, fines or lawsuits under data privacy or other laws or contractual requirements; (xix) our trade secrets may be misappropriated or disclosed, and confidentiality agreements with directors, employees and third parties may not adequately prevent disclosure of trade secrets and protect other proprietary information; (xx) if we are unable to obtain and maintain patent protection for our technology, products and potential products, or if the scope of the patent protection obtained is not sufficiently broad, we may not be able to compete effectively in our markets; (xxi) we depend in part on proprietary technology licensed from others, and if we lose our existing licenses or are unable to acquire or license additional proprietary rights from third parties, we may not be able to continue developing our potential products; and (xxii) we are obligated to maintain proper and effective internal control over financial reporting. Our internal controls were not effective for the year ended December 31, 2024, and in the future may not be determined to be effective, which may adversely affect investor confidence in us and, as a result, the value of our ordinary shares; and any other risk described under the headings “Risk Factors,” “Operating and Financial Review and Prospects” and “Business” in our most recent Annual Report on Form 20-F filed with the U.S. Securities and Exchange Commission. This list is not exhaustive. We therefore caution you against relying on these forward-looking statements and we qualify all of our forward-looking statements by these cautionary statements. These forward-looking statements speak only as at their dates. The Company undertakes no obligation to update any forward-looking statement or statements to reflect events or circumstances after the date on which such statement is made or to reflect the occurrence of unanticipated events. New factors emerge from time to time, and it is not possible to predict all of these factors. Further, the Company cannot assess the impact of each such factor on our business or the extent to which any factor, or combination of factors, may cause actual results to be materially different from those contained in any forward-looking statements. For a description of certain additional factors that could cause the Company’s future results to differ from those expressed in any such forward-looking statements, refer to the risk factors discussed in our most recent Annual Report on Form 20-F filed with the U.S. Securities and Exchange Commission. Non-GAAP Financial Information This presentation contains non-GAAP financial measures. Please refer to the tables included in this presentation for a reconciliation of non-GAAP financial measures. Management monitors and evaluates its operating and financial performance using several non-GAAP financial measures, including Constant Currency Revenue, EBITDA, Adjusted EBITDA, Adjusted EBITDA Margin, Adjusted Operating Profit, Adjusted Operating Profit Margin, Adjusted Income Taxes, Adjusted Net Profit, Adjusted Diluted EPS, Capital Employed, Net Cash, Free Cash Flow and CAPEX. The Company believes that these non-GAAP financial measures provide useful and relevant information regarding its performance and improve its ability to assess its financial condition. While similar measures are widely used in the industry in which the Company operates, the financial measures it uses may not be comparable to other similarly titled measures used by other companies, nor are they intended to be substitutes for measures of financial performance or financial position as prepared in accordance with IFRS. Accordingly, you should not place undue reliance on any non-IFRS financial measures contained in this presentation.
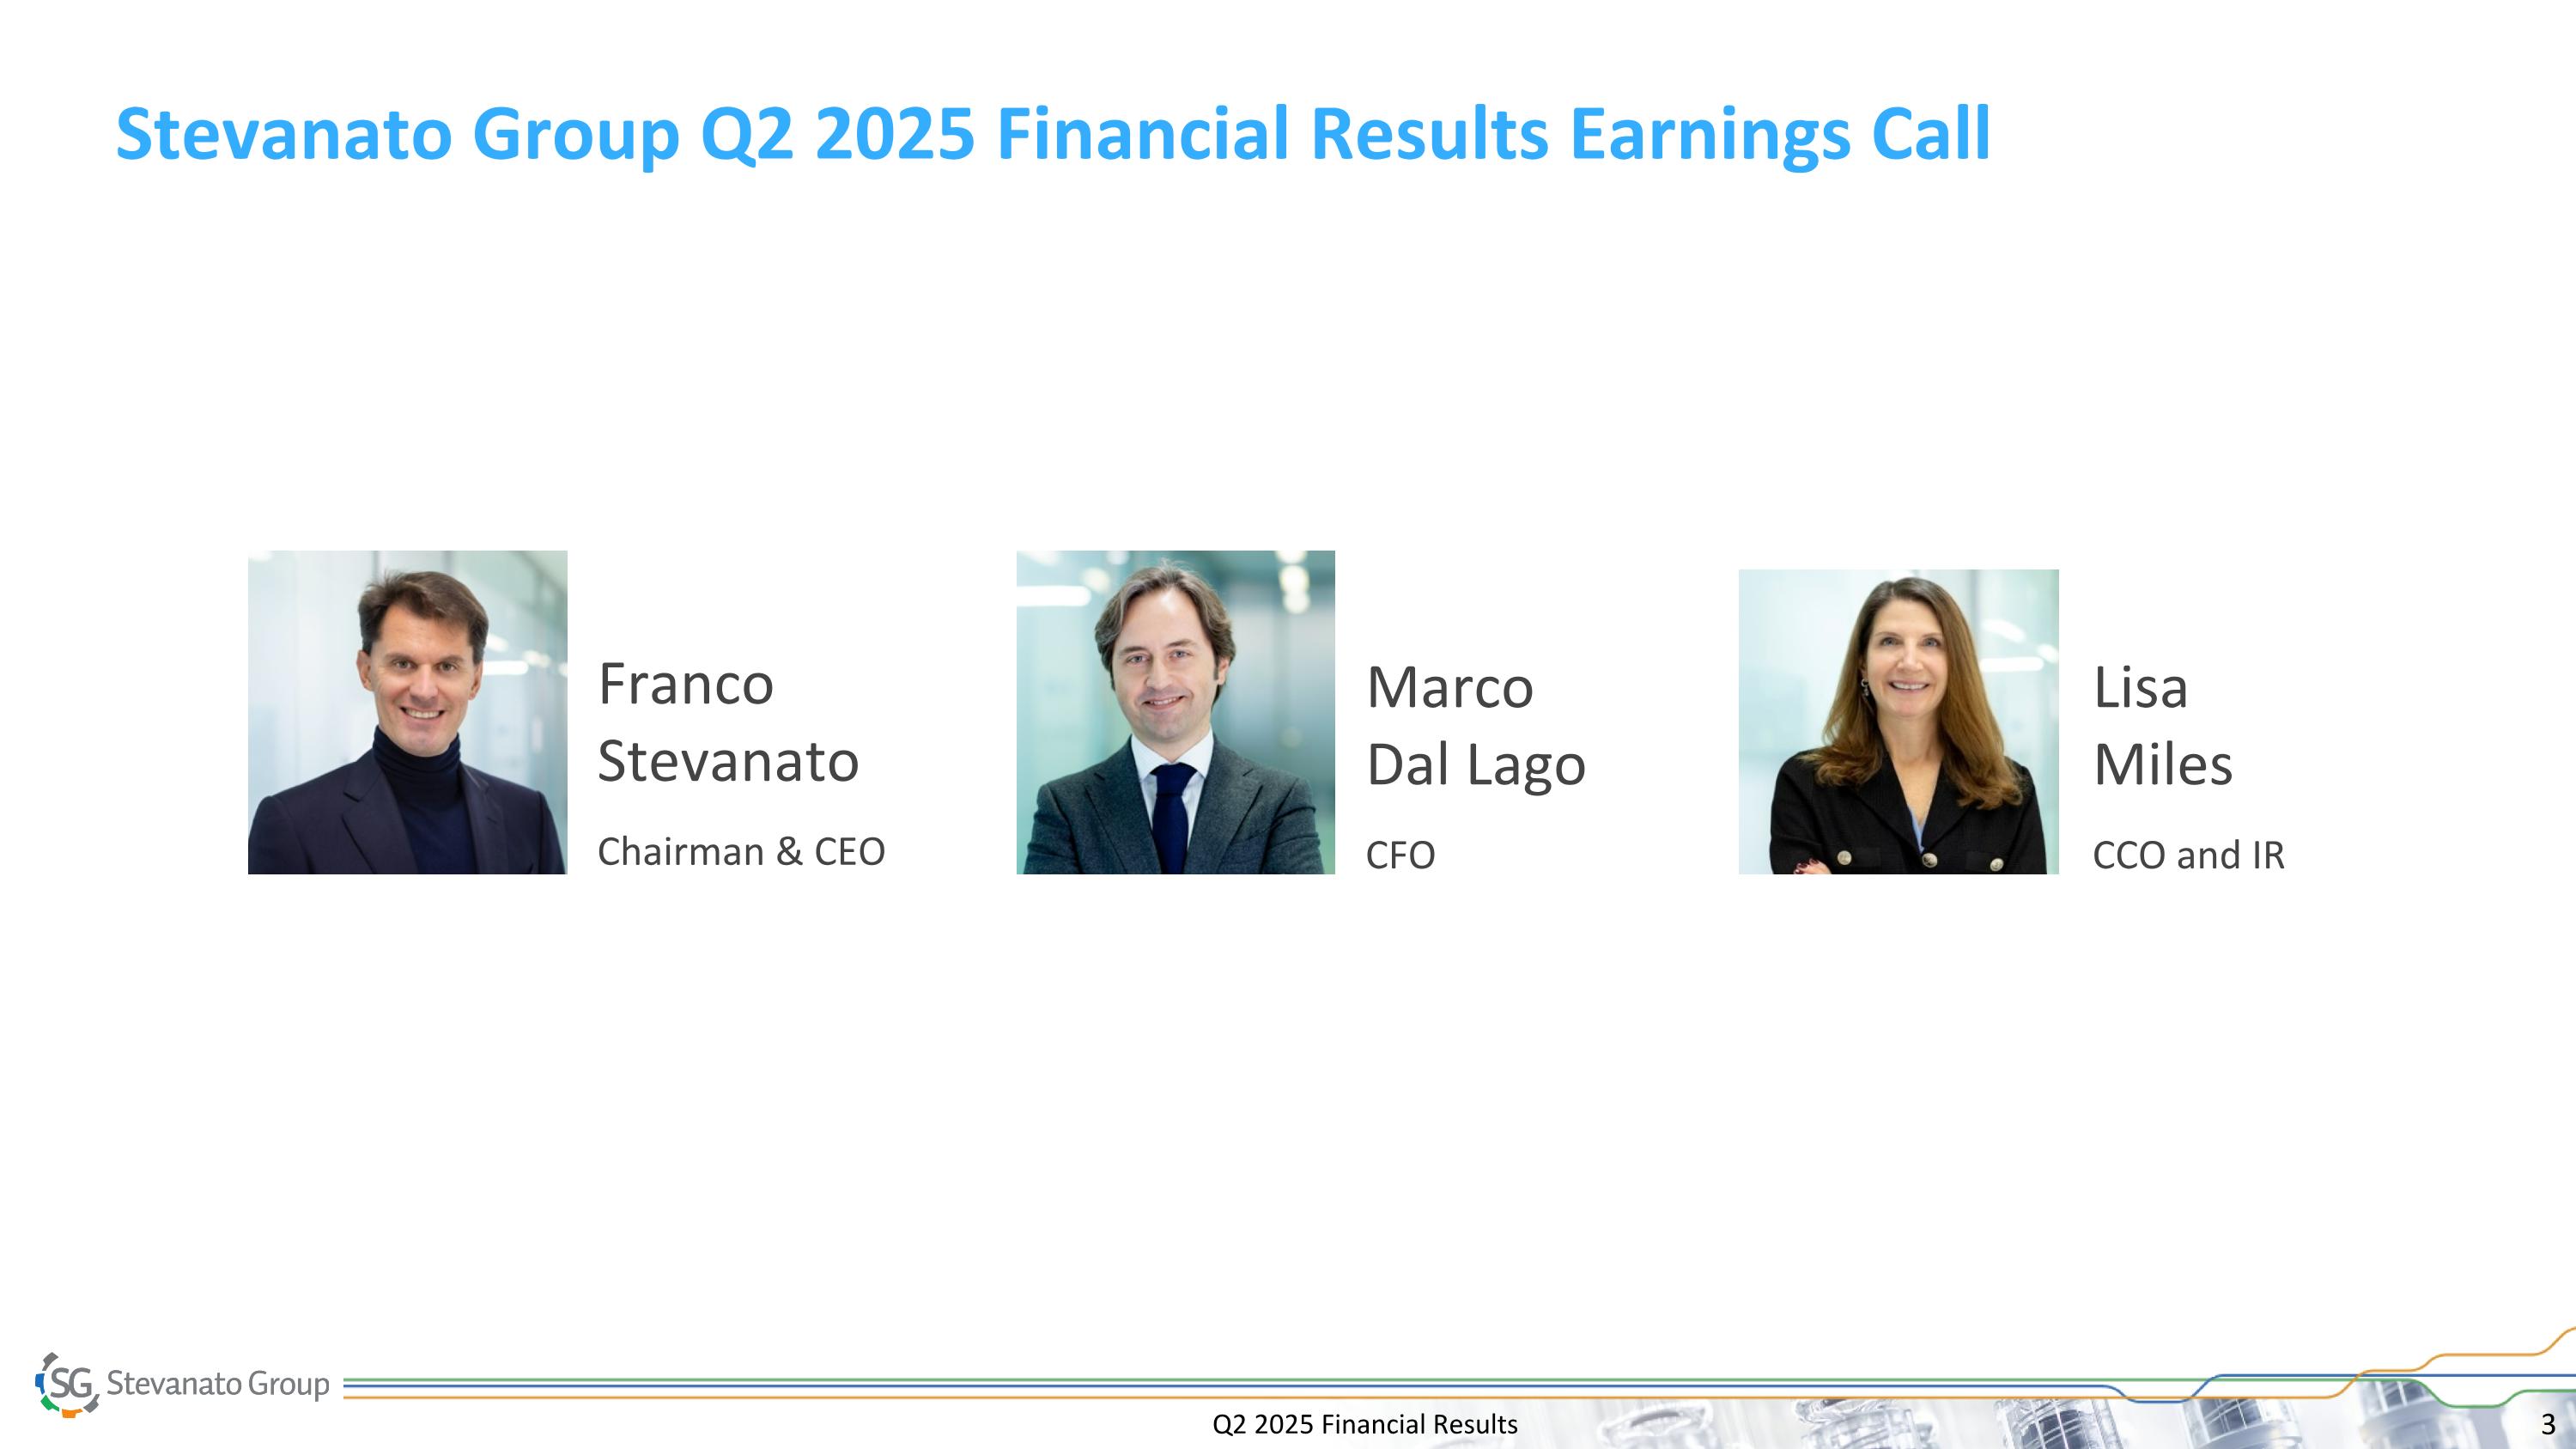
Q2 2025 Financial Results Stevanato Group Q2 2025 Financial Results Earnings Call Franco Stevanato Chairman & CEO Marco Dal Lago CFO Lisa Miles CCO and IR
Franco Stevanato Chairman & Chief Executive Officer Q2 2025 Financial Results
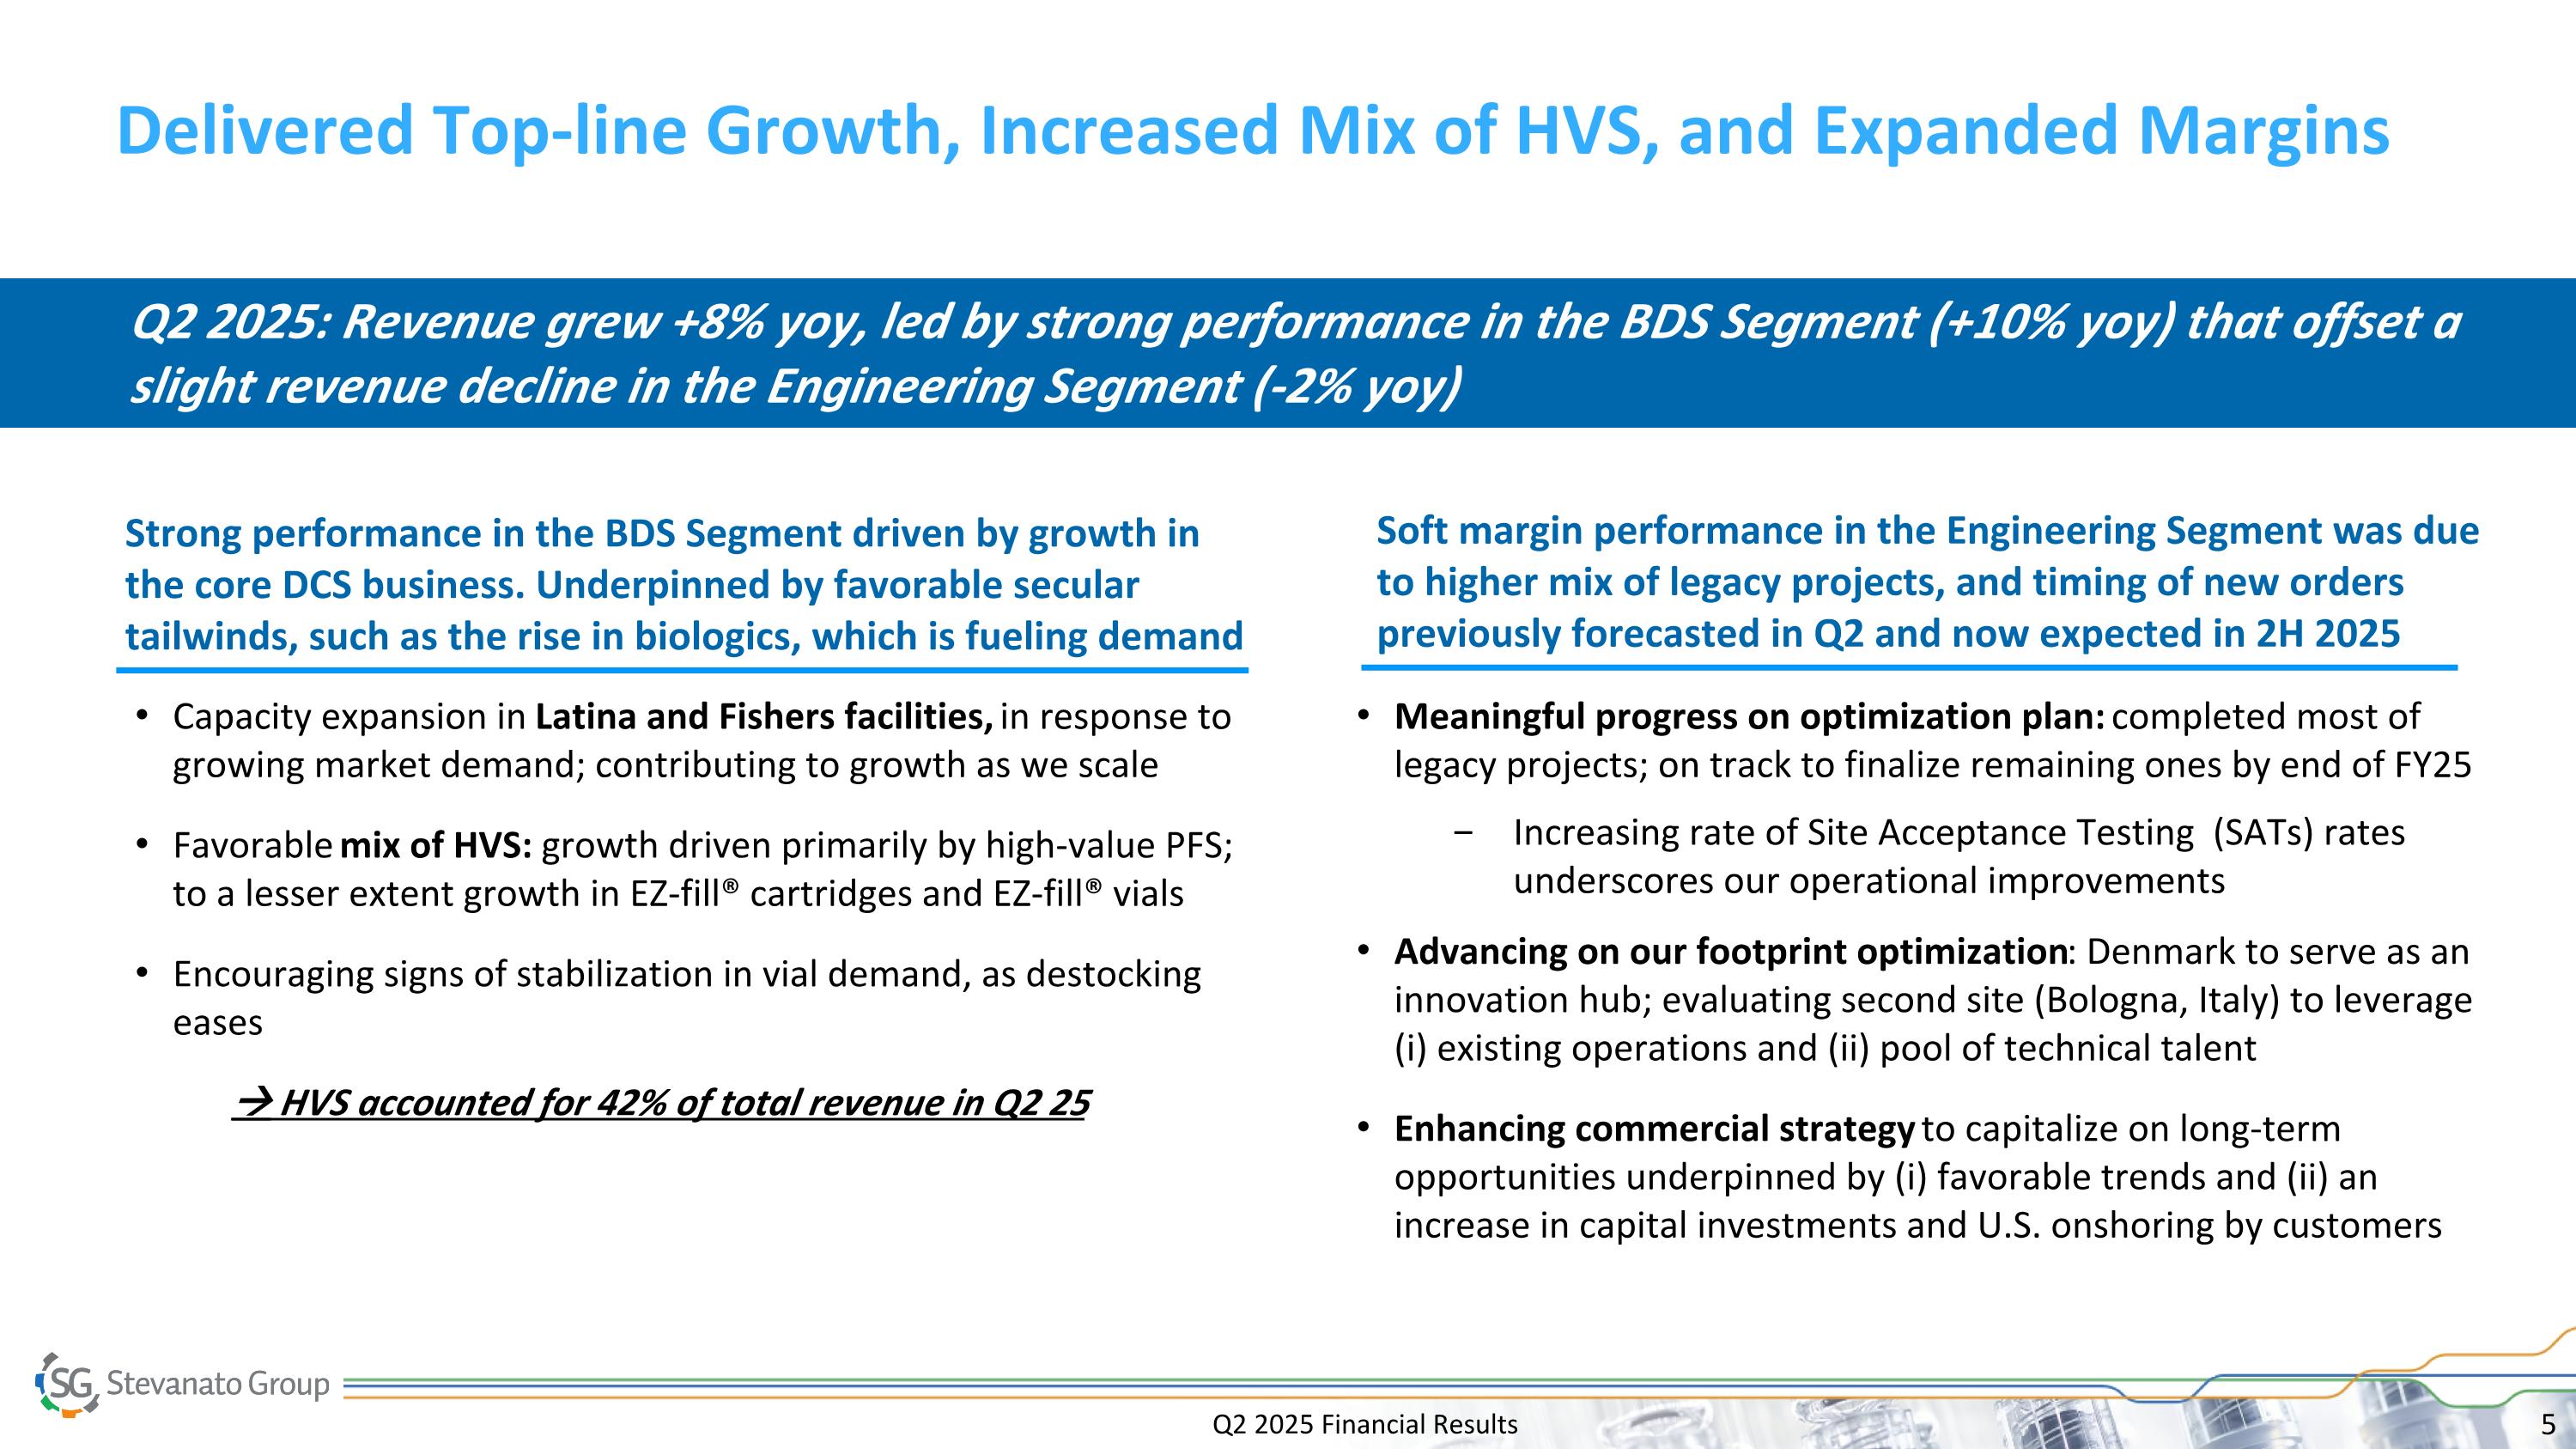
Q2 2025 Financial Results Delivered Top-line Growth, Increased Mix of HVS, and Expanded Margins Strong performance in the BDS Segment driven by growth in the core DCS business. Underpinned by favorable secular tailwinds, such as the rise in biologics, which is fueling demand Capacity expansion in Latina and Fishers facilities, in response to growing market demand; contributing to growth as we scale Favorable mix of HVS: growth driven primarily by high-value PFS; to a lesser extent growth in EZ-fill® cartridges and EZ-fill® vials Encouraging signs of stabilization in vial demand, as destocking eases HVS accounted for 42% of total revenue in Q2 25 Meaningful progress on optimization plan: completed most of legacy projects; on track to finalize remaining ones by end of FY25 Increasing rate of Site Acceptance Testing (SATs) rates underscores our operational improvements Advancing on our footprint optimization: Denmark to serve as an innovation hub; evaluating second site (Bologna, Italy) to leverage (i) existing operations and (ii) pool of technical talent Enhancing commercial strategy to capitalize on long-term opportunities underpinned by (i) favorable trends and (ii) an increase in capital investments and U.S. onshoring by customers Soft margin performance in the Engineering Segment was due to higher mix of legacy projects, and timing of new orders previously forecasted in Q2 and now expected in 2H 2025 Q2 2025: Revenue grew +8% yoy, led by strong performance in the BDS Segment (+10% yoy) that offset a slight revenue decline in the Engineering Segment (-2% yoy)
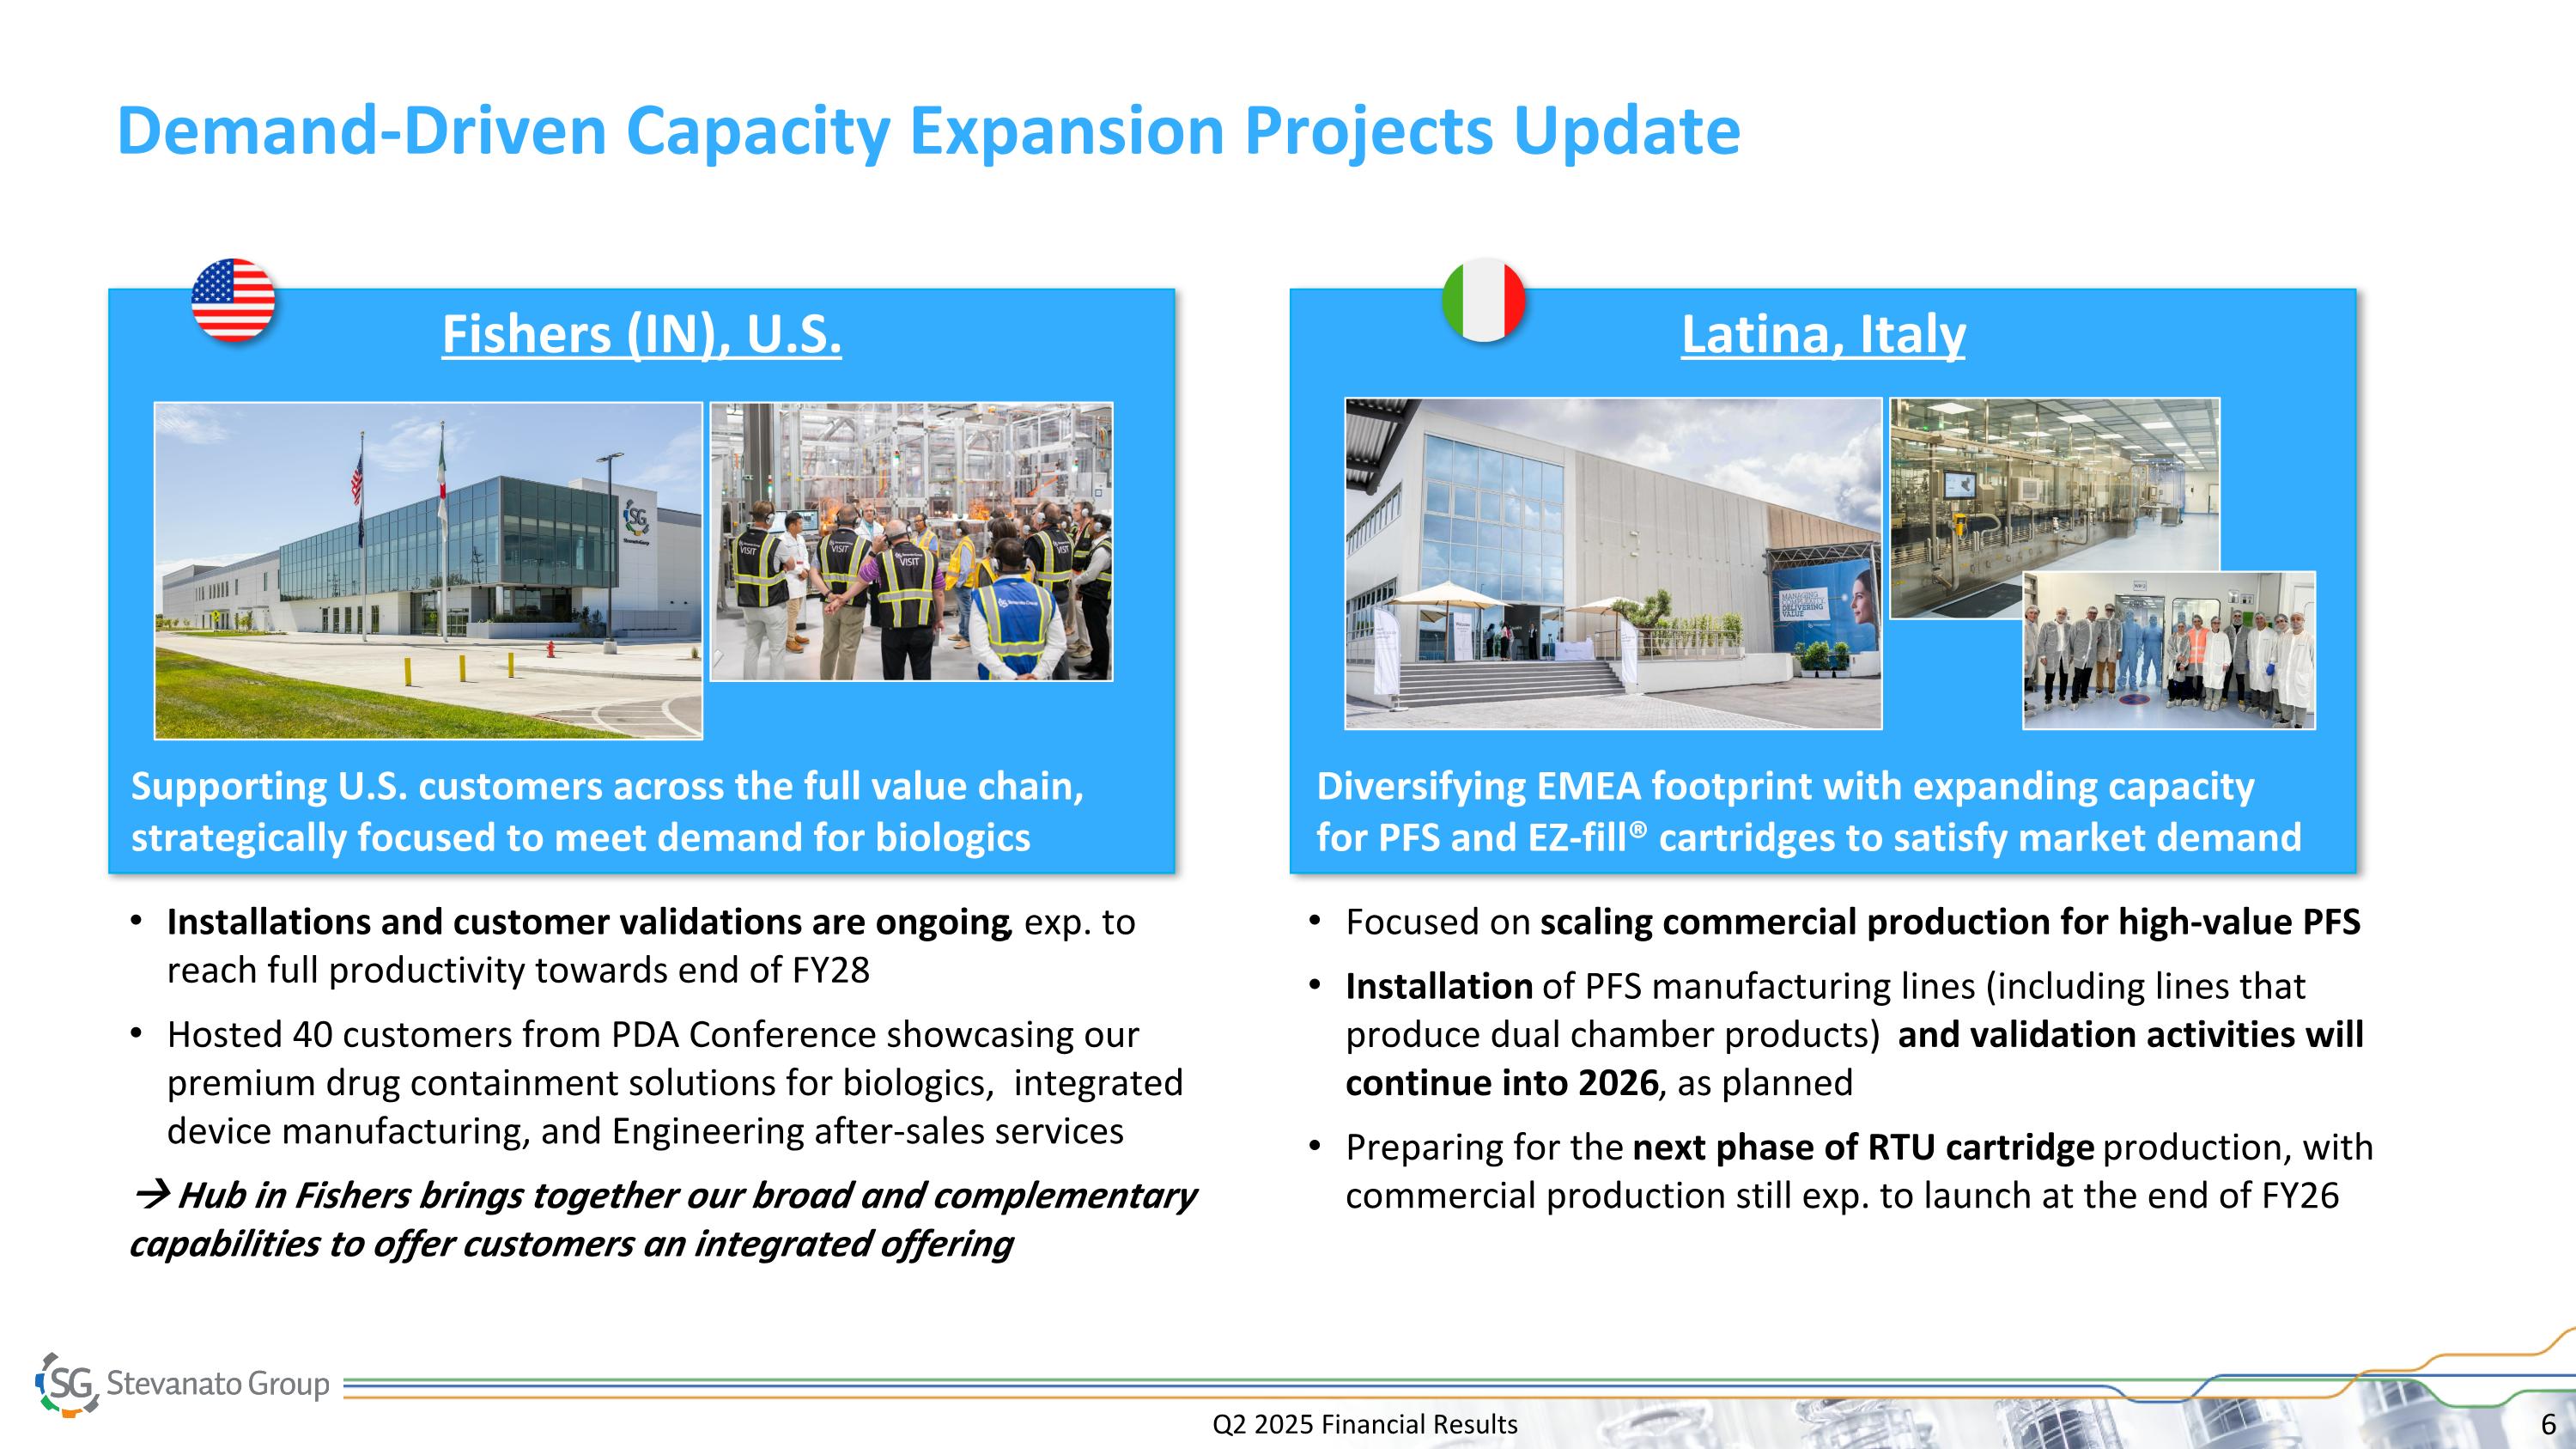
Q2 2025 Financial Results Latina, Italy Focused on scaling commercial production for high-value PFS Installation of PFS manufacturing lines (including lines that produce dual chamber products) and validation activities will continue into 2026, as planned Preparing for the next phase of RTU cartridge production, with commercial production still exp. to launch at the end of FY26 Fishers (IN), U.S. Installations and customer validations are ongoing, exp. to reach full productivity towards end of FY28 Hosted 40 customers from PDA Conference showcasing our premium drug containment solutions for biologics, integrated device manufacturing, and Engineering after-sales services Hub in Fishers brings together our broad and complementary capabilities to offer customers an integrated offering Supporting U.S. customers across the full value chain, strategically focused to meet demand for biologics Diversifying EMEA footprint with expanding capacity for PFS and EZ-fill® cartridges to satisfy market demand Demand-Driven Capacity Expansion Projects Update
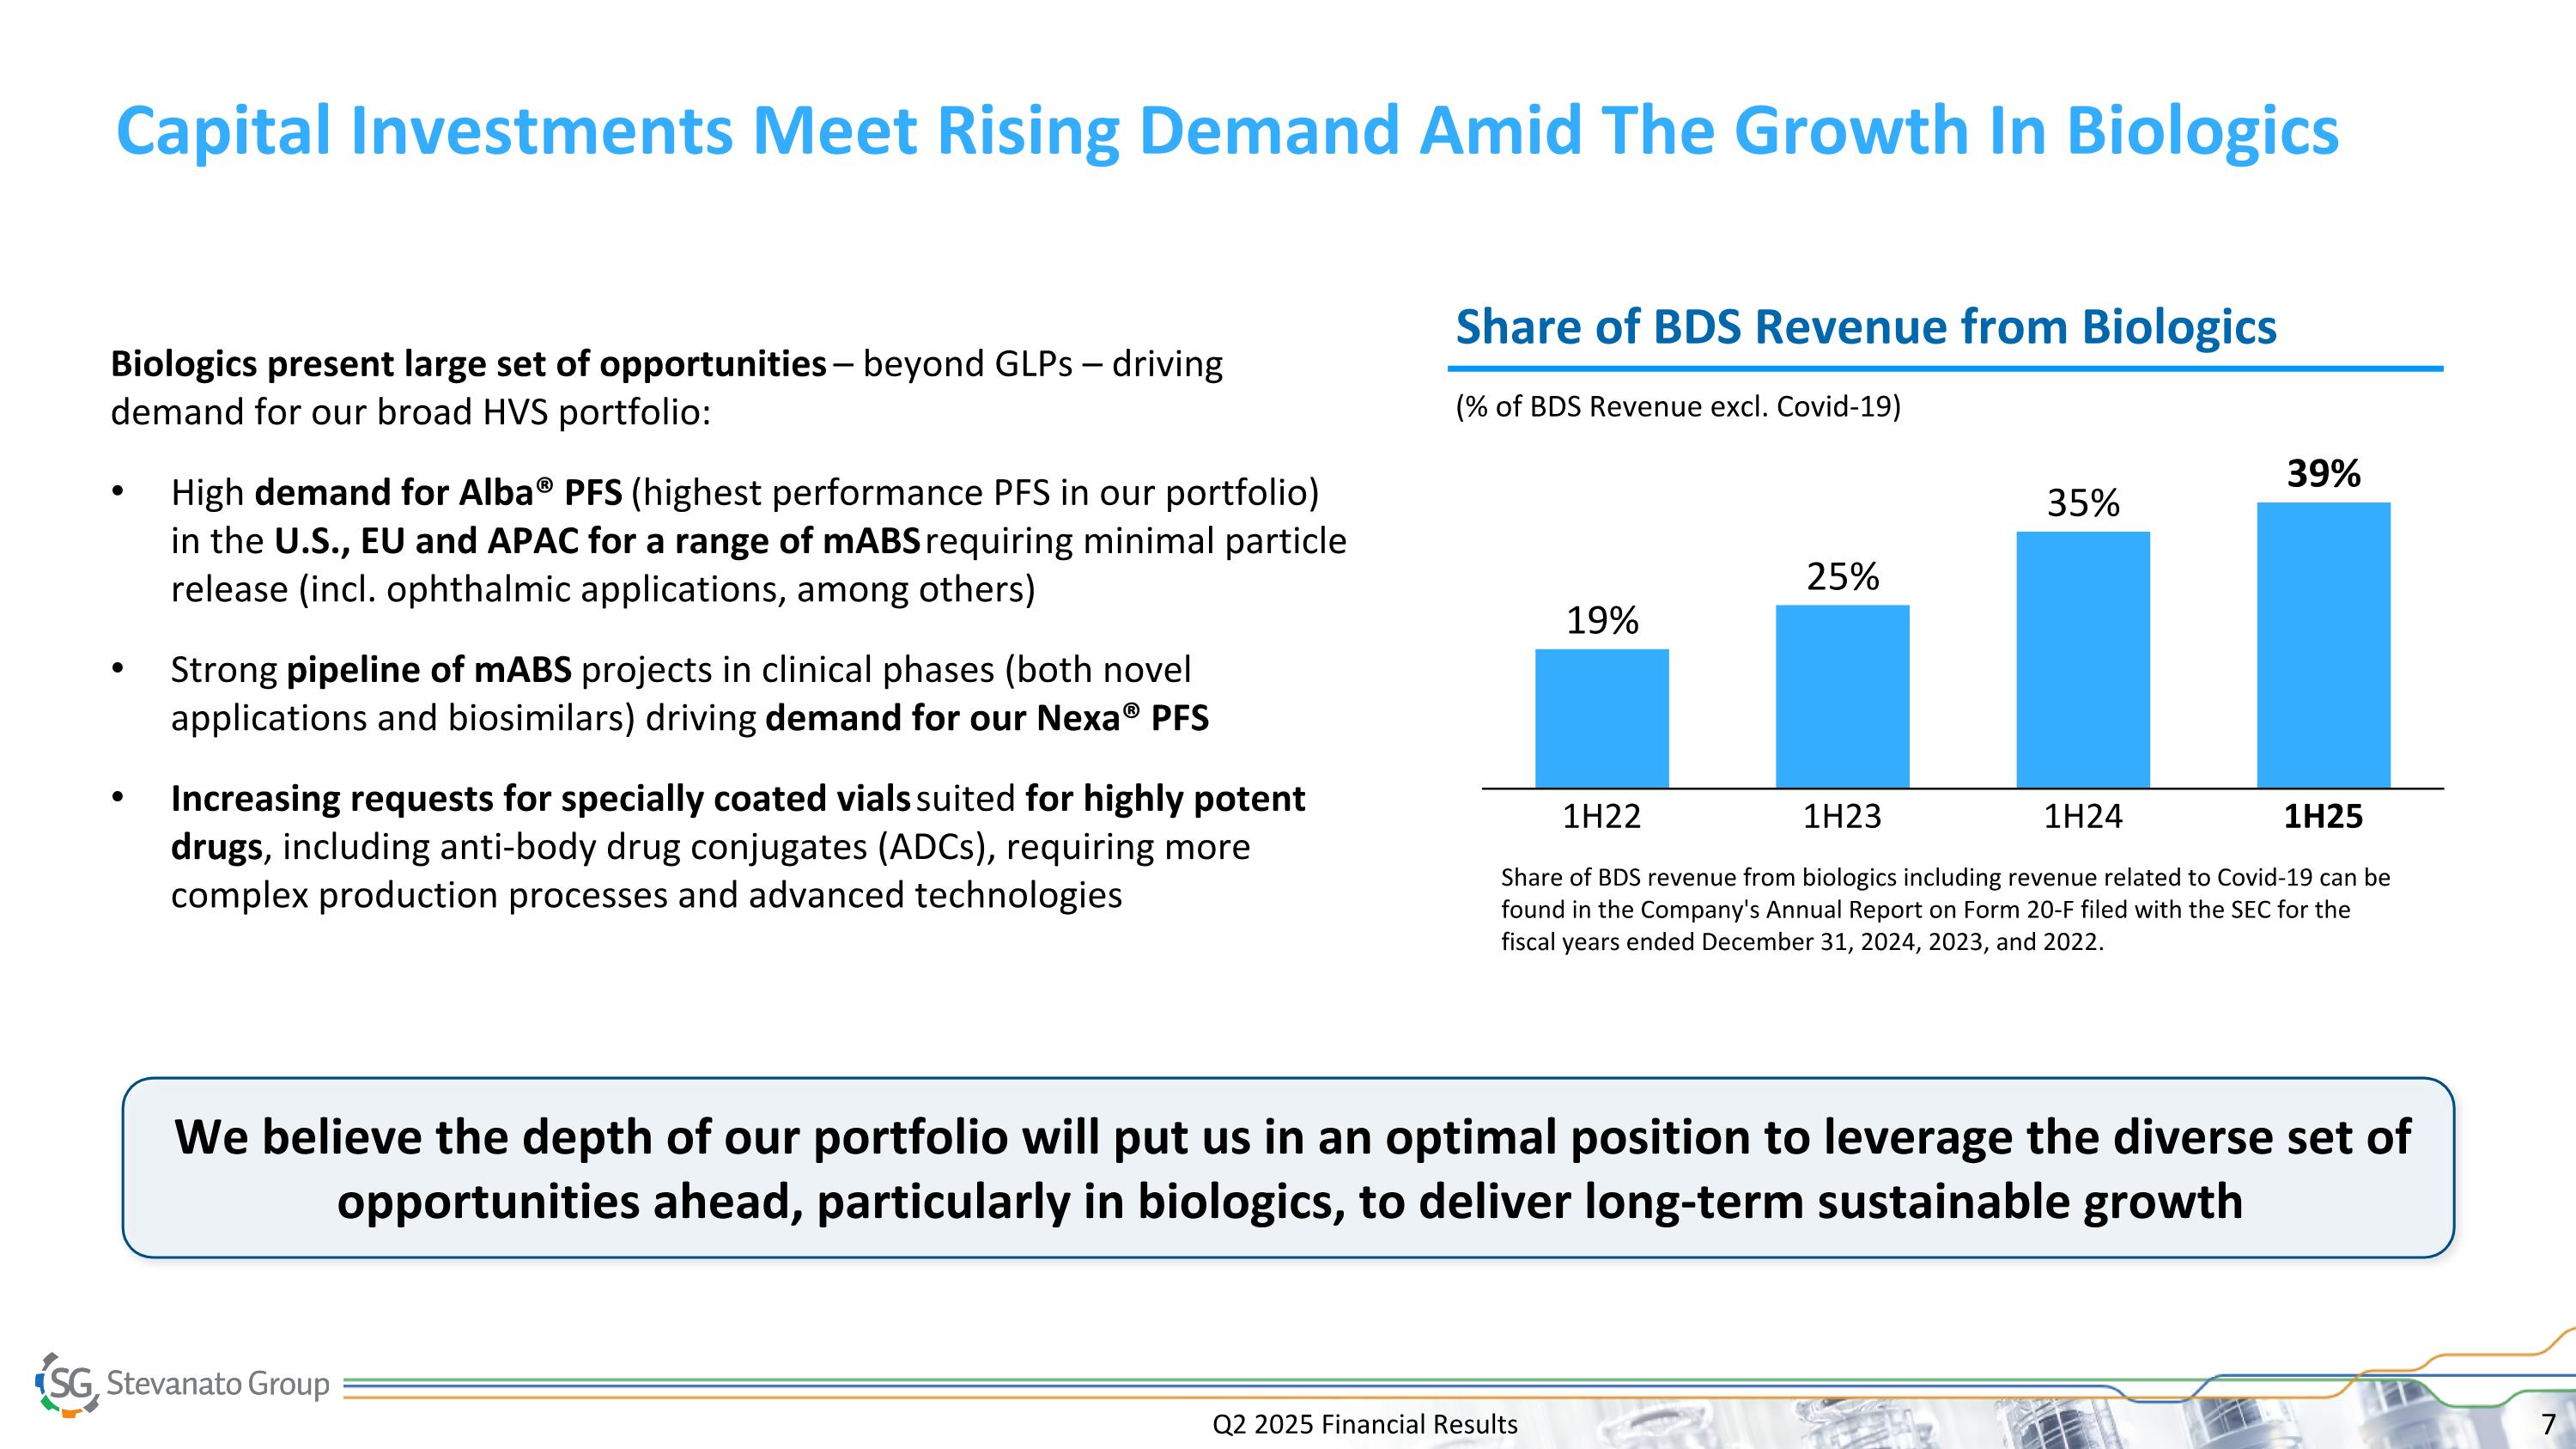
Q2 2025 Financial Results Capital Investments Meet Rising Demand Amid The Growth In Biologics (% of BDS Revenue excl. Covid-19) Share of BDS Revenue from Biologics 1H22 1H23 1H24 1H25 Share of BDS revenue from biologics including revenue related to Covid-19 can be found in the Company's Annual Report on Form 20-F filed with the SEC for the fiscal years ended December 31, 2024, 2023, and 2022. Biologics present large set of opportunities – beyond GLPs – driving demand for our broad HVS portfolio: High demand for Alba® PFS (highest performance PFS in our portfolio) in the U.S., EU and APAC for a range of mABS requiring minimal particle release (incl. ophthalmic applications, among others) Strong pipeline of mABS projects in clinical phases (both novel applications and biosimilars) driving demand for our Nexa® PFS Increasing requests for specially coated vials suited for highly potent drugs, including anti-body drug conjugates (ADCs), requiring more complex production processes and advanced technologies We believe the depth of our portfolio will put us in an optimal position to leverage the diverse set of opportunities ahead, particularly in biologics, to deliver long-term sustainable growth
Marco Dal Lago Chief Financial Officer Q2 2025 Financial Results
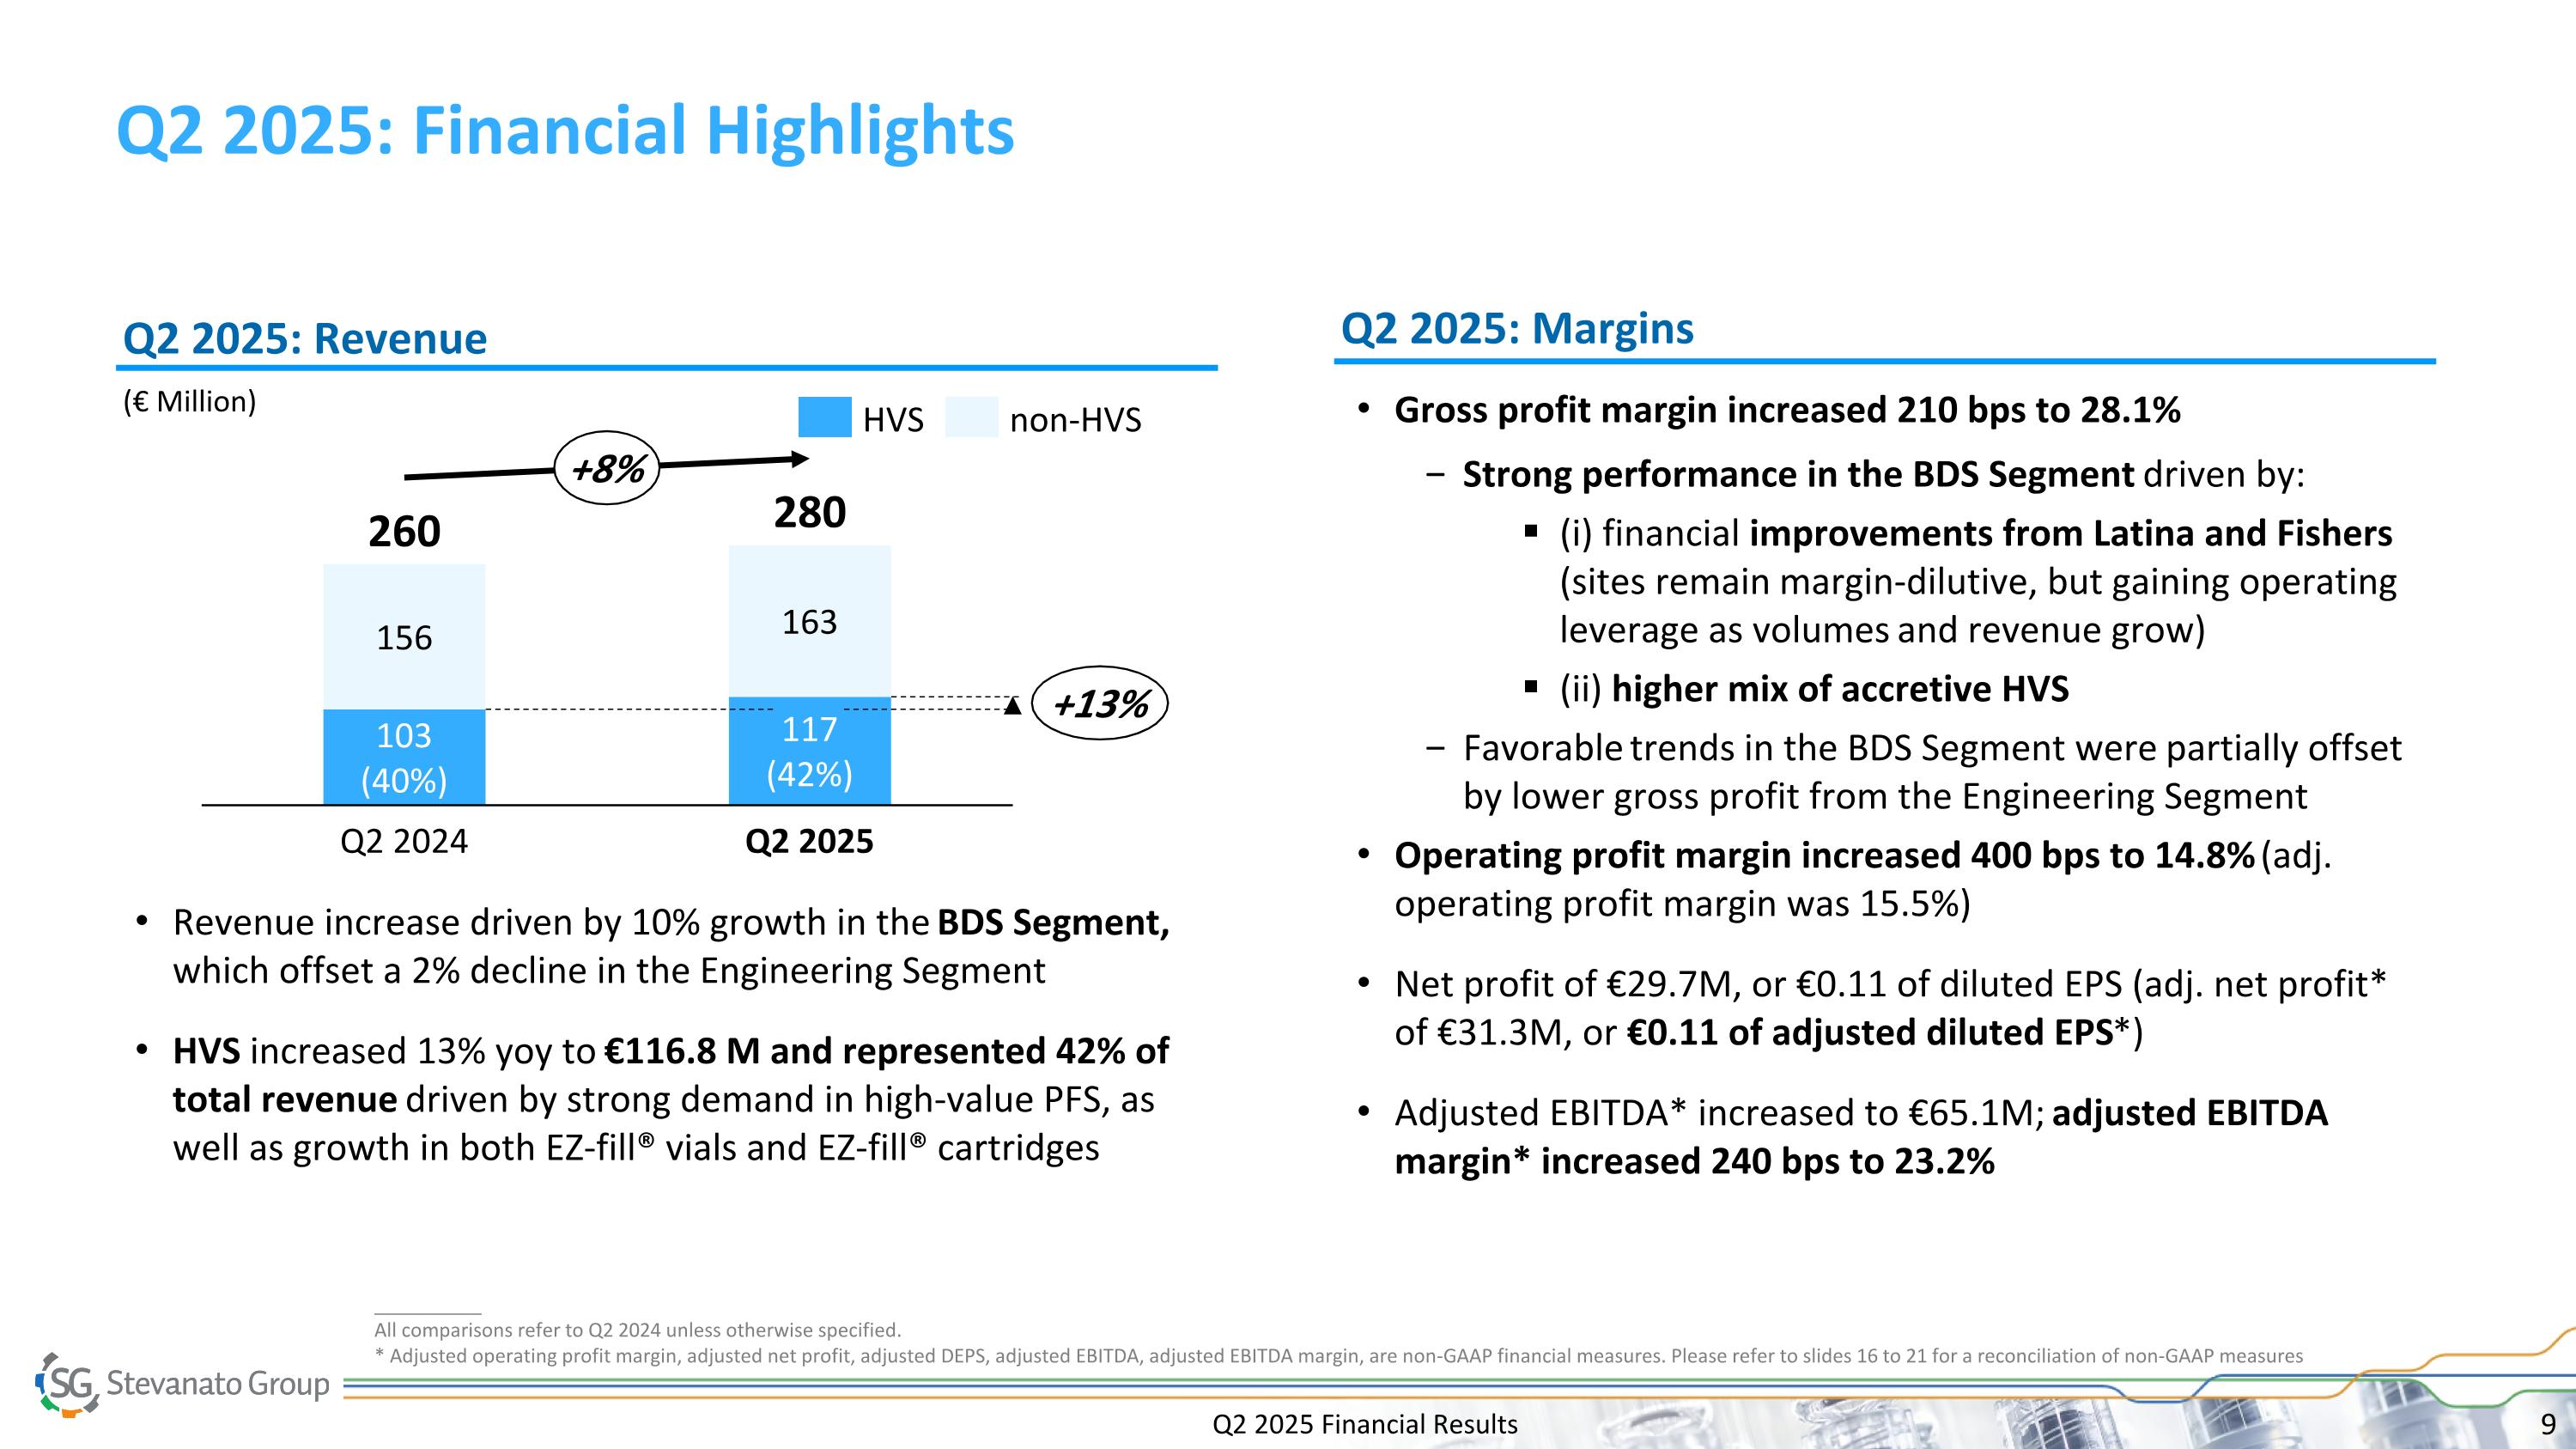
Q2 2025 Financial Results Q2 2025: Financial Highlights __________ All comparisons refer to Q2 2024 unless otherwise specified. * Adjusted operating profit margin, adjusted net profit, adjusted DEPS, adjusted EBITDA, adjusted EBITDA margin, are non-GAAP financial measures. Please refer to slides 16 to 21 for a reconciliation of non-GAAP measures (€ Million) Q2 2025: Revenue Q2 2025: Margins 156 103 (40%) Q2 2024 163 117 (42%) Q2 2025 260 280 +13% +8% HVS non-HVS Gross profit margin increased 210 bps to 28.1% Strong performance in the BDS Segment driven by: (i) financial improvements from Latina and Fishers (sites remain margin-dilutive, but gaining operating leverage as volumes and revenue grow) (ii) higher mix of accretive HVS Favorable trends in the BDS Segment were partially offset by lower gross profit from the Engineering Segment Operating profit margin increased 400 bps to 14.8% (adj. operating profit margin was 15.5%) Net profit of €29.7M, or €0.11 of diluted EPS (adj. net profit* of €31.3M, or €0.11 of adjusted diluted EPS*) Adjusted EBITDA* increased to €65.1M; adjusted EBITDA margin* increased 240 bps to 23.2% Revenue increase driven by 10% growth in the BDS Segment, which offset a 2% decline in the Engineering Segment HVS increased 13% yoy to €116.8 M and represented 42% of total revenue driven by strong demand in high-value PFS, as well as growth in both EZ-fill® vials and EZ-fill® cartridges
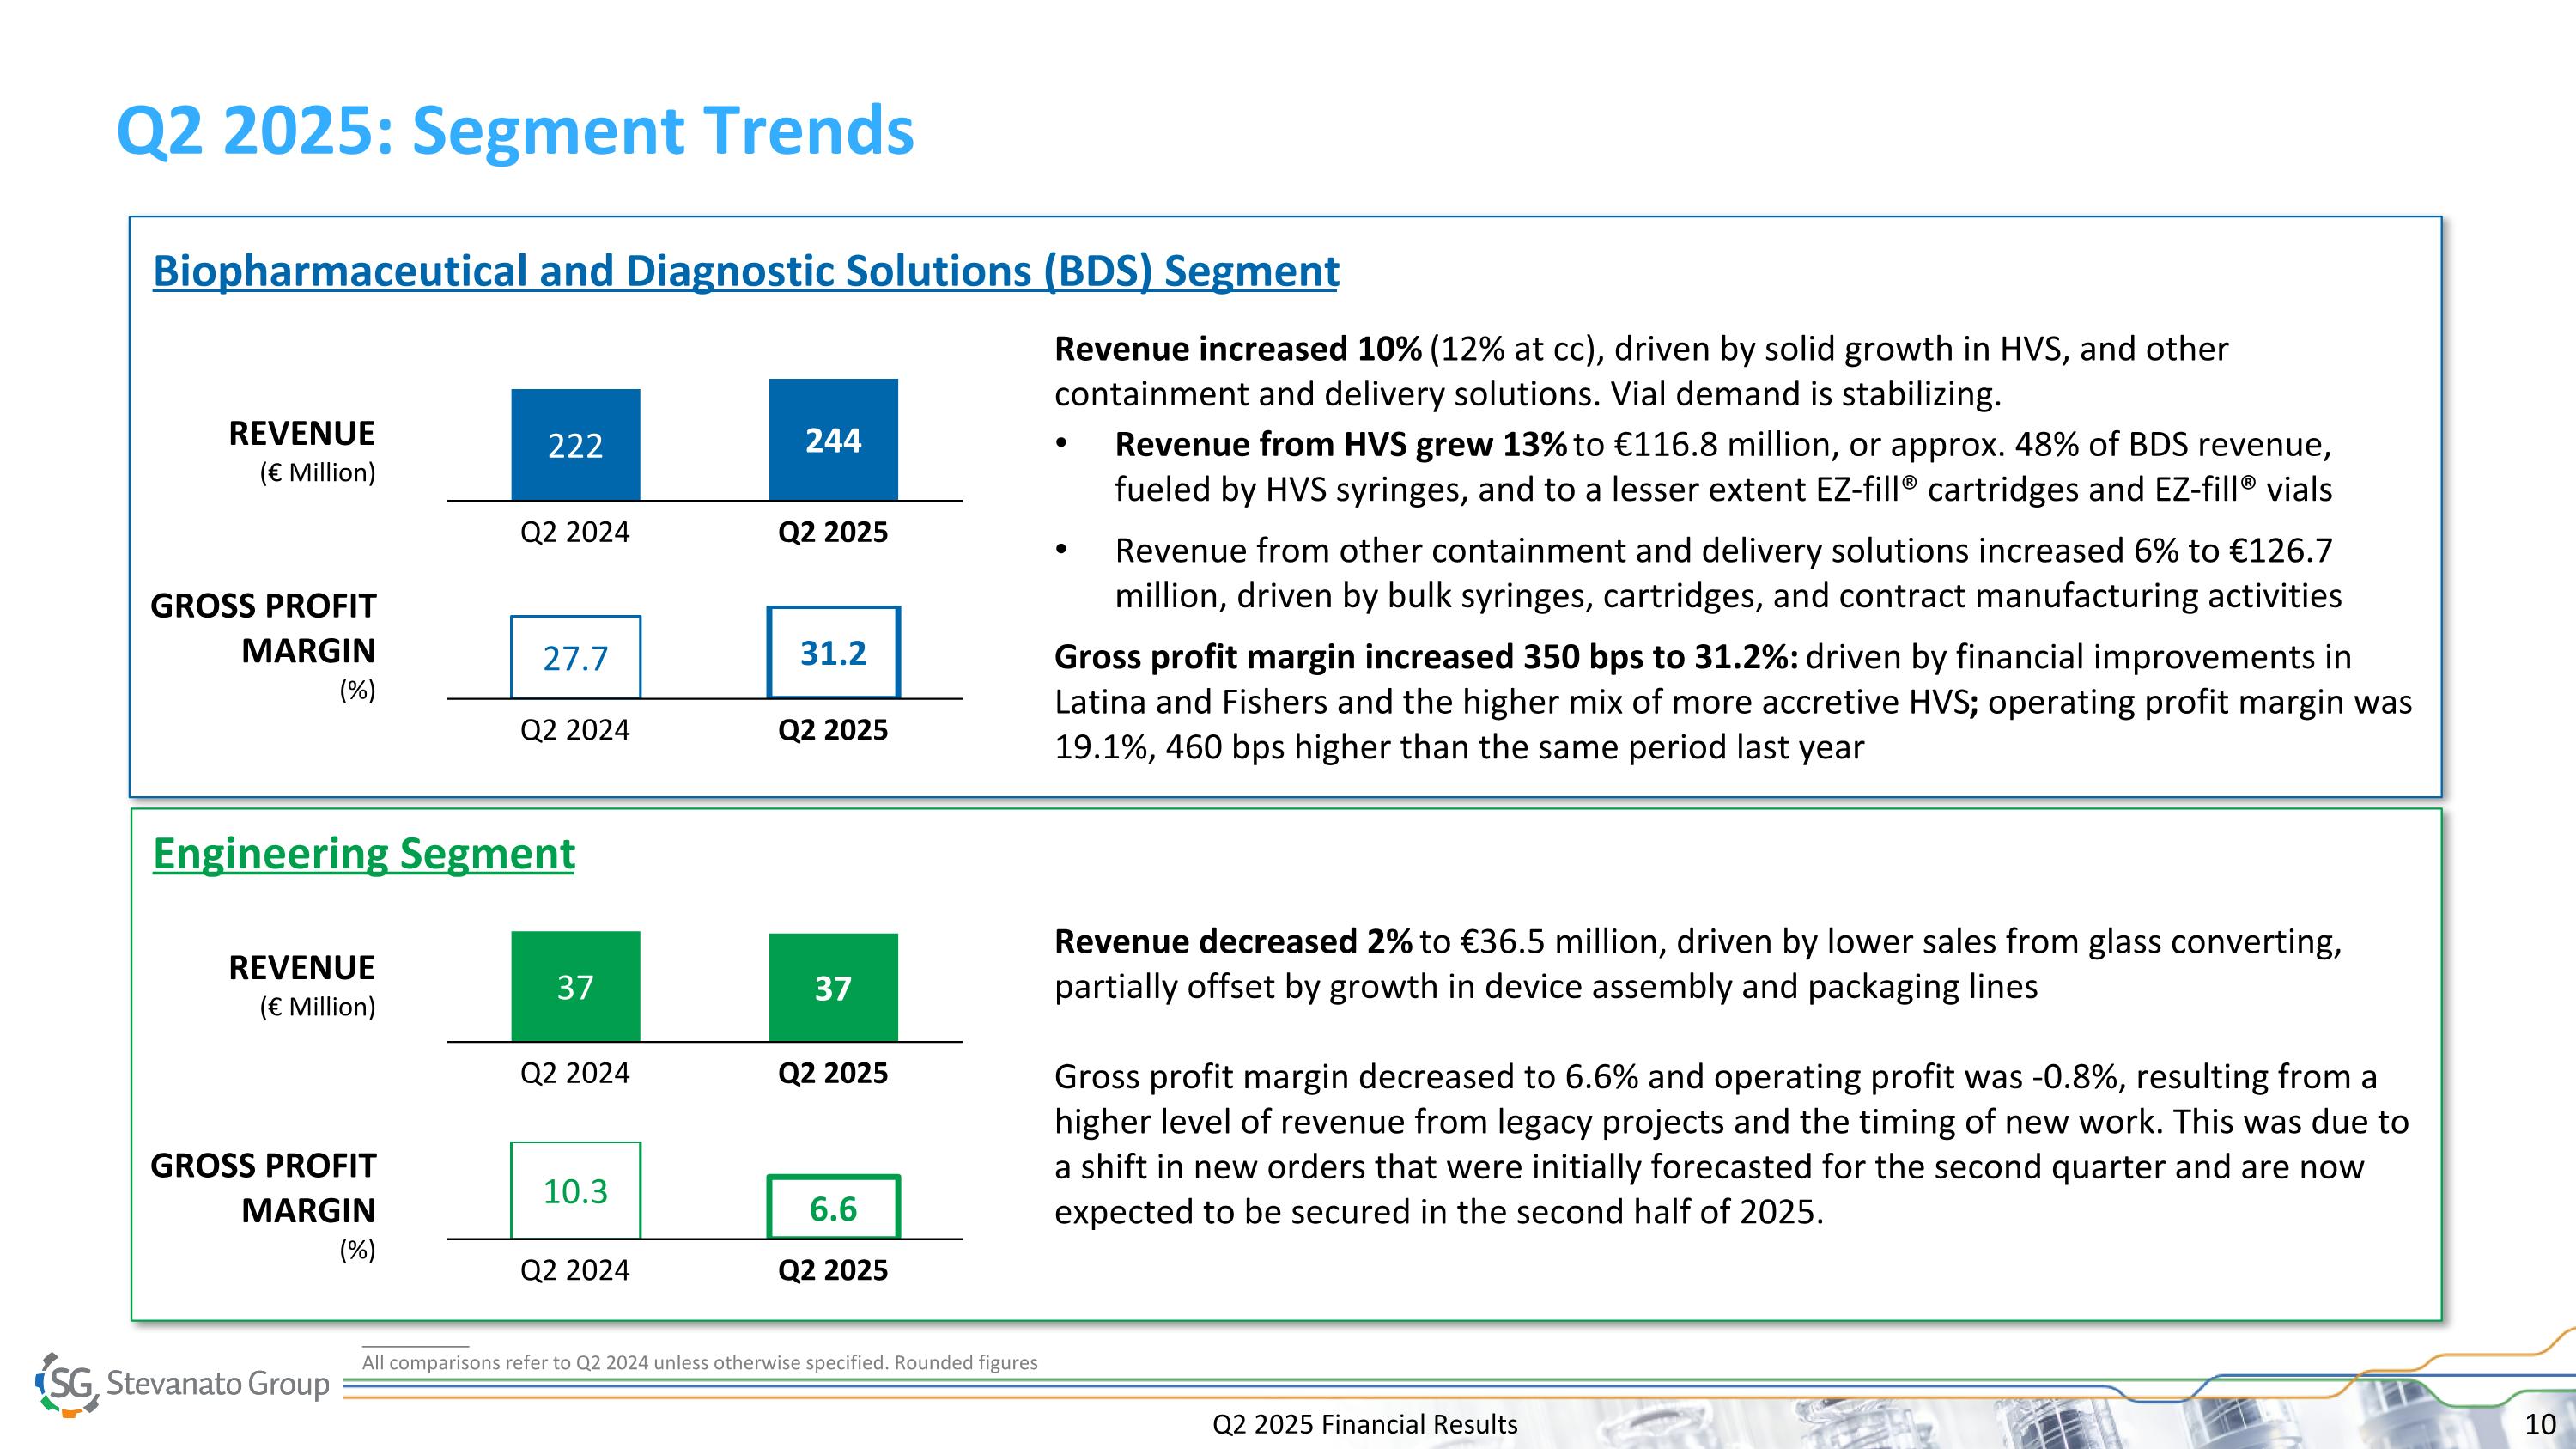
Q2 2025 Financial Results Q2 2025: Segment Trends 222 Q2 2024 244 Q2 2025 Revenue increased 10% (12% at cc), driven by solid growth in HVS, and other containment and delivery solutions. Vial demand is stabilizing. Revenue from HVS grew 13% to €116.8 million, or approx. 48% of BDS revenue, fueled by HVS syringes, and to a lesser extent EZ-fill® cartridges and EZ-fill® vials Revenue from other containment and delivery solutions increased 6% to €126.7 million, driven by bulk syringes, cartridges, and contract manufacturing activities Gross profit margin increased 350 bps to 31.2%: driven by financial improvements in Latina and Fishers and the higher mix of more accretive HVS; operating profit margin was 19.1%, 460 bps higher than the same period last year Biopharmaceutical and Diagnostic Solutions (BDS) Segment REVENUE (€ Million) GROSS PROFIT MARGIN (%) Engineering Segment 27.7 Q2 2024 31.2 Q2 2025 37 Q2 2024 37 Q2 2025 Revenue decreased 2% to €36.5 million, driven by lower sales from glass converting, partially offset by growth in device assembly and packaging lines Gross profit margin decreased to 6.6% and operating profit was -0.8%, resulting from a higher level of revenue from legacy projects and the timing of new work. This was due to a shift in new orders that were initially forecasted for the second quarter and are now expected to be secured in the second half of 2025. REVENUE (€ Million) GROSS PROFIT MARGIN (%) 10.3 Q2 2024 6.6 Q2 2025 __________ All comparisons refer to Q2 2024 unless otherwise specified. Rounded figures
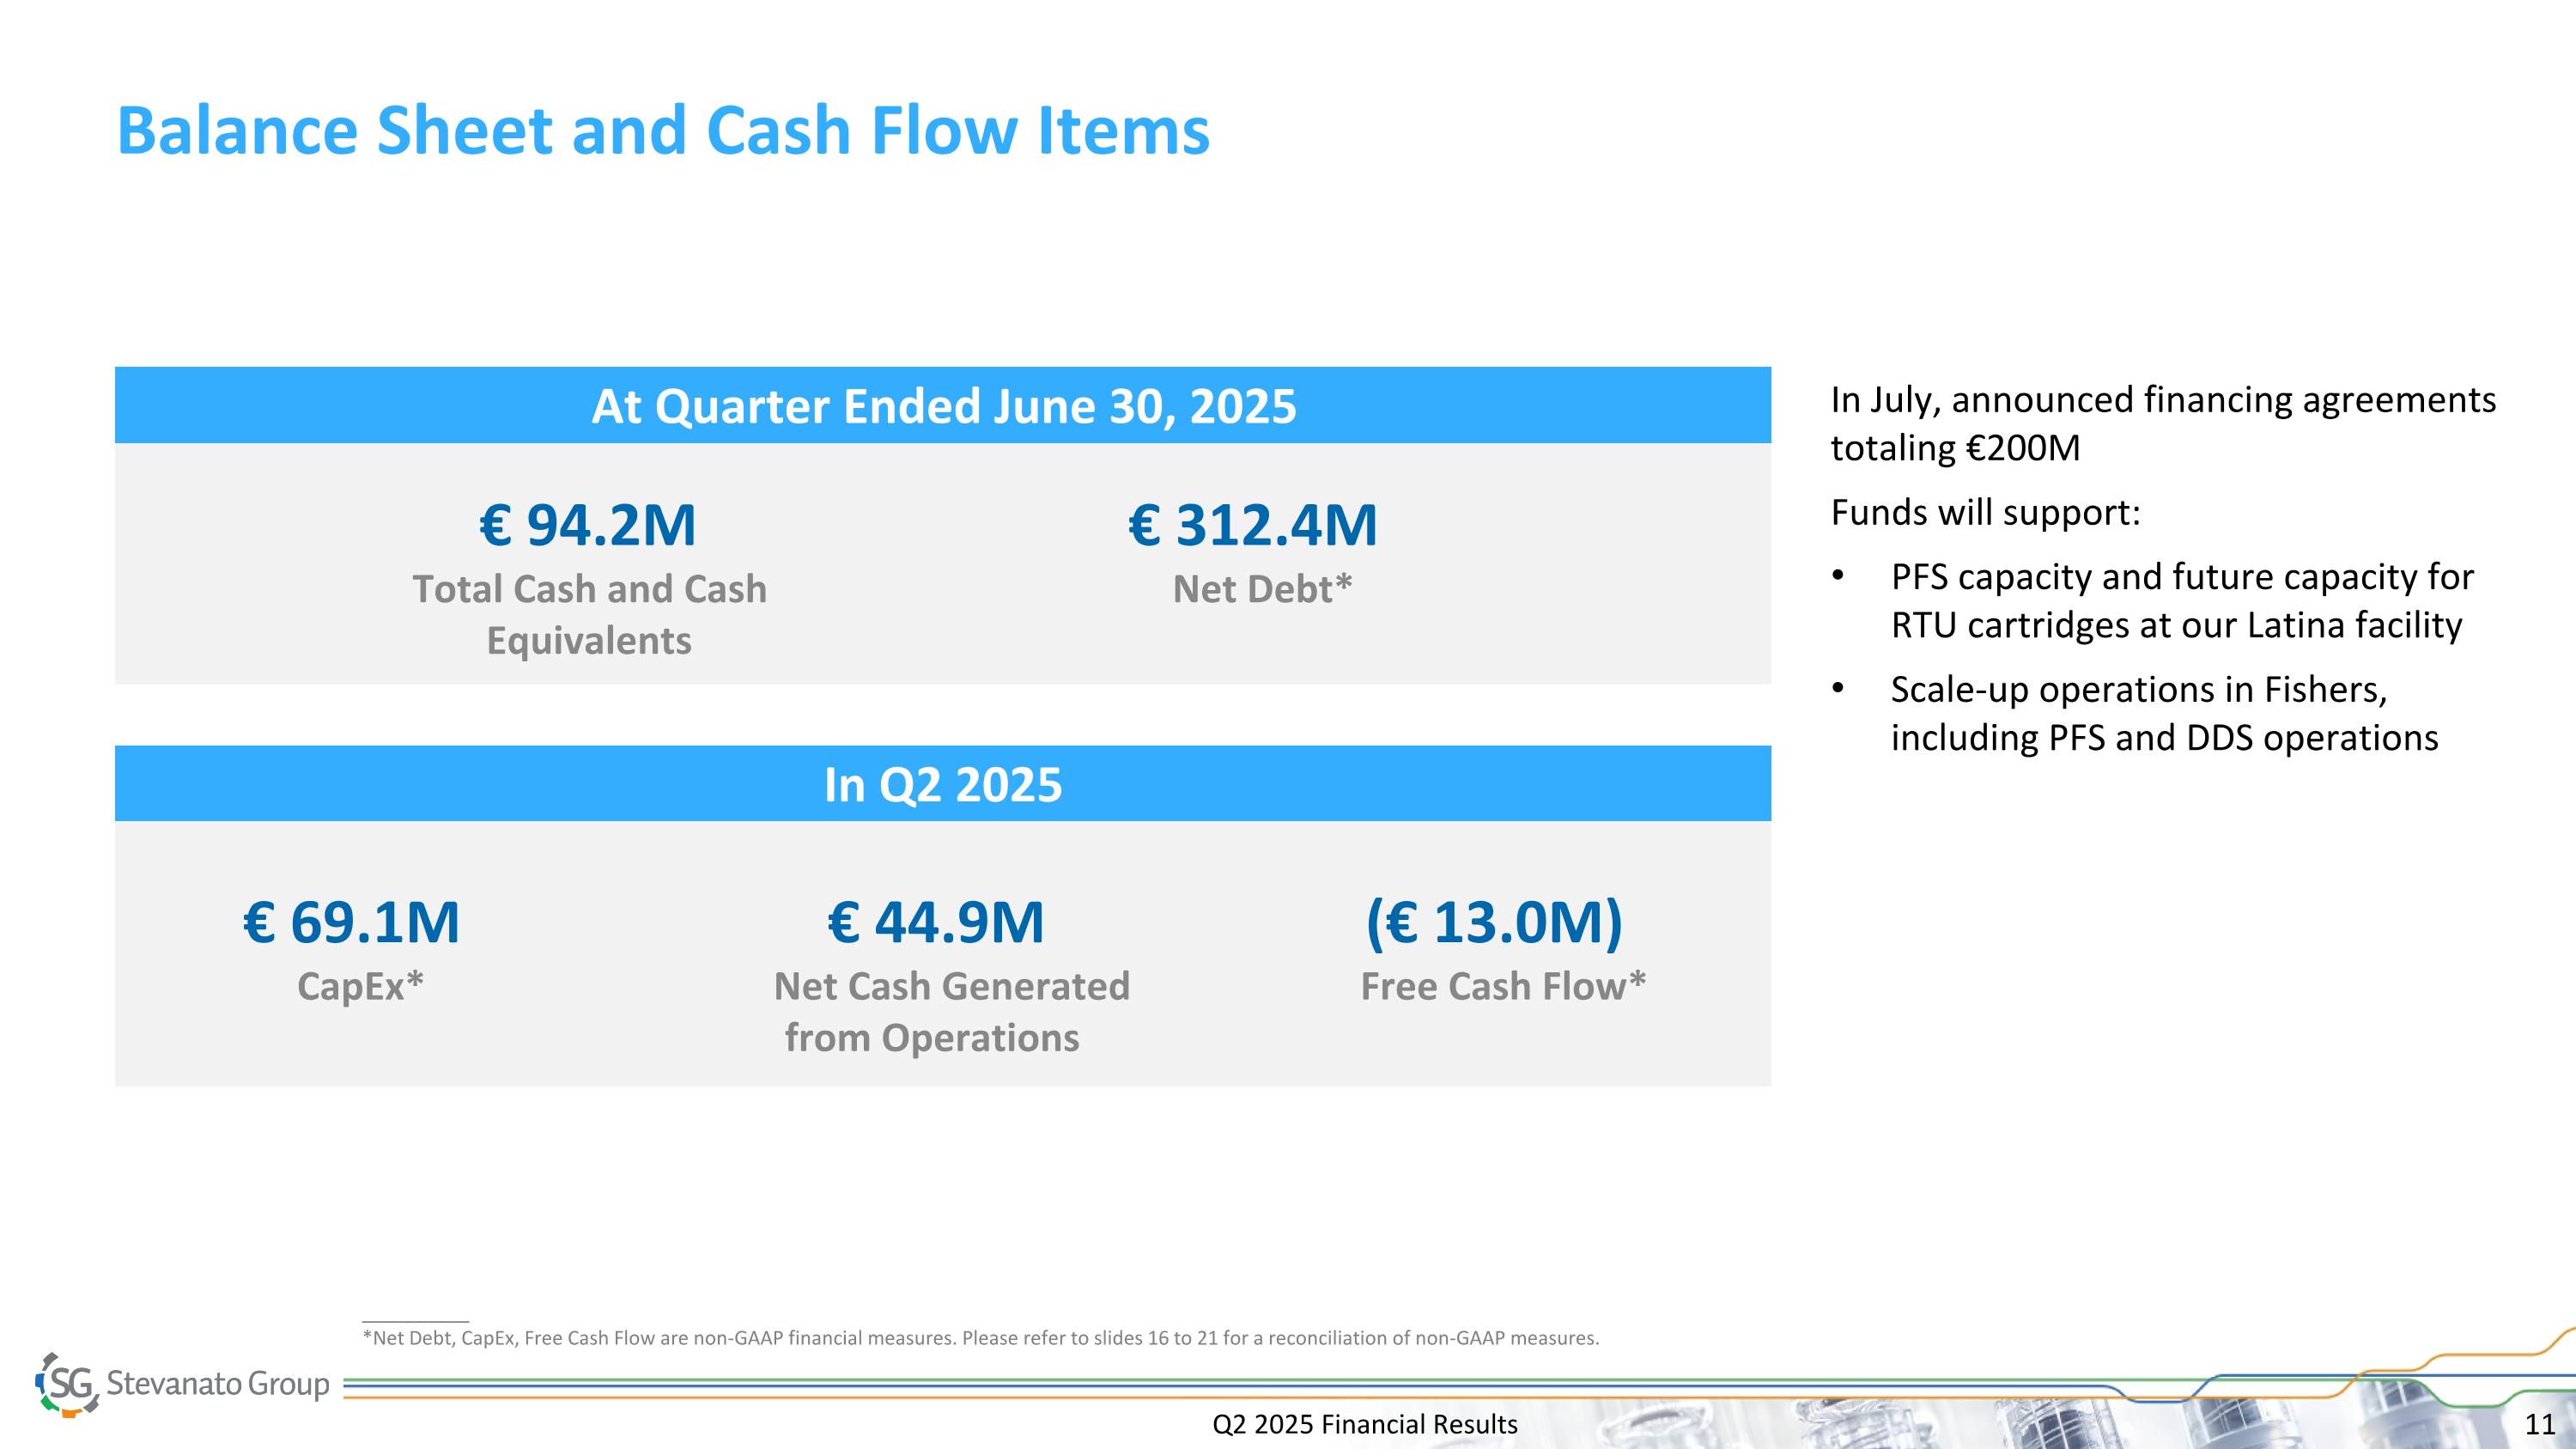
Q2 2025 Financial Results Balance Sheet and Cash Flow Items In Q2 2025 At Quarter Ended June 30, 2025 (€ 13.0M) Free Cash Flow* € 312.4M Net Debt* € 94.2M Total Cash and Cash Equivalents € 69.1M CapEx* € 44.9M Net Cash Generated from Operations __________ *Net Debt, CapEx, Free Cash Flow are non-GAAP financial measures. Please refer to slides 16 to 21 for a reconciliation of non-GAAP measures. In July, announced financing agreements totaling €200M Funds will support: PFS capacity and future capacity for RTU cartridges at our Latina facility Scale-up operations in Fishers, including PFS and DDS operations
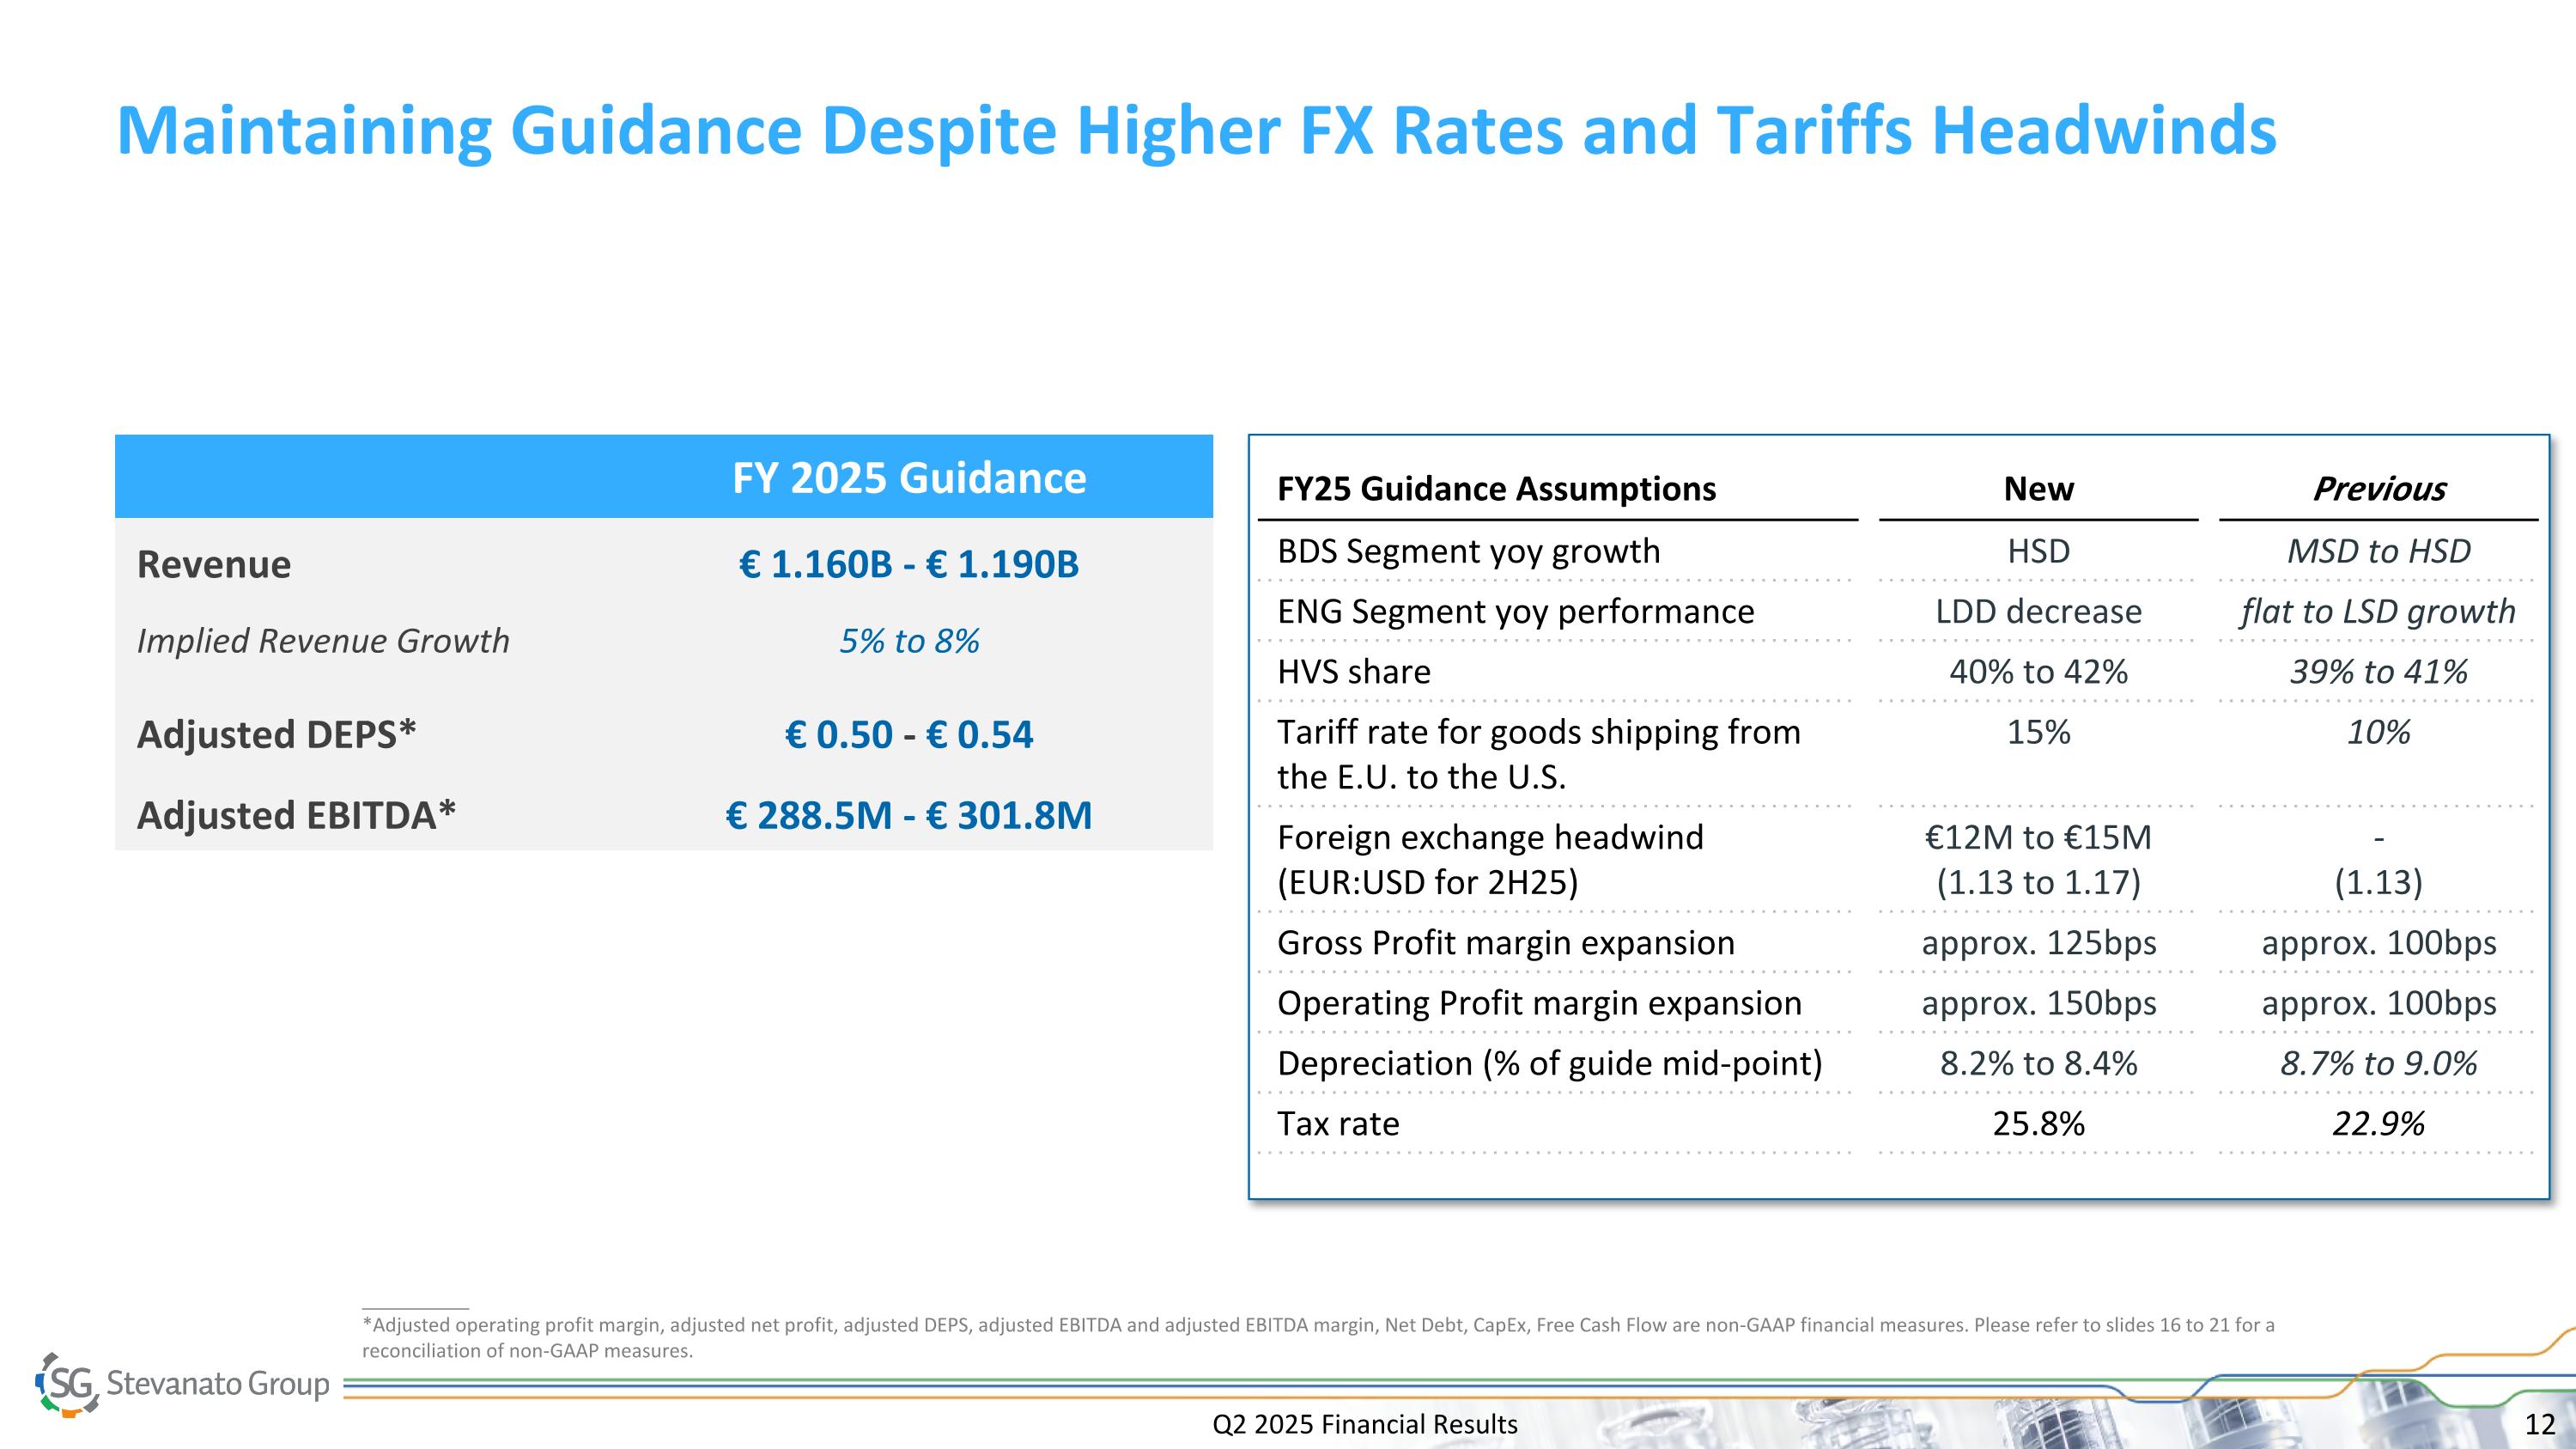
Q2 2025 Financial Results Maintaining Guidance Despite Higher FX Rates and Tariffs Headwinds __________ *Adjusted operating profit margin, adjusted net profit, adjusted DEPS, adjusted EBITDA and adjusted EBITDA margin, Net Debt, CapEx, Free Cash Flow are non-GAAP financial measures. Please refer to slides 16 to 21 for a reconciliation of non-GAAP measures. FY 2025 Guidance Revenue € 1.160B - € 1.190B Implied Revenue Growth 5% to 8% Adjusted DEPS* € 0.50 - € 0.54 Adjusted EBITDA* € 288.5M - € 301.8M FY25 Guidance Assumptions New Previous BDS Segment yoy growth HSD MSD to HSD ENG Segment yoy performance LDD decrease flat to LSD growth HVS share 40% to 42% 39% to 41% Tariff rate for goods shipping from the E.U. to the U.S. 15% 10% Foreign exchange headwind (EUR:USD for 2H25) €12M to €15M (1.13 to 1.17) - (1.13) Gross Profit margin expansion approx. 125bps approx. 100bps Operating Profit margin expansion approx. 150bps approx. 100bps Depreciation (% of guide mid-point) 8.2% to 8.4% 8.7% to 9.0% Tax rate 25.8% 22.9%
Franco Stevanato Chairman & Chief Executive Officer Q2 2025 Financial Results
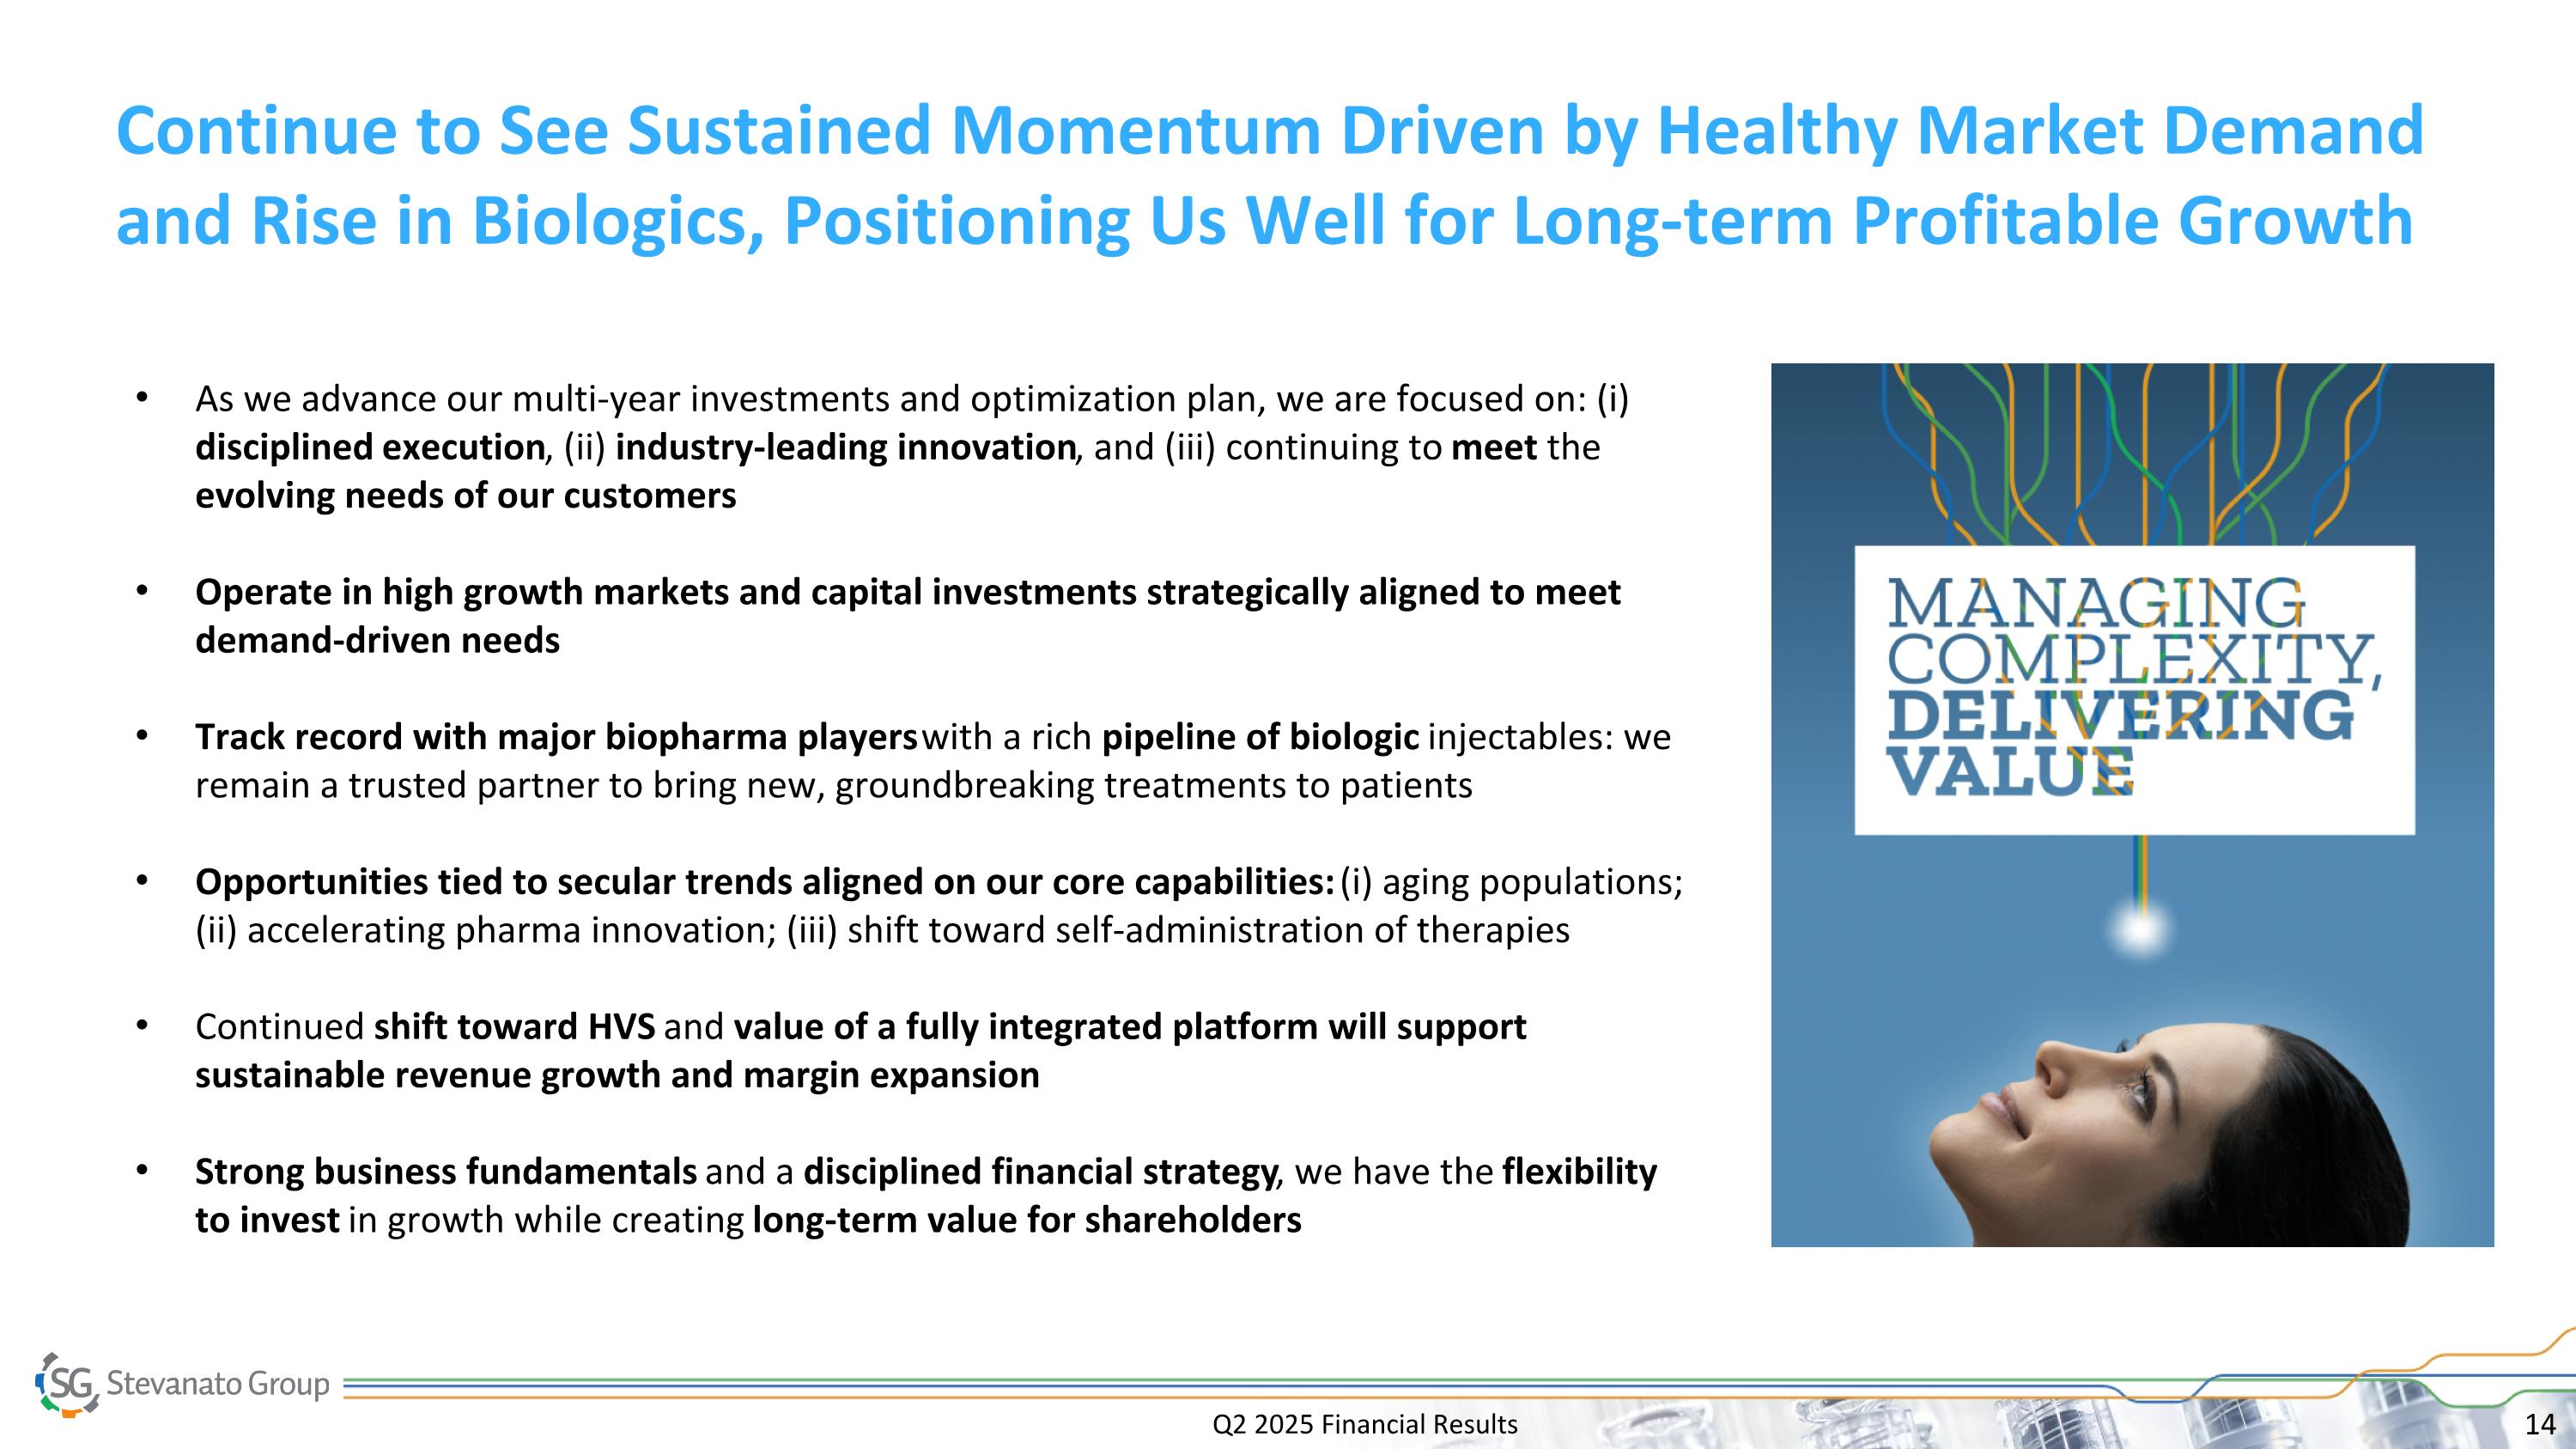
Q2 2025 Financial Results Continue to See Sustained Momentum Driven by Healthy Market Demand and Rise in Biologics, Positioning Us Well for Long-term Profitable Growth As we advance our multi-year investments and optimization plan, we are focused on: (i) disciplined execution, (ii) industry-leading innovation, and (iii) continuing to meet the evolving needs of our customers Operate in high growth markets and capital investments strategically aligned to meet demand-driven needs Track record with major biopharma players with a rich pipeline of biologic injectables: we remain a trusted partner to bring new, groundbreaking treatments to patients Opportunities tied to secular trends aligned on our core capabilities: (i) aging populations; (ii) accelerating pharma innovation; (iii) shift toward self-administration of therapies Continued shift toward HVS and value of a fully integrated platform will support sustainable revenue growth and margin expansion Strong business fundamentals and a disciplined financial strategy, we have the flexibility to invest in growth while creating long-term value for shareholders

Stevanato Group Q2 2025 Financial Results
This presentation contains non-GAAP financial measures. Please refer to the tables included in this presentation for a reconciliation of non-GAAP measures. Management monitors and evaluates our operating and financial performance using several non-GAAP financial measures, including Constant Currency Revenue, EBITDA, Adjusted EBITDA, Adjusted EBITDA Margin, Adjusted Operating Profit, Adjusted Operating Profit Margin, Adjusted Income Taxes, Adjusted Net Profit, Adjusted Diluted EPS, Capital Employed, Net Cash, Free Cash Flow, and CapEx. We believe that these non-GAAP financial measures provide useful and relevant information regarding our performance and improve our ability to assess our financial condition. While similar measures are widely used in the industry in which we operate, the financial measures we use may not be comparable to other similarly titled measures used by other companies, nor are they intended to be substitutes for measures of financial performance or financial position as prepared in accordance with IFRS. Reconciliation of Non-GAAP Financial Measures Q2 2025 Financial Results
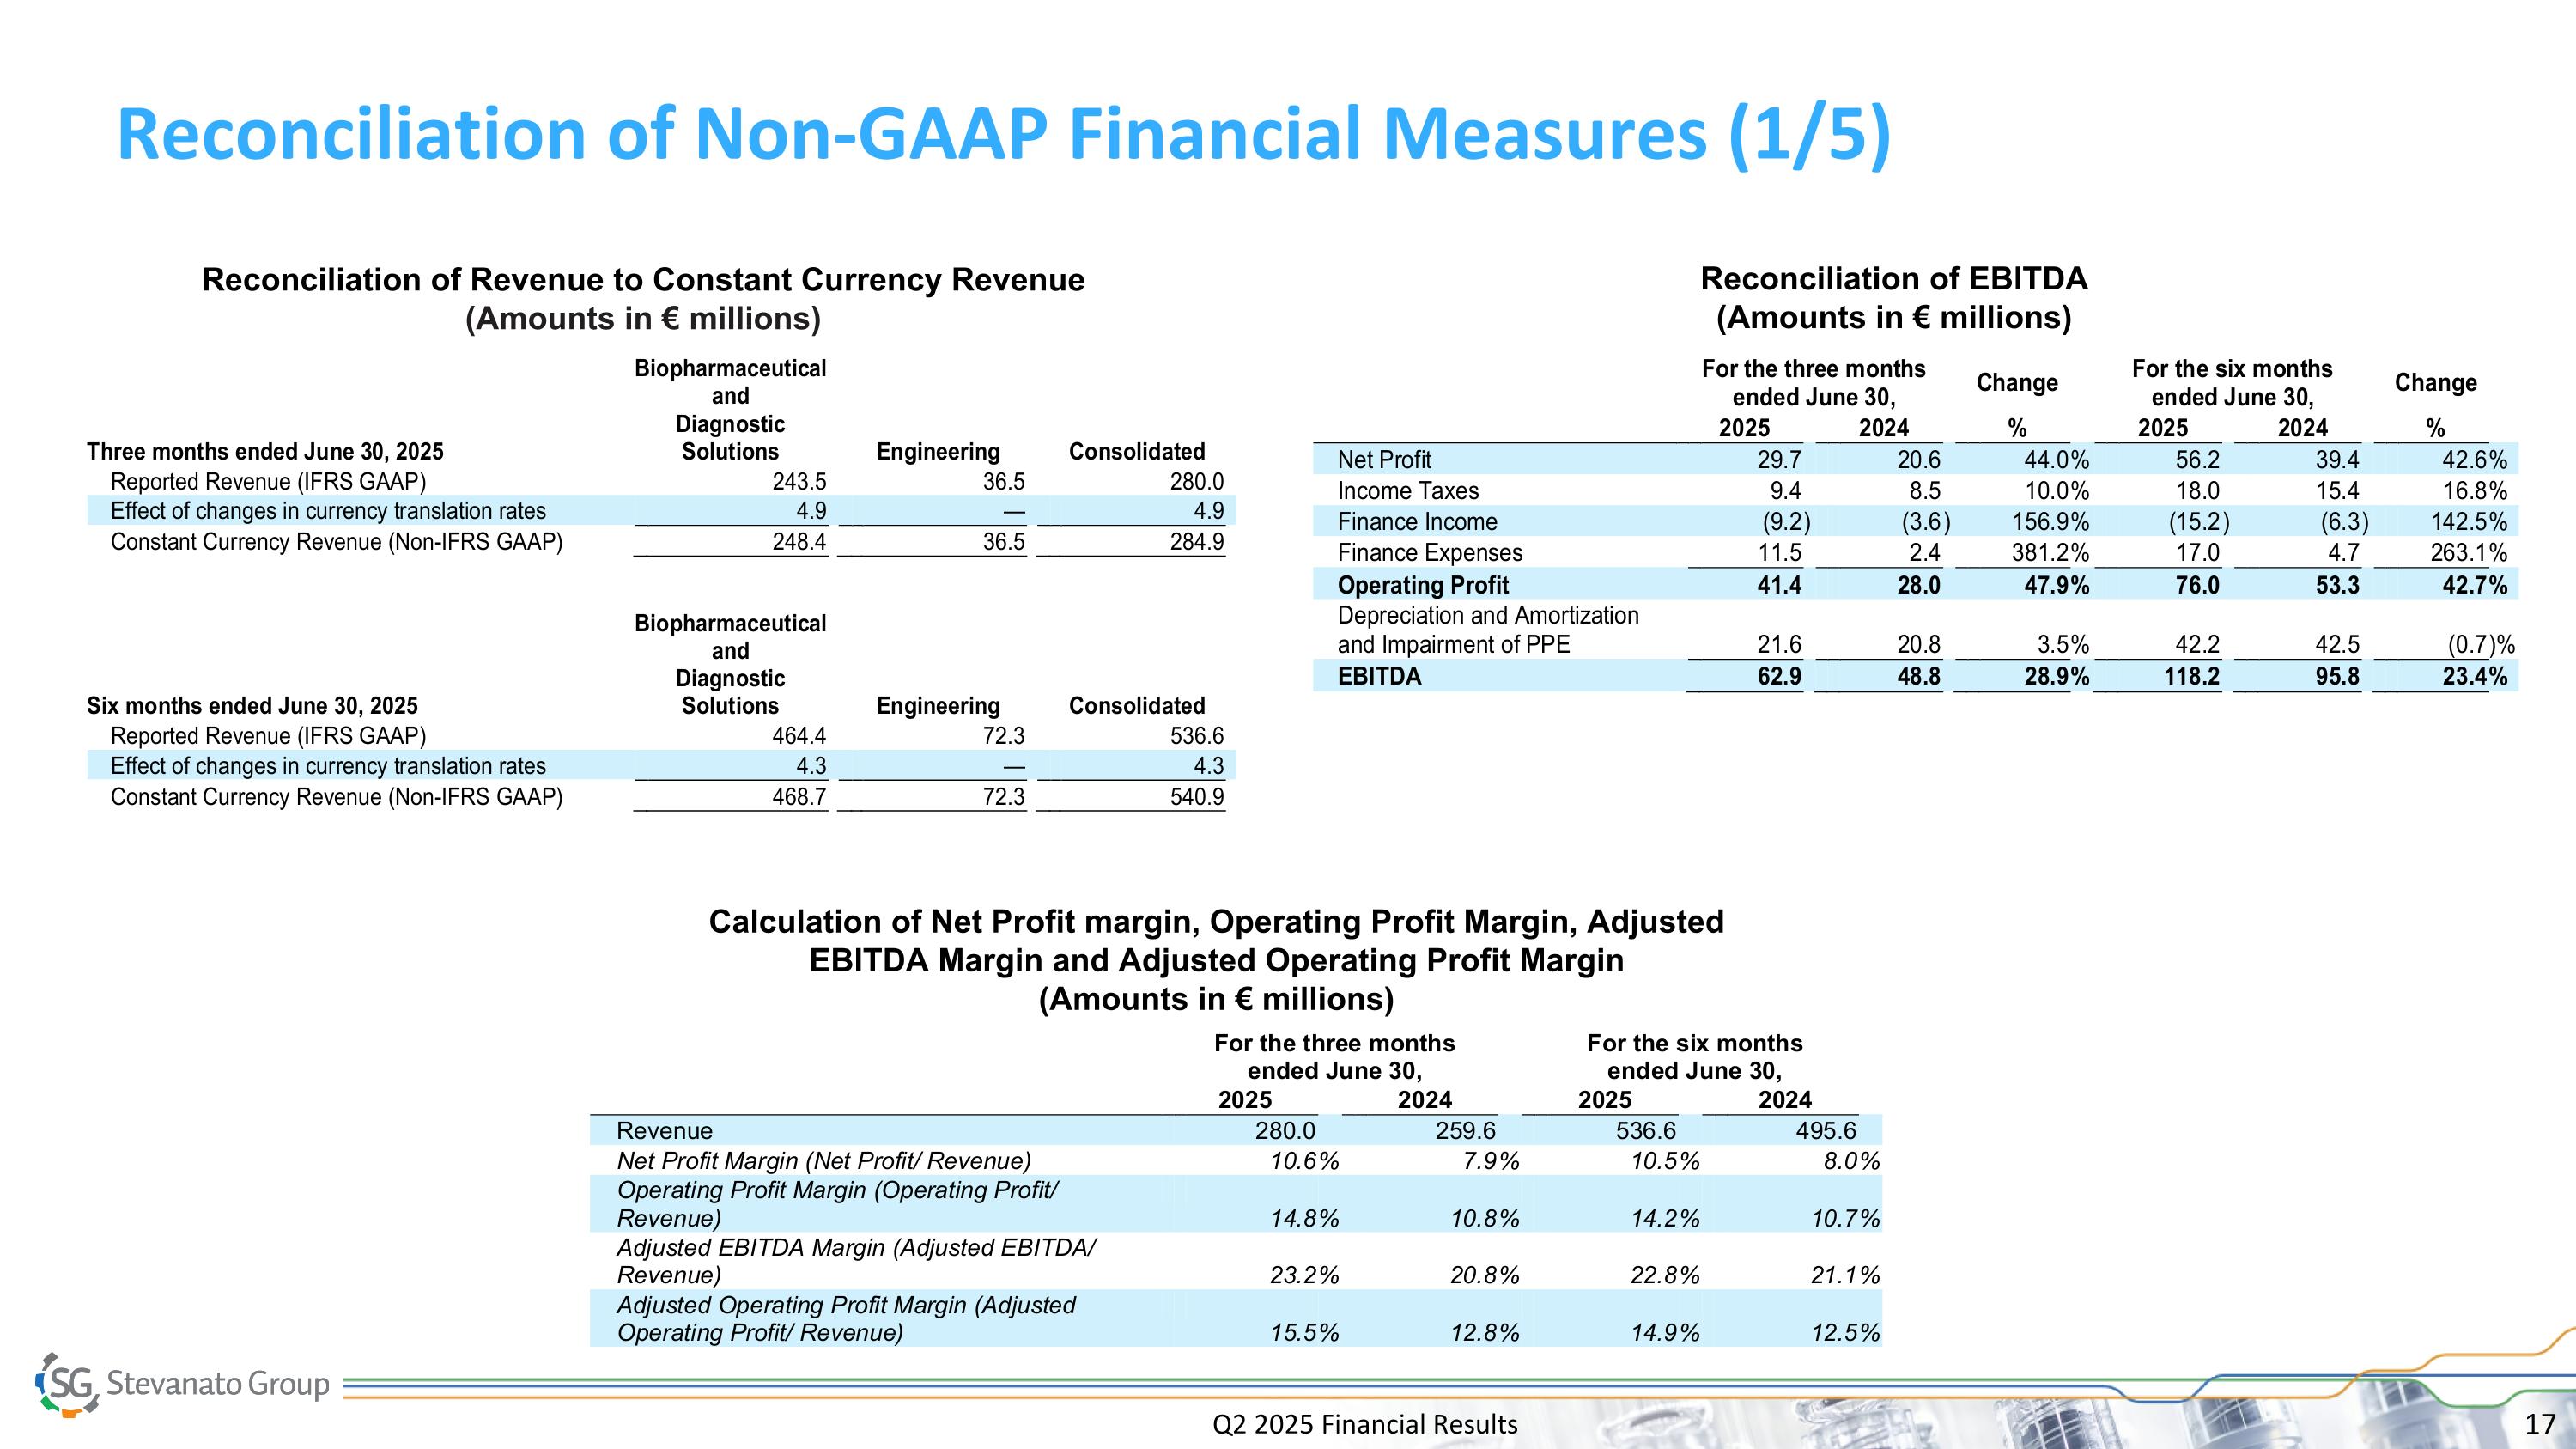
Q2 2025 Financial Results Reconciliation of Non-GAAP Financial Measures (1/5) Reconciliation of EBITDA (Amounts in € millions) Calculation of Net Profit margin, Operating Profit Margin, Adjusted EBITDA Margin and Adjusted Operating Profit Margin (Amounts in € millions) Reconciliation of Revenue to Constant Currency Revenue (Amounts in € millions)
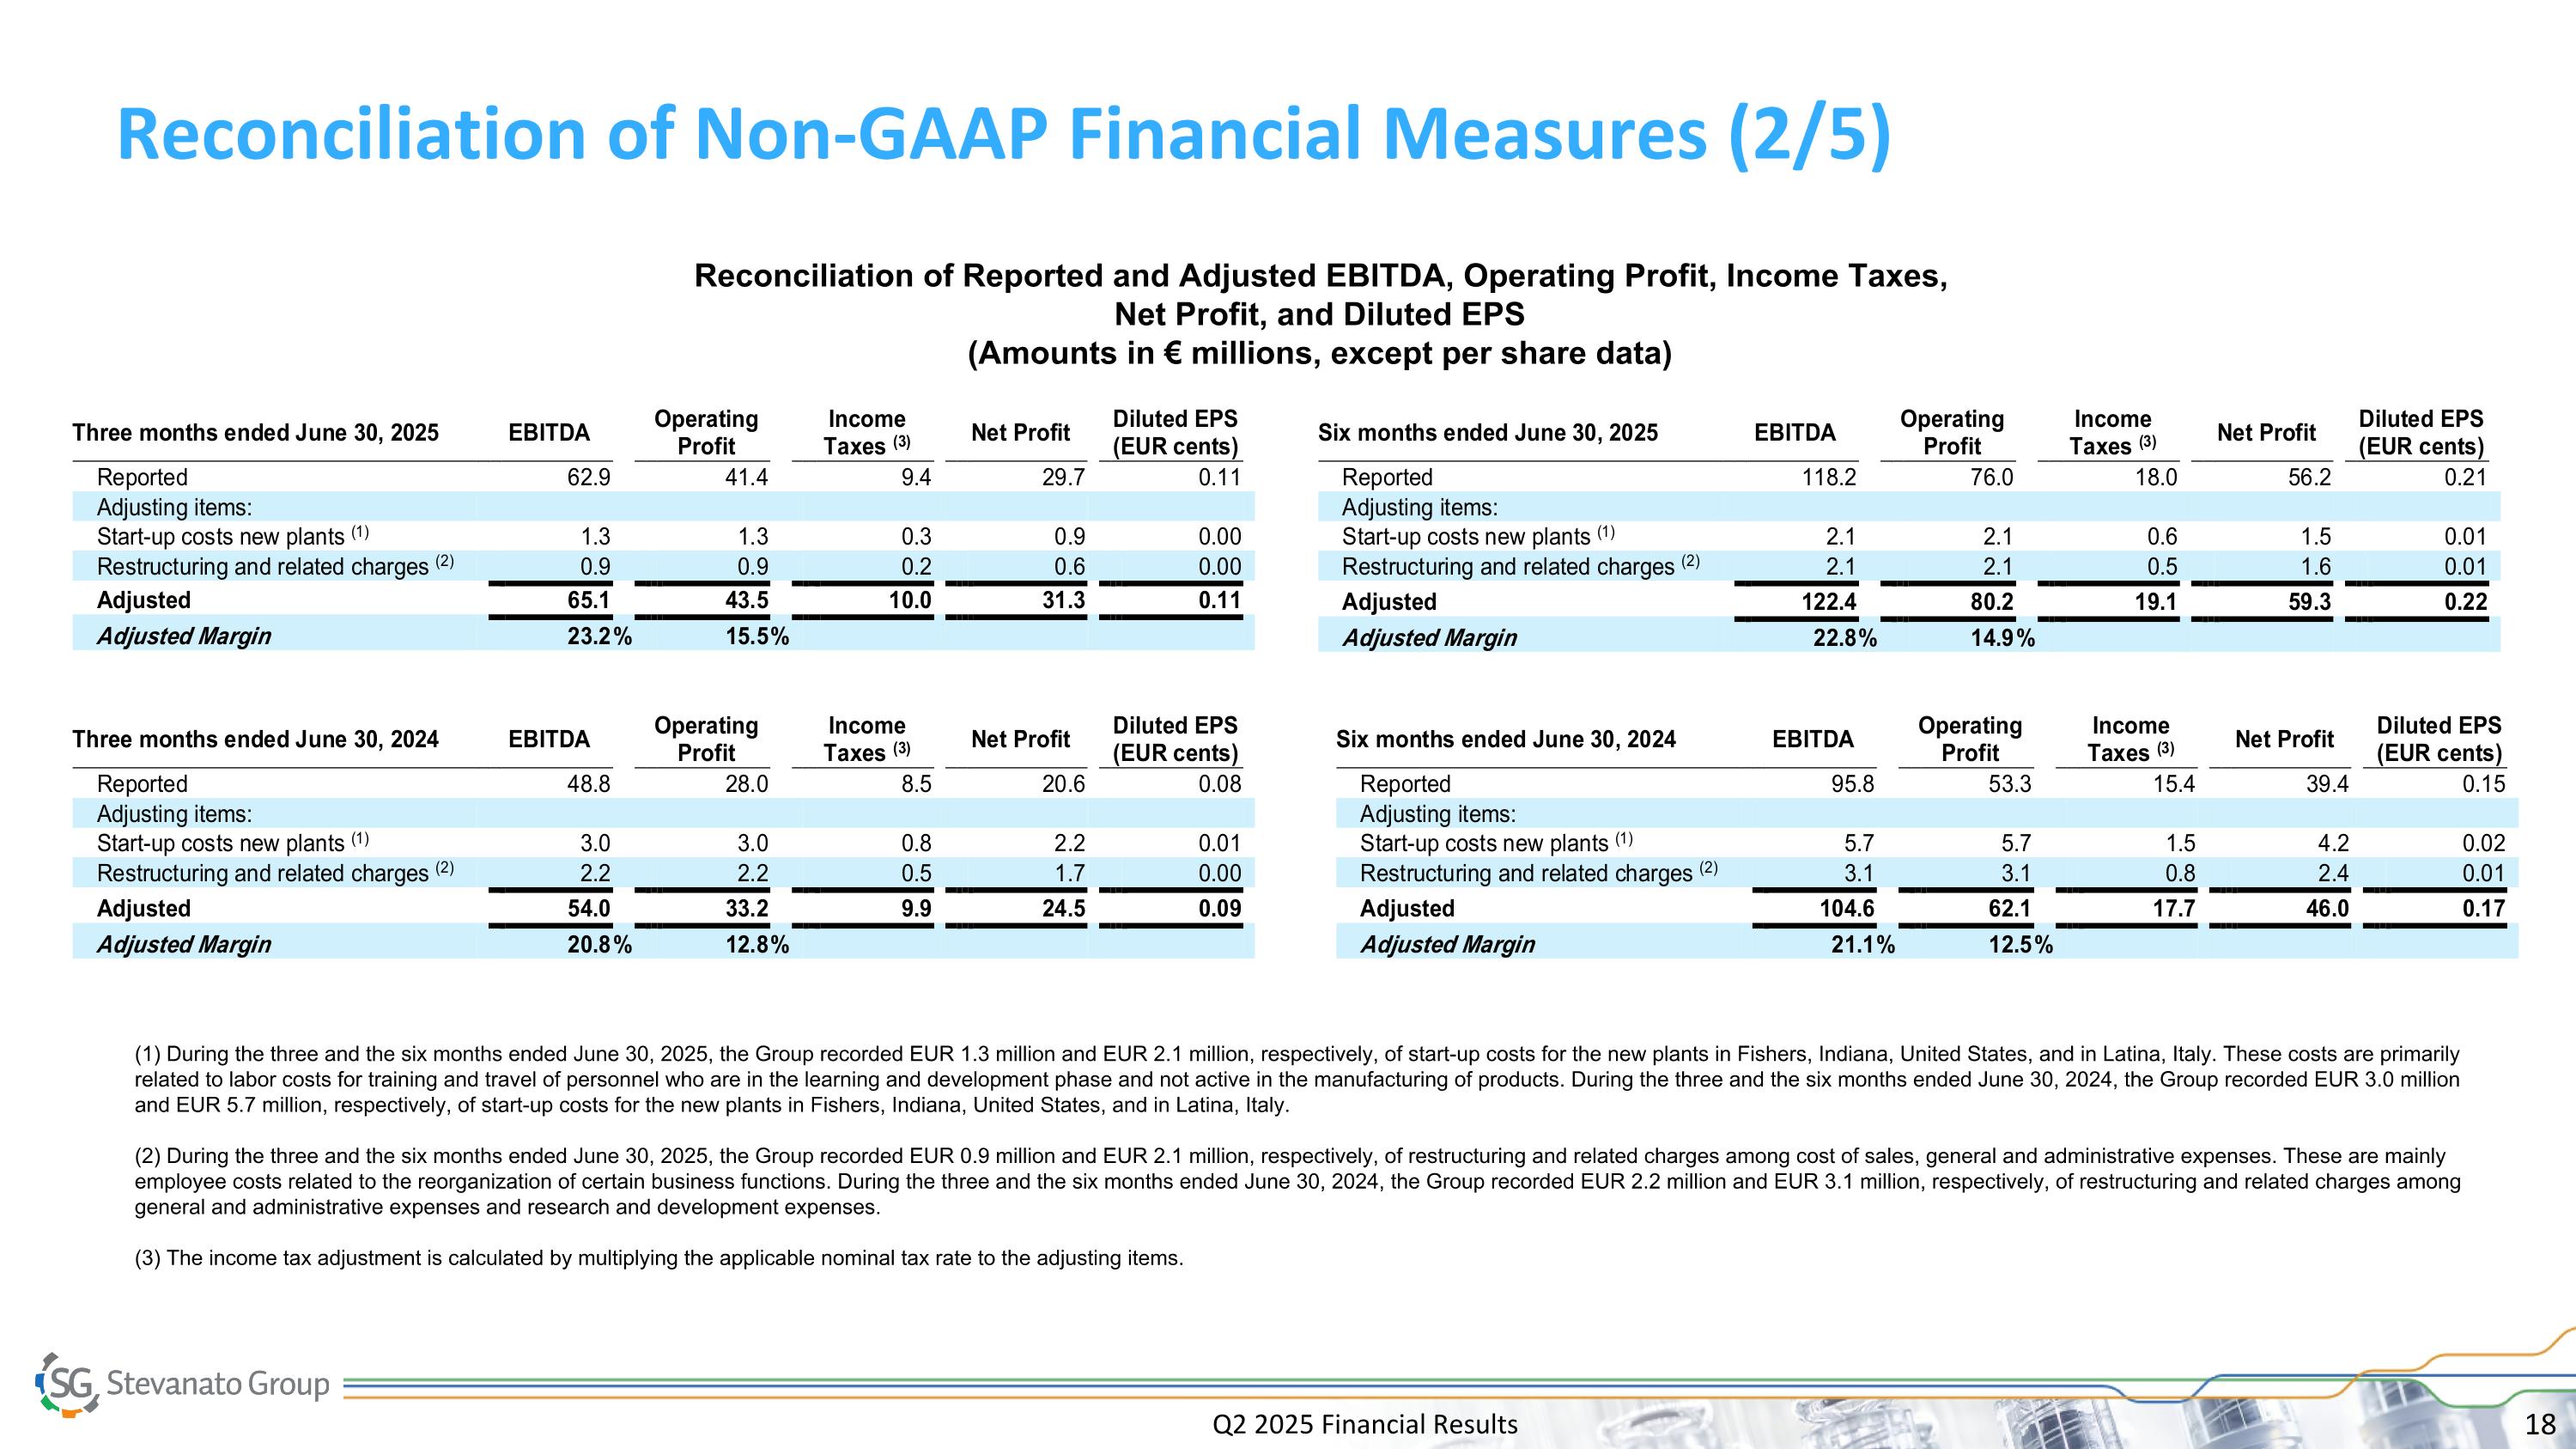
Q2 2025 Financial Results Reconciliation of Non-GAAP Financial Measures (2/5) Reconciliation of Reported and Adjusted EBITDA, Operating Profit, Income Taxes, Net Profit, and Diluted EPS (Amounts in € millions, except per share data) (1) During the three and the six months ended June 30, 2025, the Group recorded EUR 1.3 million and EUR 2.1 million, respectively, of start-up costs for the new plants in Fishers, Indiana, United States, and in Latina, Italy. These costs are primarily related to labor costs for training and travel of personnel who are in the learning and development phase and not active in the manufacturing of products. During the three and the six months ended June 30, 2024, the Group recorded EUR 3.0 million and EUR 5.7 million, respectively, of start-up costs for the new plants in Fishers, Indiana, United States, and in Latina, Italy. (2) During the three and the six months ended June 30, 2025, the Group recorded EUR 0.9 million and EUR 2.1 million, respectively, of restructuring and related charges among cost of sales, general and administrative expenses. These are mainly employee costs related to the reorganization of certain business functions. During the three and the six months ended June 30, 2024, the Group recorded EUR 2.2 million and EUR 3.1 million, respectively, of restructuring and related charges among general and administrative expenses and research and development expenses. (3) The income tax adjustment is calculated by multiplying the applicable nominal tax rate to the adjusting items.
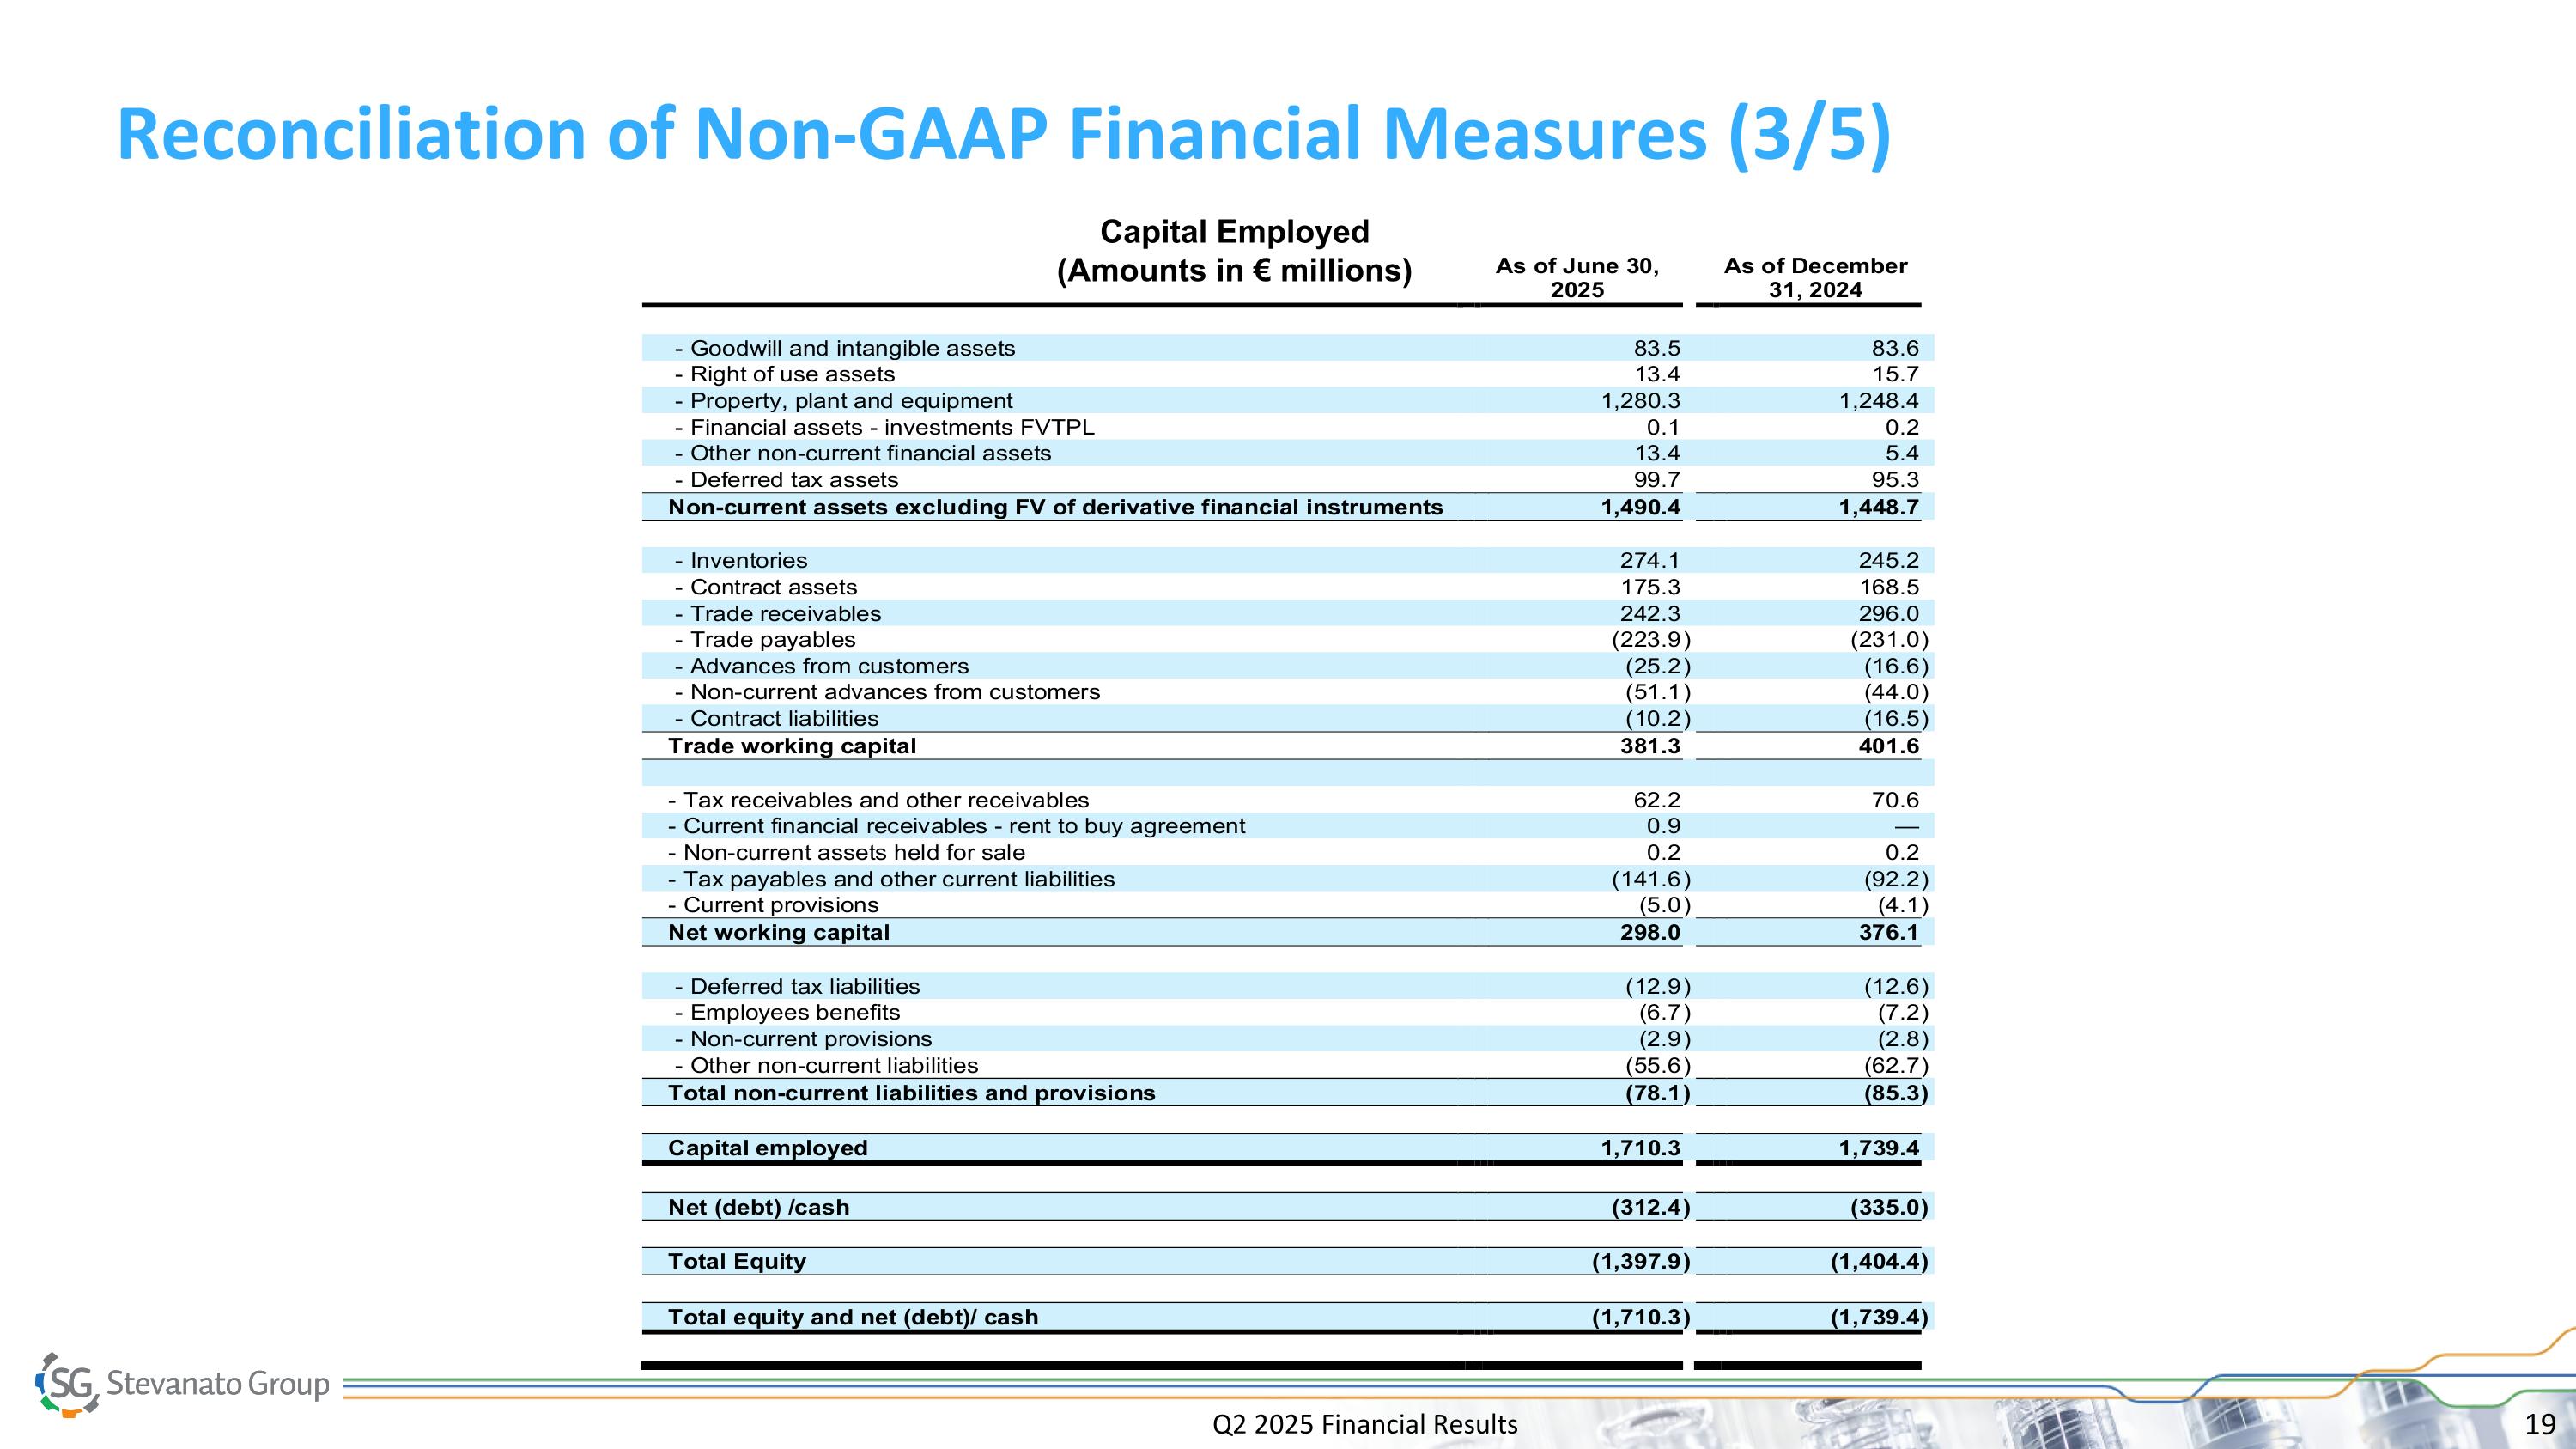
Q2 2025 Financial Results Reconciliation of Non-GAAP Financial Measures (3/5) Capital Employed (Amounts in € millions)
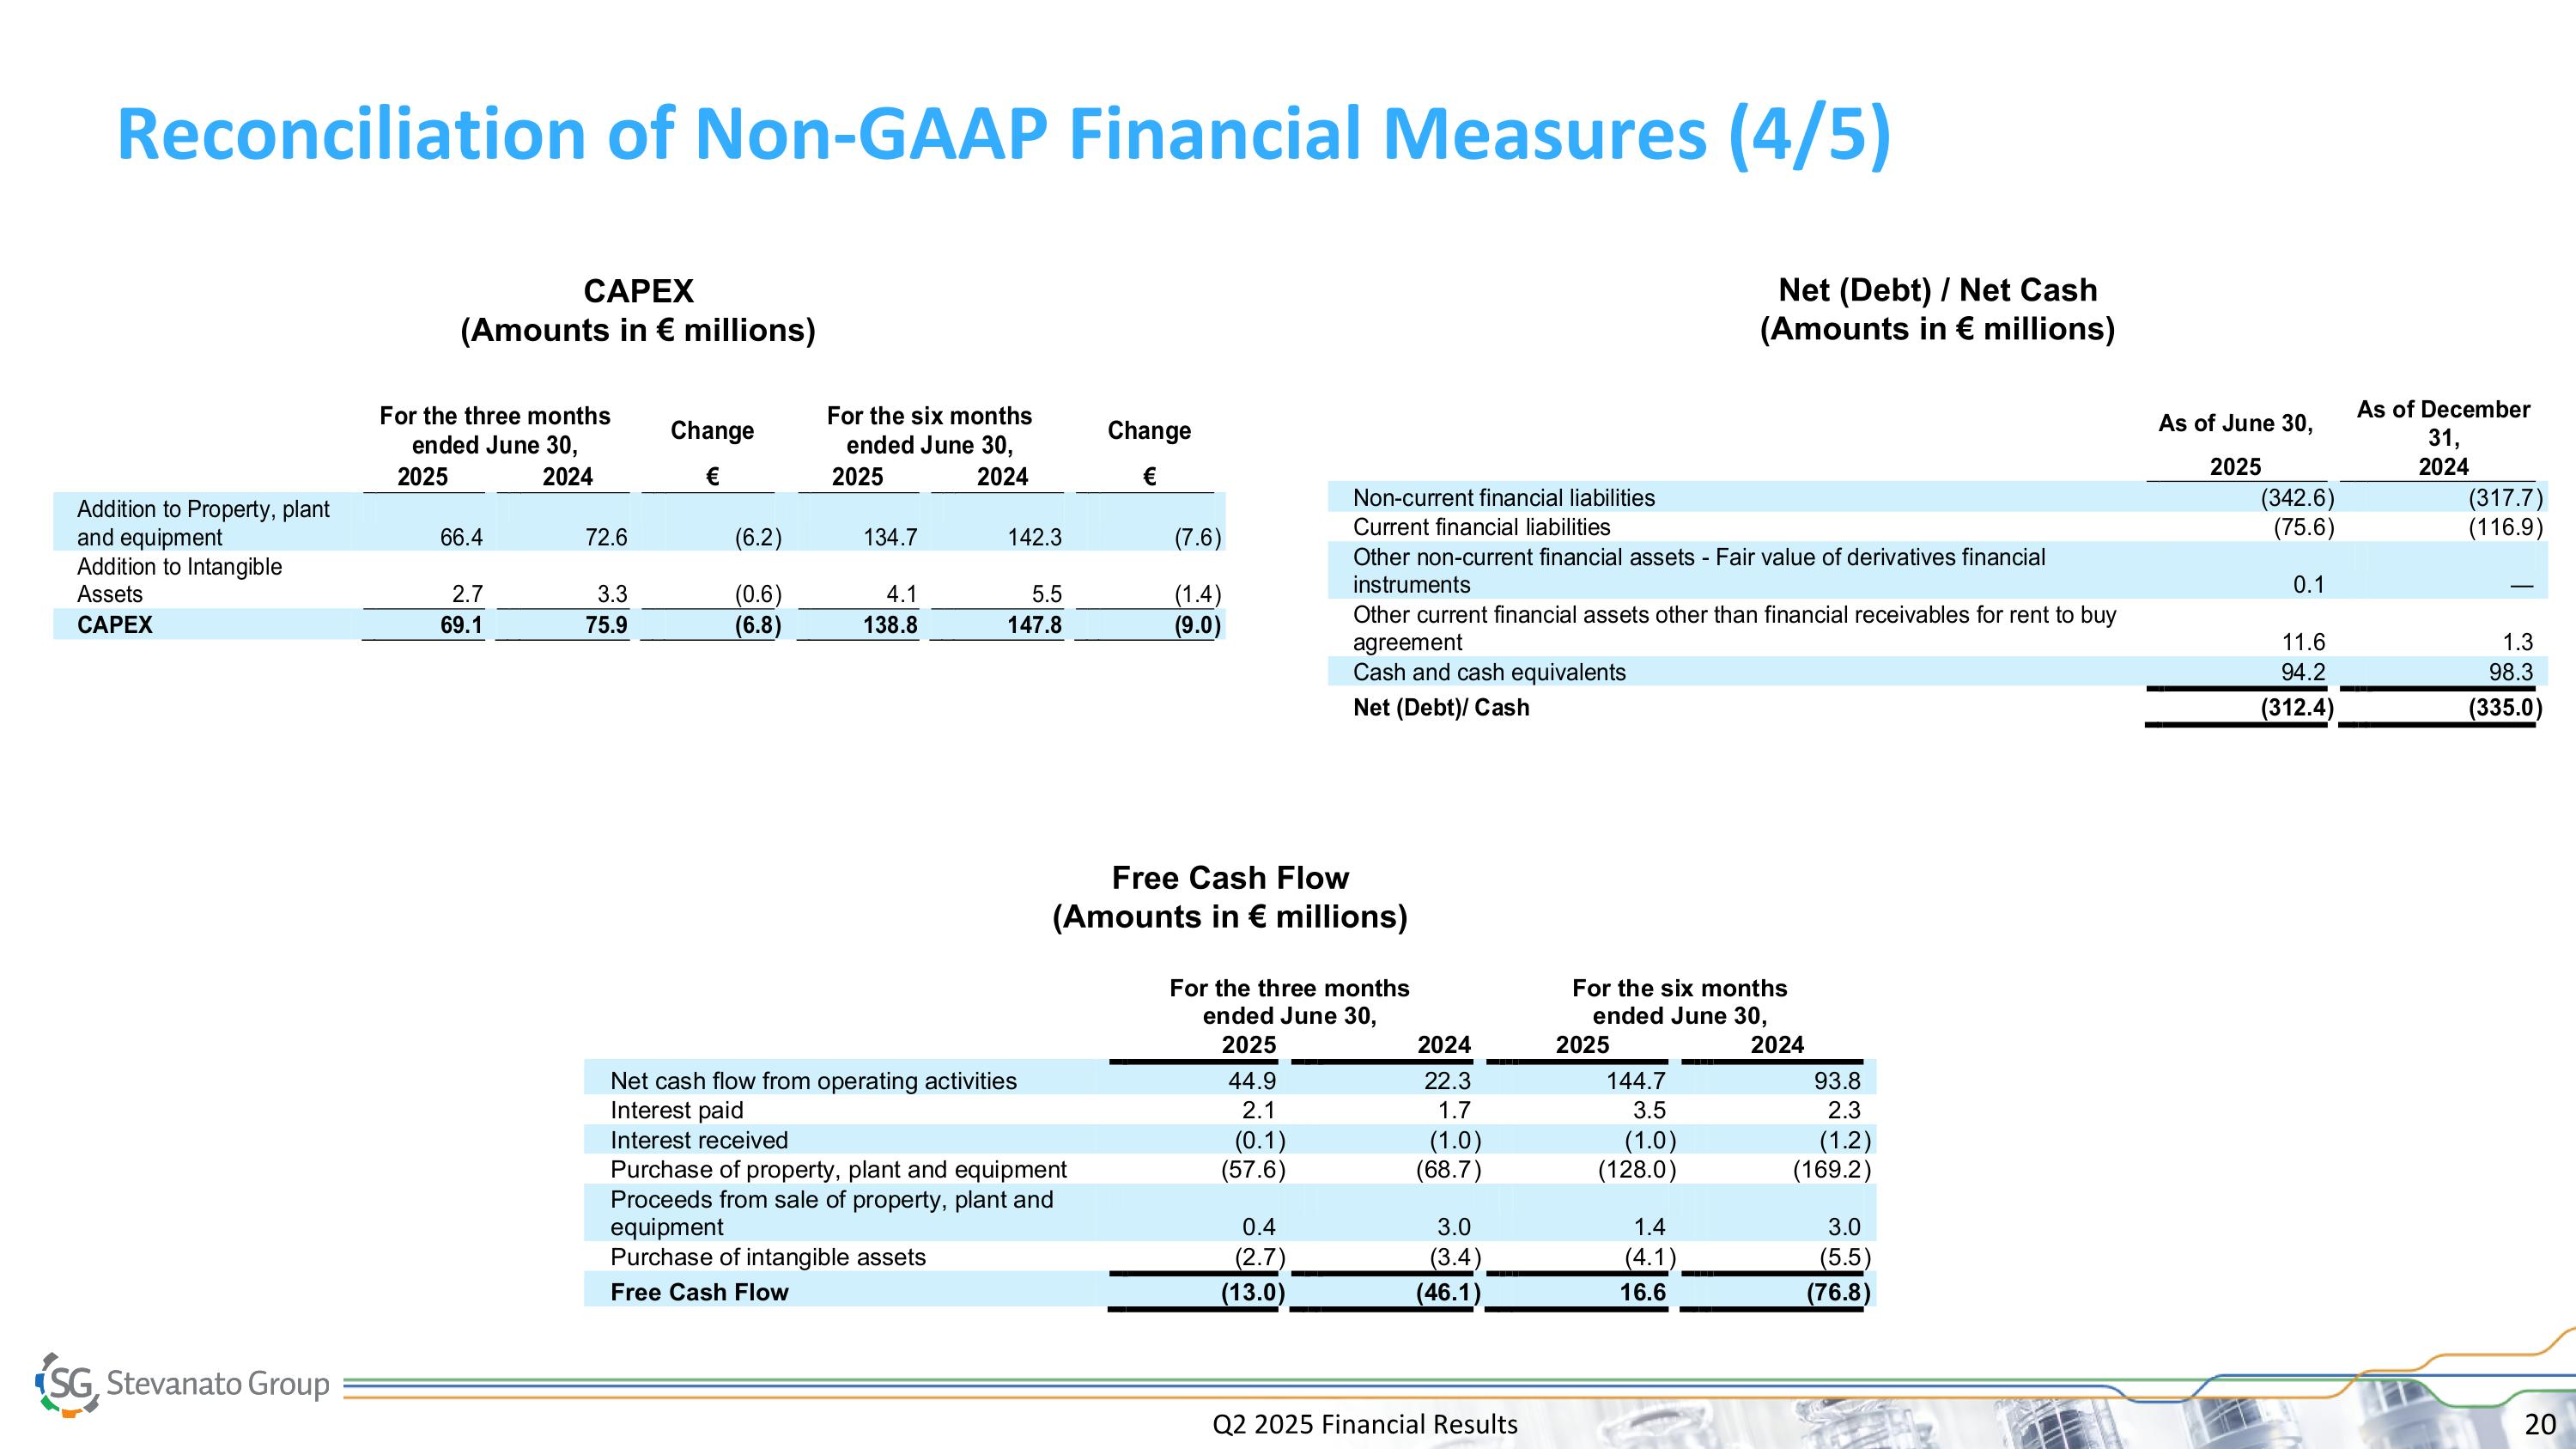
Q2 2025 Financial Results Reconciliation of Non-GAAP Financial Measures (4/5) Net (Debt) / Net Cash (Amounts in € millions) Free Cash Flow (Amounts in € millions) CAPEX (Amounts in € millions)
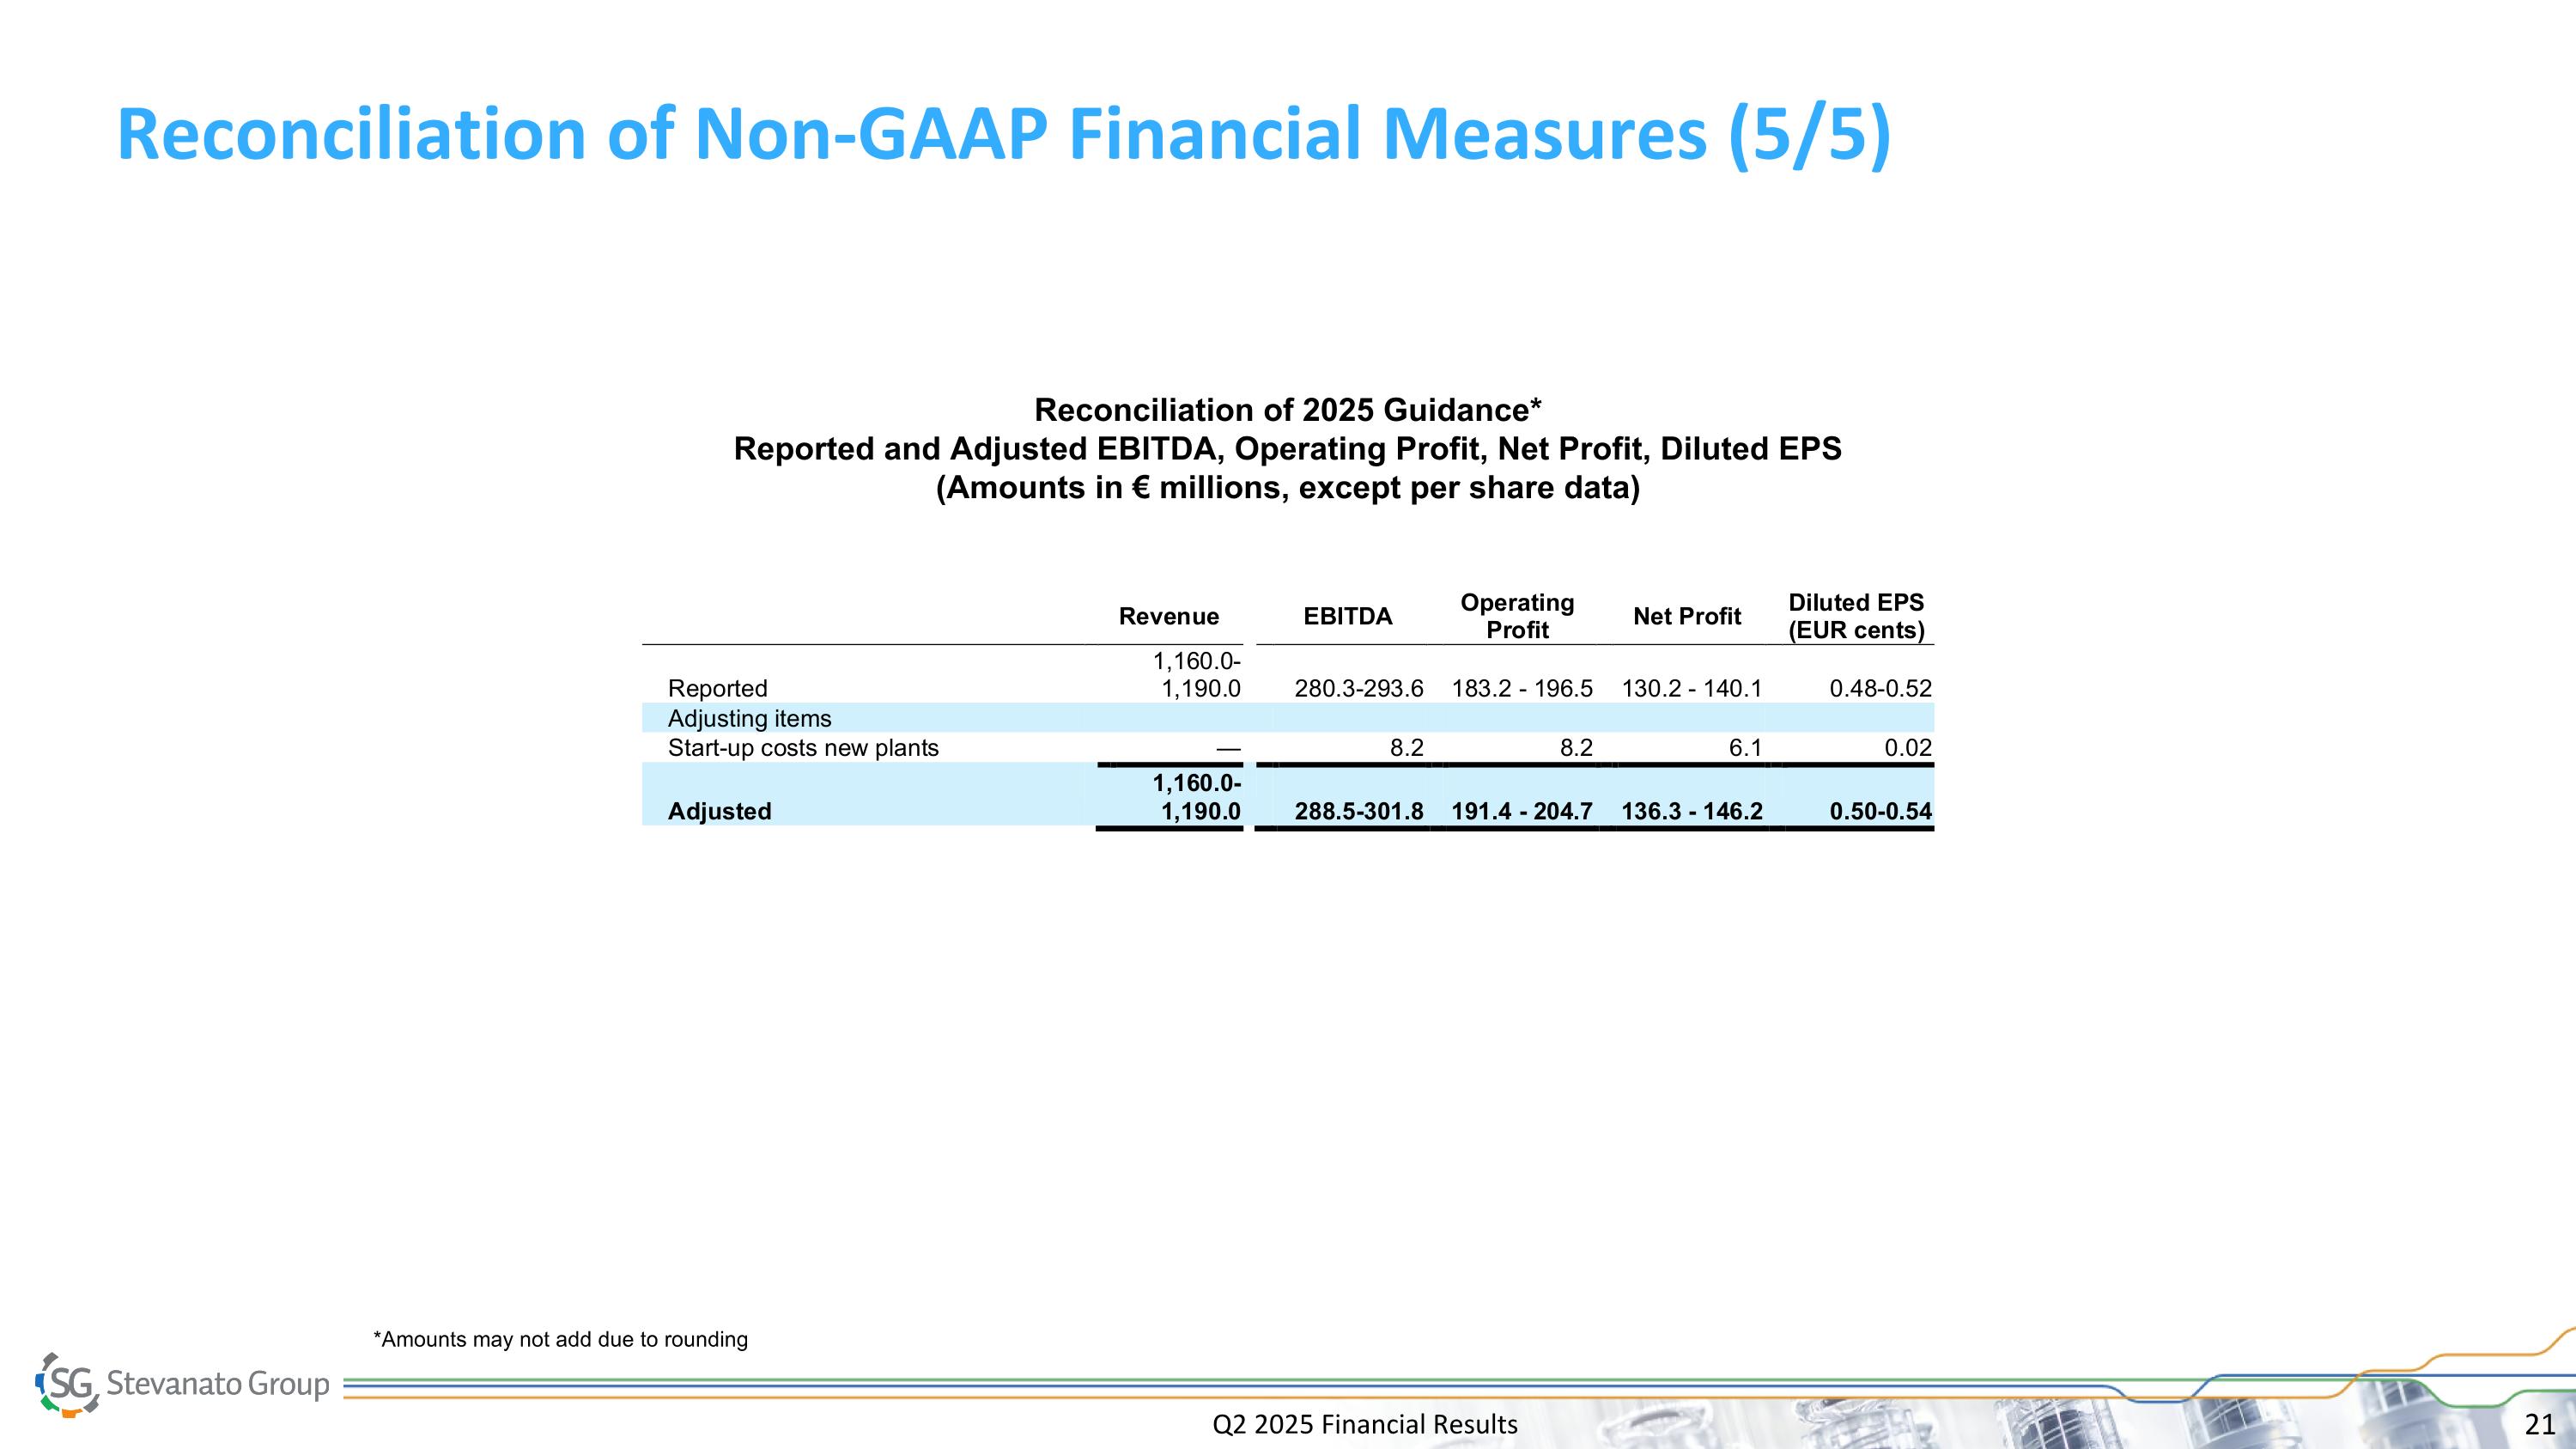
Q2 2025 Financial Results Reconciliation of Non-GAAP Financial Measures (5/5) Reconciliation of 2025 Guidance* Reported and Adjusted EBITDA, Operating Profit, Net Profit, Diluted EPS (Amounts in € millions, except per share data) *Amounts may not add due to rounding