Filed Pursuant to Rule 424(b)(4)
Registration No. 333-257204
STEVANATO GROUP S.P.A.
32,000,000 ordinary shares
This is an initial public offering of 32,000,000 ordinary shares without par value in the capital of Stevanato Group S.p.A. (Shares) by Stevanato Group S.p.A. We are offering 22,400,000 ordinary shares. The selling shareholder identified in this prospectus is offering an additional 9,600,000 ordinary shares.
The initial public offering price is $21.00 per share. Prior to this offering, there has been no public market in the United States, or the U.S., for our Shares. Our ordinary shares have been approved for listing on the New York Stock Exchange (NYSE) under the ticker STVN. We believe that upon completion of the offering contemplated by this prospectus, we will meet the standards for listing on the NYSEs main exchange.
We have two classes of shares, ordinary shares and class A multiple voting shares (the Class A shares, including 30,840,555 Class A shares held in treasury). Following the completion of this offering, Stevanato Holding S.r.l. will beneficially own 230,901,960 of our issued Class A shares. Holders of ordinary shares will be entitled to one vote per share, while holders of Class A shares will be entitled to three votes per share. Upon any sale, transfer, assignment or disposition of any Class A shares by a holder thereof to a non-affiliate of such holder, each of such Class A shares will be automatically and immediately converted into one ordinary share.
Following the completion of this offering, we will be a controlled company within the meaning of the corporate governance rules of the NYSE because Stevanato Holding S.r.l. will beneficially own 95.44% of the total voting power of our then outstanding share capital (excluding 30,840,555 Class A shares held in treasury which voting power is suspended as long as such shares are held in treasury), assuming the underwriters do not exercise their over-allotment option, or 94.78% of the total voting power of our then outstanding share capital if the underwriters exercise their over-allotment option in full. See Principal and Selling Shareholder beginning on page 130.
We are both an emerging growth company and a foreign private issuer as defined under U.S. federal securities laws and as such, will be eligible for reduced public company reporting requirements for this prospectus and future filings.
Investing in our shares involves risks. See Risk Factors beginning on page 21.
Neither the United States Securities and Exchange Commission nor any other regulatory body has approved or disapproved of these securities, or determined if this prospectus is truthful or complete. Any representation to the contrary is a criminal offense.
PRICE US$21.00 per Share
Price to Public |
Underwriting |
Proceeds to us |
Proceeds
to |
|||||||||||||
Per ordinary share |
$21.00 | $0.89 | $20.11 | $20.11 | ||||||||||||
Total |
$672,000,000 | $28,560,000 | $450,408,000 | $193,032,000 |
(1) | See the section entitled Underwriting for additional disclosure regarding underwriting compensation payable by us. |
To the extent that the underwriters sell more than 32,000,000 of our ordinary shares, we and the selling shareholder have granted the underwriters the right to purchase up to an additional 4,800,000 ordinary shares at the same price as the ordinary shares offered through this prospectus, for 30 days after the date of this prospectus.
The underwriters expect to deliver the ordinary shares against payment in U.S. dollars in New York, New York on or about July 20 , 2021.
MORGAN STANLEY | BofA SECURITIES | JEFFERIES |
CITIGROUP | UBS INVESTMENT BANK |
KEYBANC CAPITAL MARKETS | WELLS FARGO SECURITIES |
WILLIAM BLAIR |
Prospectus dated July 15, 2021.
You should rely only on the information contained in this prospectus and any related free-writing prospectus that we authorize to be distributed to you. We and the underwriters have not authorized any person to provide you with information different from that contained in this prospectus or any related free-writing prospectus authorized to be distributed to you. This prospectus is not an offer to sell, nor is it seeking an offer to buy, Shares in any state or other jurisdiction where such offer or sale is not permitted. The information in this prospectus speaks only as of the date of this prospectus unless the information specifically indicates that another date applies, regardless of the time of delivery of this prospectus or of any sale of the securities offered hereby.
Neither we nor any of the underwriters has done anything that would permit this offering or possession or distribution of this prospectus, or any filed free writing prospectus, in any jurisdiction other than in the United States. Persons outside the United States who come into possession of this prospectus or any filed free writing prospectus must inform themselves about, and observe any restrictions relating to, the offering of the Shares and the distribution of this prospectus or any filed free writing prospectus outside of the United States.
We are incorporated in Italy, and a majority of our outstanding securities are owned by non-U.S. residents. Under the rules of the U.S. Securities and Exchange Commission (SEC), we are currently eligible for treatment as a foreign private issuer. As a foreign private issuer, we will not be required to file periodic reports and financial statements with the SEC as frequently or as promptly as domestic registrants whose securities are registered under the Securities Exchange Act of 1934, as amended (the Exchange Act).
We are responsible for the information contained in this prospectus. Neither we, the Selling Shareholder nor the underwriters have authorized anyone to provide you with different information, and neither we, the Selling Shareholder nor the underwriters take responsibility for any other information others may give you. We, the Selling Shareholder and the underwriters are not making an offer to sell, or seeking offers to buy, these securities in any jurisdiction where the offer or sale is not permitted. You should not assume that the information contained in this prospectus is accurate as of any date other than its date regardless of the time of delivery of this prospectus or of any sale of the Shares.
i
NOTE ON THE PRESENTATION OF INFORMATION
Throughout this registration statement, unless the context otherwise requires, references to Stevanato Group S.p.A., Stevanato, the Company, we, us, Group, our and words of similar import refer to Stevanato Group S.p.A. and its consolidated subsidiaries.
Unless otherwise indicated, all references to , EUR and Euro in this annual report are to, and amounts are presented in, euros. All references to US$ and $ are to U.S. dollars. For the convenience of the reader, we have translated certain financial information into U.S. dollars. Unless otherwise indicated, these translations were made at the rate of $1.00 to 0.8375, the noon buying rate of the Federal Reserve Bank of New York on June 25, 2021. Such U.S. dollar amounts are not necessarily indicative of the amounts of U.S. dollars that could actually have been purchased upon exchange of Euros at the dates indicated.
Financial Statements
We present in this prospectus the audited consolidated financial statements as of December 31, 2019 and 2020, as well as the unaudited interim condensed consolidated financial statements for the three months ended March 31, 2020 and 2021. These financial statements were prepared in accordance with International Financial Reporting Standards, or IFRS, as issued by the International Accounting Standards Board, or IASB.
All references herein to our financial statements, our audited consolidated financial information, our audited consolidated financial statements, our unaudited interim condensed consolidated financial information and our unaudited interim condensed consolidated financial statements, are to Stevanato Groups consolidated financial statements included elsewhere in this prospectus.
This financial information should be read in conjunction with Managements Discussion and Analysis of Financial Condition and Results of Operations, our audited consolidated financial statements and unaudited interim condensed consolidated financial statements, including the notes thereto, included elsewhere in this prospectus.
Following this offering, we will begin reporting consolidated financial information to shareholders. We maintain our books and records in euro and our financial statements will be prepared in accordance with IFRS, as issued by the IASB.
Our fiscal year ends on December 31. References in this prospectus to a fiscal year, such as fiscal year 2020, relate to our fiscal year ended on December 31 of that calendar year.
As of the date of this prospectus, our authorized share capital is 20,002,000.00 divided into 272,427,240 shares without par value, including 1,084,724 ordinary shares and 271,342,515 Class A shares. On March 4, 2021, the shareholders meeting approved a share split following which the then existing 20,002 shares have been split into a total of 100,010,000 ordinary shares with no par value, without changing the amount of the share capital. On July 1, 2021 the shareholders meeting approved a further share split following which all the existing 100,010,000 shares have been split into a total of 272,427,240 shares in the ratio of 2,724 new shares post-split for each share outstanding prior to the share split. In connection with the split that occurred on July 1, 2021, all of the ordinary shares held by the Selling Shareholder and the ordinary shares held in treasury were converted into Class A shares.
Special Note Regarding Non-GAAP Financial Measures
This prospectus presents our EBITDA, Adjusted EBITDA, Adjusted EBITDA Margin, Adjusted Operating Profit, Adjusted Operating Profit Margin, CAPEX and Free Cash Flow, which are non-GAAP financial measures, and their reconciliations to the nearest measure as defined by IFRS, for the convenience of investors.
ii
EBITDA is defined as net profit before income tax expenses, net financial expenses, including share of profit of associates, amortization and depreciation. Adjusted EBITDA is defined as EBITDA as adjusted for certain income and costs expected to occur infrequently, and that management considers not reflective of ongoing operational activities of the company. EBITDA is presented to aid management in their analysis of the performance of the Group and to assist in the comparison of our performance with that of our competitors. Adjusted EBITDA is provided in order to present how the underlying business has performed excluding the impact of certain non-recurring items, which may alter the underlying performance and impair comparability of results between periods. Adjusted EBITDA margin is calculated by dividing Adjusted EBITDA for a period by total revenue for the same period.
Adjusted Operating Profit represents Operating Profit as adjusted for certain income and costs expected to occur infrequently, and that management considers not reflective of ongoing operational activities. Adjusted Operating Profit is provided in order to present how the underlying business has performed excluding the impact of the adjusting items, which may alter the underlying performance and impair comparability of results between the periods. Adjusted Operating Profit Margin is calculated by dividing Adjusted Operating Profit for a period by total revenue for the same period.
Capital expenditure, or CAPEX, is the sum of investment amounts on tangible fixed assets and intangible assets during the period (excluding right-of-use assets recognized during the period in accordance with IFRS 16Leases). These investment activities consist of acquisitions of property and equipment and intangible assets.
Free Cash Flow is defined as cash flows from operating activities excluding interests paid and received, less investments in property, plant and equipment and intangible assets on a paid-out cash basis.
Management uses EBITDA, Adjusted EBITDA, Adjusted EBITDA Margin, Adjusted Operating Profit, Adjusted Operating Profit Margin, CAPEX and Free Cash Flow to monitor the underlying performance of the business and its operations. These measures are used by different companies for differing purposes and are often calculated in ways that reflect the circumstances of those companies. You should exercise caution in comparing these measures as reported by us to the same or similar measures as reported by other companies. These non-GAAP financial measures may not be comparable to similarly titled metrics of other companies.
EBITDA, Adjusted EBITDA, Adjusted EBITDA Margin, Adjusted Operating Profit, Adjusted Operating Profit Margin, CAPEX and Free Cash Flow are not measurements of performance under IFRS or any other generally accepted accounting principles, and you should not consider them as an alternative to loss for the period, operating loss or other financial measures determined in accordance with IFRS. These measures have limitations as analytical tools, and you should not consider them in isolation. See Summary Consolidated Financial DataNon-GAAP Financial Measures for more detail on these limitations of EBITDA, Adjusted EBITDA, Adjusted EBITDA Margin, Adjusted Operating Profit, Adjusted Operating Profit Margin, CAPEX and Free Cash Flow. Accordingly, prospective investors should not place undue reliance on these non-GAAP financial measures contained in this prospectus.
Market Share and Other Information
This prospectus contains data related to economic conditions in the market in which we operate. The information contained in this prospectus concerning economic conditions is based on publicly available information from third-party sources that we believe to be reasonable. Market data and certain industry forecast data used in this prospectus were obtained from internal reports and studies, where appropriate, as well as estimates, market research, publicly available information and industry publications. We obtained the information included in this prospectus relating to the industry in which we operate, as well as the estimates concerning market shares, through internal research, public information and publications on the industry prepared by official public sources.
iii
There are a number of studies that address either specific market segments, or regional markets, within our industry. We have reviewed and analyzed data collected by, among others, IQVIA, Alira Health, Roots Analysis, Markets and Markets Research Pvt Ltd., Grand View Research and Evaluate MedTech and Global Data UK Ltd (Global Data). However, given the rapid changes in our industry and the markets in which we operate, no industry research that is generally available covers all of the trends we view as key to understanding our industry and our place in it as providers of drug containment, drug delivery and diagnostic solutions for the pharmaceutical, biotechnology and life sciences industries.
Due to the evolving nature of our industry and competitors, we believe that it is difficult for any market participant, including us, to provide precise data on the market or our industry. However, we believe that the market and industry data we present in this prospectus provide accurate estimates of the market and our place in it. Forecasts and other forward-looking information obtained from these sources are subject to the same qualifications and uncertainties as other forward-looking statements in this prospectus. We have no reason to believe any of this information or these reports are inaccurate in any material respect and believe and act as if they are reliable. In addition, the data that we compile internally and our estimates have not been verified by an independent source. None of the publications, reports or other published industry sources referred to in this prospectus were commissioned by us or prepared at our request. Except as disclosed in this prospectus, we have not sought or obtained the consent of any of these sources to include such market data in this prospectus.
Rounding
We have made rounding adjustments to some of the figures included in this prospectus. Accordingly, numerical figures shown as totals in some tables may not be an arithmetic aggregation of the figures that preceded them.
Trademarks, Service Marks and Trade Names
We have proprietary rights to trademarks used in this prospectus that are important to our business, many of which are registered under applicable intellectual property laws. Solely for convenience, the trademarks, service marks, logos and trade names referred to in this prospectus are without the ® and symbols, but such references are not intended to indicate, in any way, that we will not assert, to the fullest extent under applicable law, our rights or the rights of the applicable licensors to these trademarks, service marks and trade names. This prospectus contains additional trademarks, service marks and trade names of others, which are the property of their respective owners. All trademarks, service marks and trade names appearing in this prospectus are, to our knowledge, the property of their respective owners. We do not intend our use or display of other companies trademarks, service marks, copyrights or trade names to imply a relationship with, or endorsement or sponsorship of us by, any other companies.
iv
The following summary is qualified in its entirety by, and should be read in conjunction with, the more detailed information and financial statements appearing elsewhere in this prospectus. In addition to this summary, we urge you to read the entire prospectus carefully before deciding whether to buy our Shares. You should carefully consider, among other things, our financial statements and the related notes and sections entitled Risk Factors, Business, and Managements Discussion and Analysis of Financial Condition and Results of Operations included elsewhere in this prospectus.
STEVANATO GROUP
Overview
We are a leading global provider of drug containment, drug delivery and diagnostic solutions to the pharmaceutical, biotechnology and life sciences industries. We deliver an integrated, end-to-end portfolio of products, processes and services that address customer needs across the entire drug life cycle at each of the development, clinical and commercial stages. Our core capabilities in scientific research and development, our commitment to technical innovation and our engineering excellence are central to our ability to offer value added solutions to our clients.
We have secured a leadership position within the drug development and delivery value chain through our investment in research and development and the expansion of our global footprint and capabilities. Over our 70-year history, we have earned a leading reputation for high quality and reliability that has enabled us to become a partner of choice for more than 700 companies globally, including 41 of the top 50 pharmaceutical companies (which comprise all of the top 15), and eight of the top ten in-vitro diagnostic companies, as measured by 2020 revenue, according to data collected by Global Data. We also serve 15 of the top 20 biotechnology companies by market capitalization in the NASDAQ Biotechnology Index and over 100 biotechnology customers in total.
Our priority is to provide flexible solutions that preserve the integrity of pharmaceutical products and enable our customers to deliver safe and effective treatments to patients while reducing time to market, total cost of ownership (i.e., logistics, drug product waste, storage and personnel costs) and supply chain risk. We achieve this by developing our products in close collaboration with our customers, leveraging our scientific research capabilities, technical expertise and engineering and manufacturing excellence to meet their quality requirements.
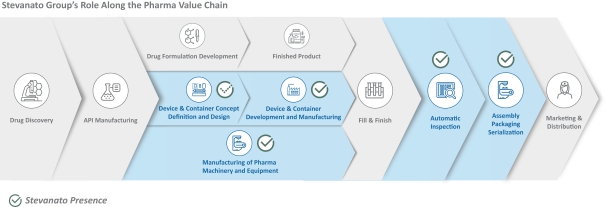
Our solutions are highly integrated with the development, production and commercialization processes of our customers. In addition to manufacturing drug containment and delivery solutions, we provide a full set of services across all stages of drug development, from pre-clinical to clinical stage and commercialization. We also engineer machinery and equipment for the production of drug containment and delivery systems that can be integrated into both our customers and our own manufacturing processes. Our involvement at each stage of a drugs life cycle, together with the breadth of our offering, enables us to serve as a one-stop-shop for our customers, which we believe represents a significant competitive advantage.
We operate across the healthcare industry and serve some of its fastest growing market segments, including biologics, biosimilars, vaccines and molecular diagnostics. As a result of how closely integrated we are in the drug production and delivery supply chain, we are well-positioned to benefit from secular trends within our target industries, such as increases in demand resulting from pharmaceutical innovation, acceleration and expansion of vaccination programs, growth in biologics/biosimilars, self-administration of medicines, aging demographics and increasing quality standards and regulation.
We estimate that our total addressable market, based on our current offering, exceeds $11 billion, in terms of revenue generated by all market participants in 2020, and consists of biopharmaceutical injectables and
1
in-vitro diagnostic products. Within each of these markets, we operate in some of the fastest growing segments, including pre-fillable syringes, drug delivery systems, molecular diagnostics and assembly equipment. We believe there are opportunities to further expand our addressable markets, including by targeting (i) complementary containment solutions, (ii) additional delivery systems, (iii) complementary engineering solutions and (iv) aftersales support and services. For more information on our addressable market, see BusinessOur Industry and Growing End Market.
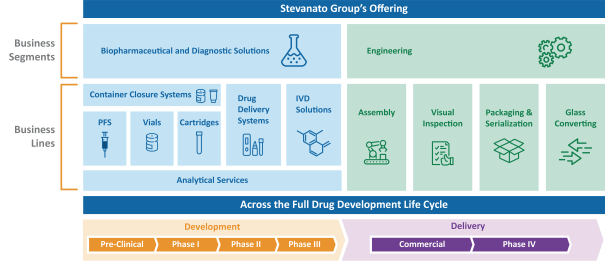
We operate our business in two segments:
| Biopharmaceutical and Diagnostic Solutions, which includes all the products, processes and services developed and provided for the containment and delivery of pharmaceutical and biotechnology drugs and reagents, as well as the production of diagnostic consumables; and |
| Engineering, which includes all of the equipment and technologies developed and provided to support the end-to-end pharmaceutical, biotechnology and diagnostic manufacturing processes (assembly, visual inspection, packaging and serialization and glass converting). |
In 2020, we generated approximately 85% of our total revenue from our Biopharmaceutical and Diagnostic Solutions segment with the remaining approximately 15% from our Engineering segment.
We refer to premium products in the Biopharmaceutical and Diagnostic Solutions segment as our high-value solutions. High-value solutions are wholly owned, internally developed products, processes and services for which we hold intellectual property rights or have strong proprietary know-how, and that are characterized by particular complexity and high performance. Our high-value solutions deliver significant benefits to customers in terms of time-to-market and reduced total cost of ownership. Among our key high-value solutions is our EZ-Fill® line of ready-to-fill injectable products, which can be customized to clients needs. For additional information on EZ-Fill® see BusinessBusiness SegmentsBiopharmaceutical and Diagnostic SolutionsContainer Closure Systems (CCS).
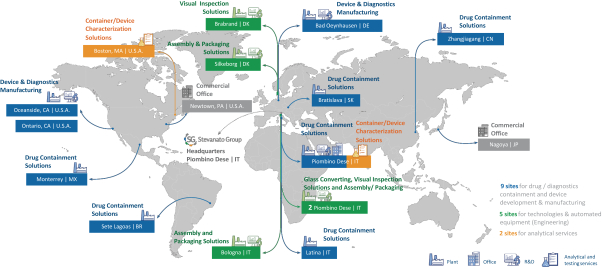
We have nine production plants for manufacturing and assembling pharmaceutical and healthcare products across Europe (Italy, Germany and Slovakia) and the rest of the world (Brazil, China, Mexico and the United States), five plants for the production of machinery and equipment (Italy and Denmark), two sites for analytical services (Italy and the United States) and two commercial offices (Japan and the United States). Our manufacturing facilities in Mexico (serving the U.S. market), China and Brazil all represent greenfield
2
operations established by us. Our manufacturing facilities in Slovakia, Denmark, Germany and the United States were acquired in strategic transactions over the past 15 years. Our global footprint, together with our proprietary, highly standardized manufacturing systems and processes, allow us to provide quality consistent products and services to our customers in more than 70 countries.
Since the outbreak of COVID-19, we have increased production capacity to support our customers efforts to provide a rapid response to COVID-19. In this context, we have been providing: (i) glass vials and syringes to approximately 90% of currently marketed vaccine programs, according to our estimates based on public information (WHO, EMA, FDA); (ii) diagnostic solutions for the detection and diagnosis of COVID-19; (iii) glass forming lines, which are being installed worldwide, to facilitate the distribution of glass bulks and sterile vials and syringes; and (iv) visual inspection systems. COVID-19 has generated increased demand for our products and services, further enabling us to accelerate our growth strategy.
Our Competitive Strengths
The following are our key competitive strengths:
Leading global provider of mission-critical containment, delivery and diagnostic solutions for the pharmaceutical, biotechnology and life sciences industries
We are a recognized leader in providing mission-critical containment, delivery and diagnostic solutions to the pharmaceutical, biotechnology and life sciences industries. We operate on a global scale, offering our products, processes and services in more than 70 countries. We serve a large and diversified customer base, including many of the worlds largest pharmaceutical, biotechnology and diagnostics companies, contract manufacturers and producers of glass packaging. Our customer base comprises more than 700 companies globally, including 41 of the top 50 pharmaceutical companies (which comprise all of the top 15) and eight of the top ten in-vitro diagnostic companies, as measured by 2020 revenue according to data collected by Global Data. We also serve 15 of the top 20 biotechnology companies by market capitalization in the NASDAQ Biotechnology Index and over 100 biotechnology customers in total.
As a partner of choice to the pharmaceutical and biotechnology industries, our solutions have been widely adopted, giving us a leading position in several high growth segments of the pharmaceutical and biotechnology injectables market, including in biologics, biosimilars and vaccines. Within each of these markets, we operate in some of the fastest growing segments, where, based on available market data, we believe we are a global top three player by revenues, including number two in pre-fillable syringes, number one in pre-sterilized EZ-Fill® vials and number one in pen cartridges.
Integrated end-to-end platform spans the drug lifecycle, from design and development through commercialization
We offer solutions to our clients at each stage of the drug development process, from research and development, through clinical trials and commercialization. Our fully integrated, end-to-end value proposition allows us to reduce lead time, total cost of ownership (i.e., logistics, drug product waste, storage and personnel costs) and supply chain risk for our customers, while improving the reliability and safety of drug products.
The breadth of our integrated capabilities differentiates us from our competitors as we believe we are the only player in the industry to be active in both the drug containment, delivery and diagnostic solutions as well as engineering segments. The extensive scope of solutions that we offer makes us an attractive partner to both small, emerging businesses, which may look to outsource a portion of their manufacturing process, as well as to mature, commercial stage drug development organizations that require complex engineering solutions
3
that can be integrated into their own production processes. By partnering with customers in the early development phase, we are in a prime position to play a key role as they add products to their pipelines and seek more advanced technical solutions. Our ability to seamlessly integrate our drug containment and delivery solutions with our engineering capabilities allows us to deliver significant value to our customers over time.
A common operating model in all our manufacturing facilities to uphold one consistent quality standard worldwide
Our manufacturing approach is based on the relentless pursuit of maximum efficiency and highest quality. Our manufacturing methods and processes are standardized as we utilize the same technology and adopt a common quality control approach across all of our production facilities. This allows us to provide consistent products, processes and services, both in terms of quality and time to market, to all of our customers from each of our manufacturing locations worldwide. It also gives us the flexibility, where needed, to distribute and balance production across our facilities (provided the facilities are validated by our customers), reducing waste and maximizing our efficiency as a group. Many of our customers access our products and services through a number of our facilities globally.
As a result of our commitment to manufacturing excellence and the breadth of our footprint, our customers view us as a functional extension of their operations. We are subject to rigorous audits by certification bodies and our customers, who perform more than 100 audits a year (other than 2020 which was affected by COVID-19 restrictions) on our manufacturing facilities. Further, given our reputation for reliability and our ability to establish new manufacturing facilities with the same standards as our existing ones anywhere in the world, our customers often coordinate with us to support their geographic expansion strategy by building out greenfield manufacturing facilities. This, in turn, provides us access to customers and allows us to further secure our long-term relationships with them.
Highly collaborative approach resulting in deeper strategic partnerships with clients and leading to high customer retention
We approach every customer relationship with the goal of partnering and adding value over a long time horizon, leveraging our technical expertise and our ability to collect analytical data to fully understand our customers objectives, needs and limitations. Drug containment and delivery solutions in particular are often borne out of years of collective effort with customers to develop the optimal manner of containing and delivering a drug product to patients. The customized solutions we provide vary depending on the characteristics and chemical composition of the pharmaceutical products, logistical needs (for example, ease of transport and shelf-life), patient community to which the drug product is primarily addressed (including, potentially, its geographic location) and specific regulatory requirements. The containment and delivery solutions that we provide are an integral part of the drug product itself and are included as part of the regulatory filings required to approve drug product marketing and commercialization. Providing high-quality products with specificity, sensitivity and consistency, coupled with extensive product validation data are fundamental drivers of customer loyalty. The quality and dependability of our drug containment and delivery solutions are critical to obtaining commercialization and marketing approval from regulatory agencies. As a result, it is often the case that drug product containment and delivery arrangements cannot be changed without amending the regulatory filing with the relevant agency. High switching costs and significant time delays are meaningful deterrents to a change in suppliers, which reinforces customer loyalty and strengthens customer retention. Over the past 10 years we have recorded a customer retention rate of approximately 97%.
Extensive scientific and engineering capabilities enable continuous innovation of proprietary products and processes
During our 70 year history, we have differentiated Stevanato Group by making significant ongoing investments in research and development to build our scientific, technical and engineering capabilities. We
4
believe that customers rely on us because of our technical expertise, as well as our ability to design the best possible processes to meet their needs and the specifications required to effectively contain and deliver their drugs. As the needs of our clients evolve, we drive innovation within our proprietary products and processes to develop specialized or customized solutions. As a result of our investments in internal engineering capabilities, we own the most critical processes behind the products we manufacture and are able to respond faster to customer needs for new or customized products. Our engineering capabilities also allow us to scale up our production rapidly, where required, thereby reducing lead time for commercialization of drugs. Our research and development team comprises more than 100 highly skilled and specialized employees operating in our Italian (Piombino Dese and Milan), German (Bad Oeynhausen) and U.S. (Boston) facilities. We have an active pipeline of more than 50 ongoing R&D projects across all of our business segments. Our targeted investment in innovative products and technologies allows us to capture incremental pipeline opportunities and drive attractive growth, while delivering on our firm-wide commitment to provide the highest quality to customers.
Experienced board and executive leadership team with proven track record of excellence
We are led by an experienced and highly-motivated board of directors and executive leadership team with a proven track record of operational excellence. Our leadership team has consistently achieved results by responding to market developments and by capitalizing on opportunities for organic and inorganic growth. While our founding family continues to support our success and future growth as they have done since inception, we have, over the last several years, added to our board and executive team a number of professionals with decades of experience in the drug containment, delivery and diagnostics industries from all over the world. We believe that this has contributed greatly to our strategy building and execution capabilities by allowing us to gain a broader and more nuanced understanding of the market in which we operate, strengthening our ability to anticipate market trends and stay ahead of our competitors. Our strong corporate culture allows us to continuously expand these perspectives by adding diverse talent with deep knowledge and broad experience to our team.
Our Growth Strategy
Our growth strategy currently focuses on the following areas:
Expand our global market position in primary containment systems
We are determined to pursue attractive, organic growth trends in our core primary container business by investing in additional capacity to meet the growing demands of the expanding pharmaceutical, biotechnology and vaccine markets and continue to transition our customers to high-value solutions. We rely on a unique set of proprietary manufacturing processes to drive product innovations in our primary container business that benefit our customers. For example, EZ-Fill® containers, enable our customers to reduce time to market, lower their overall cost of ownership and reduce supply chain risk. By expanding our development capabilities and manufacturing capacity in North America, Europe and Asia to better serve our customers in our key end markets and support high-value solutions growth, we believe we will be able to continue developing our offering, particularly in biologics, to generate above-market growth and capture market share across our business segments. Our planned expansion also offers our customer base faster response time and supply chain redundancy, reducing risk for just in time manufacturing.
Leverage leadership in primary containment to build market position in drug delivery systems
We see a significant opportunity in the fast-paced evolution of drug delivery systems, especially in connection with biologic based therapies administered by injection. We believe that we can leverage this favorable trend in the drug delivery systems market by investing in further strengthening the integration of our drug containment and delivery capabilities in an effort to have the most compelling value proposition for our customers. In particular, we believe that by increasing the integration of our offering we can attract business from emerging
5
biotechnology customers who have an increasing inclination to outsource the non-core phases of their development and manufacturing processes. We intend to strengthen our design and development capabilities to secure high-value contract development and manufacturing programs for drug delivery devices, also leveraging our positive track-record in the space and our ability to develop proprietary systems.
Accelerate market penetration in life sciences systems
Through focused marketing and business development activities, we intend to accelerate our market penetration in high-value, fast-growing life sciences segments, such as molecular and point-of-care diagnostics. With the increasing tendency of life sciences customers to outsource innovative design, development and assembly of specialized in-vitro diagnostic solutions, we believe that we can leverage our integrated capabilities and our ongoing efforts in design and development of such solutions to secure high-value projects from inception, therefore entering the market at an even earlier stage and capitalizing on new opportunities.
Increase our investments in research & development to address unmet market needs
Through continued investment in our R&D programs, we see opportunities to drive revenue and margin growth through processes that improve the quality and sustainability of our existing products. These investments are targeted at maintaining the stability, potency and purity of our customers products prior to administration. New therapies for diabetes, cancer and auto-immune diseases are based on large, complex molecules that are extremely sensitive to their storage environment. In many cases, our customers finished product formulations are viscous and require drug delivery devices for administration to patients. Our products, such as EZ Fill®, reduce our customers drug containment risks, such as the ones mentioned above. We also see growing interest within our customer base in systems that detect tamper evidence, anti-counterfeiting, inventory track and trace capability, and in the case of devices, smart systems that allow patient data capture.
Easy-to-use, accurate, reliable self-injection systems for complex pharmaceutical and biotechnology products represent a particularly attractive market opportunity. We have built a portfolio of devices for this market that can be used off the shelf or customized to the specific needs of the customer. We also see a growing market need for innovative containment and delivery systems for advanced cell and gene therapies. Effective solutions for these products will require innovative materials and coatings, system design and stability and compatibility testing, all of which are areas of strength for our development teams.
Build on our expertise in manufacturing, assembly and inspection systems for primary containers and complex, multi-component systems
Our market leading expertise in the design and manufacturing of glass converting systems for drug containment offers the opportunity to grow in complex, multi-component systems. Working closely with our customers, we can offer custom designed systems complete with vision inspection technology to assure the highest quality products. The enhanced scalability and flexibility of our assembly and packaging solutions are well suited to match emerging biotechnology customers requirements, such as smaller production batches with higher variability in dosage formats. We see future opportunities to apply these solutions to manufacturing multi-component devices for in vitro diagnostics, including point-of-care and self-injection devices for pharmaceutical and biotechnology.
Leverage our scientific and engineering capabilities across the drug development timeline
We have created an integrated, end-to-end, flexible portfolio of products, processes and services in order to collaborate closely with our customers from the preclinical phase through Phase III testing, regulatory filing and eventual commercialization. We believe that our ability to assist from the early stages of preclinical development is important in pursuing new customers because entering a new relationship at any later stage of the drug development cycle would require significant additional expenditure.
6
Such close collaboration presents us with an opportunity to leverage our scientific and engineering capabilities to strengthen and expand our business relationships. By assisting customers through their production processes, we gain the visibility and knowledge that, combined with our skills and capabilities, allow us to anticipate their emerging needs and intercept new demands. We address these needs by continuing to expand our product offering and making new solutions available. Through close collaboration with our customers, we gain invaluable insight into system requirements and industry trends and challenges, which we re-deploy for our future development projects, or to secure new business. For instance, we intend to pursue new opportunities driven by the trend of biotechnology companies toward outsourcing non-core activities of their business.
Leverage our global geographical presence as a platform to increase our penetration in the North American and Asia Pacific regions
The North American and Asia Pacific (APAC) regions represent significant growth opportunities for our company. Both markets have well established research and manufacturing capabilities for biologic therapies covering both innovator and biosimilar products. We have a small but rapidly growing position in both regions, where we believe we can accelerate our recent growth by further expanding our manufacturing footprint. By providing locally sourced products we can deliver supply chain security, just in time delivery and reliable sourcing in terms of surge capacity to both existing and new customers. For example, our new plant in Indiana (U.S.) will represent a strategic location for us in proximity to key emerging biopharma players, enabling us to access an attractive biotech and vaccine market. We believe that we are well-positioned to expand our footprint and market share in the North American and Asia Pacific regions. In an effort to grant access to treatments and vaccines to a higher portion of their population and, therefore, improve their quality of life, APAC countries are showing a consistently growing demand for biologics and cell and gene therapy solutions, as well as strong inclination towards investment in biosimilars. We believe that our global footprint will allow us to take advantage of these favorable growth trends. We intend to further invest in the North American and APAC regions to increase our market penetration in these regions across the business segments in which we operate. Likewise, our new plant in Zhangjiagang (China) will grant us access to a growing vaccine market. Our efforts and intention to commit to the North American region have also been displayed by our appointment of a senior manager responsible for overseeing and implementing our commercial penetration strategy in this key geographical area.
Selectively pursue acquisitions and technology partnerships to augment and expand our product and service portfolio
We have a proven track record of successfully identifying, completing and integrating newly acquired complementary businesses and technologies. Our extensive knowledge of the competitive landscape and deep understanding of the evolving needs of our customers and end markets enable us to identify actionable opportunities to expand our portfolio. We employ a disciplined process to evaluate the strategic fit and financial prospects of acquisitions using a well-established set of criteria.
History
In 1949, Giovanni Stevanato founded Soffieria Stella, a specialty glass manufacturer, in Venice. Soffieria Stella, the precursor to Stevanato Group, operated until 1959, when Stevanato Group was established in Piombino Dese (Padua). Over the last 70 years, we have evolved from an Italian glassware manufacturer to a leading global provider of integrated solutions for the healthcare industry. Our growth has been driven by the internal development of new containment and delivery solutions as well as strategic acquisitions, enabling us to broaden our offering, our technical know-how and our international footprint.
We began our international expansion in 2005, with the acquisition of Medical Glass, a Slovakia based primary packaging manufacturing company. Subsequently, in 2007 and 2013, we acquired an Italian company, Optrel, and a Danish company, Innoscan. Both specialize in the production of inspection machines. These acquisitions marked our entry into the technology and equipment manufacturing business. In 2016, we pursued
7
further expansion of our offering through the acquisition of: (i) Balda, a company specialized in developing and manufacturing plastic diagnostic consumables, drug delivery systems and medical components, (ii) SVM, a company specialized in the production of high-technology machines and systems for assembly, packaging and serialization of pharmaceutical products and (iii) Medirio, a start-up developing patents and other intellectual property for the wearable injectors business.
In parallel with our acquisition strategy, we regularly review our operations in the context of our organic growth plan. As a result of these ongoing assessments, we have expanded our offering through new departments, new laboratories, new offices and new plants. In 2019, we opened a new building in Piombino Dese (Italy) to increase our syringes production capacity and since 2008, we have opened three greenfield sites in: (i) Monterrey, Mexico in 2008; (ii) Zhangjiagang, China in 2012; and (iii) Sete Lagoas, Brazil in 2017.
Selected Risks
Our business is subject to numerous risks, as is more fully described in the section entitled Risk Factors. You should read these risks before you invest in our shares. We may be unable, for many reasons, including those that are beyond our control, to implement our business strategy. In particular, risks associated with our business include, but are not limited to, the following:
| our product offerings being highly complex, and, if our products do not satisfy applicable quality criteria, specifications and performance standards, we could experience lost sales, delayed or reduced market acceptance of our products, increased costs and damage to our reputation; |
| our need to develop new products and enhance existing products, and to adapt to significant technological and innovative changes and respond to introductions of new products by competitors to remain competitive; |
| our backlog might not accurately predict our future revenue, and we might not realize all or any part of the anticipated revenue reflected in our backlog; |
| our failure to maintain and enhance our brand and reputation may materially and adversely affect our business, results of operations and prospects; |
| our high degree of dependence on our management and employees. Competition for our employees is intense, and we may not be able to attract and retain the highly skilled employees that we need to support our business and our intended future growth; |
| our business, financial condition and results of operations depend upon maintaining our relationships with suppliers and service providers; |
| our business, financial condition and results of operations depend upon the availability and price of high-quality materials and energy supply and our ability to contain production costs; |
| significant interruptions in our operations could harm our business, financial condition and results of operations; |
| as a consequence of the COVID-19 pandemic, sales of syringes and vials to and for vaccination programs globally, and visual inspection systems, increased resulting in a revenue growth acceleration. The demand for such products may shrink, if the need for COVID-19 related solutions declines; |
| our manufacturing facilities are subject to operating hazards which may lead to production curtailments or shutdowns and have an adverse effect on our business, results of operations, financial condition or cash flows; |
| we may face significant competition in implementing our strategies for revenue growth in light of actions taken by our competitors; |
8
| our business may be harmed if our customers discontinue or spend less on research, development, production or other scientific endeavors; |
| the loss of a significant number of customers or a reduction in orders from a significant number of customers could reduce our sales and harm our operating results; |
| our business may suffer if we do not successfully manage our current and potential future growth; |
| we may not successfully identify or integrate acquired businesses or assets into our operations or be able to fully recognize the anticipated benefits of businesses or assets that we acquire; |
| our reputation, ability to do business and results of operations may be impaired by improper conduct by any of our employees, agents or business partners; |
| our global operations are subject to international market risks that may have a material effect on our liquidity, financial condition, results of operations and cash flows; |
| as a multinational corporation, we are exposed to fluctuations in currency exchange rates, which could adversely affect our cash flows and results of operations; |
| the laws and regulations which we are subject to, such as U.S., EU and other anti-corruption laws, trade controls, economic sanctions and similar laws and regulations in the jurisdictions which we operate, are complex and the regulatory and political regimes under which we operate are volatile. Our failure to comply with the relevant laws and regulations could subject us to civil, criminal and administrative penalties and harm our reputation; |
| we are subject to product liability and other claims in the ordinary course of business; |
| our trade secrets may be misappropriated or disclosed, and confidentiality agreements with directors, employees and third parties may not adequately prevent disclosure of trade secrets and protect other proprietary information; |
| if we are unable to obtain and maintain patent protection for our technology, products and potential products, or if the scope of the patent protection obtained is not sufficiently broad, we may not be able to compete effectively in our markets; |
| we depend in part on proprietary technology licensed from others. If we lose our existing licenses or are unable to acquire or license additional proprietary rights from third parties, we may not be able to continue developing our potential products; |
| third parties may assert claims against us alleging infringement, misappropriations or other violations of their patents and proprietary rights, or we may need to become involved in lawsuits to defend or enforce our patents, either of which could result in substantial costs or loss of productivity, delay or prevent the development and commercialization of our products and potential products, or prohibit our use of proprietary technology or sale of products; |
| we may become involved in lawsuits to protect or enforce our intellectual property, which could be expensive, time consuming and unsuccessful and have an adverse effect on the success of our business; |
| obtaining and maintaining our patent protection depends on compliance with various procedural, document submission, fee payment and other requirements imposed by governmental patent agencies, and our patent protection could be reduced or eliminated for non-compliance with these requirements; |
| we enjoy only limited geographical protection with respect to certain patents, and we may not be able to protect our intellectual property rights throughout the world; |
| we may be subject to claims that our employees, consultants, independent contractors or collaborators have wrongfully used or disclosed confidential information of their former employers or other third parties, and we may be subject to claims asserting ownership of what we regard as our own intellectual property; |
| if our trademarks and trade names are not adequately protected, we may not be able to build name recognition in our markets of interest and our business may be adversely affected; |
9
| given the relevance of our activity in the healthcare sector, investments by non-Italian entities in the Company, as well as certain asset disposals by the Company, may be subject to the prior authorization of the Italian government (so called golden powers); |
| the dual class structure of our shares, where each Class A share holds three votes, while an ordinary share only holds one vote, may adversely affect the value and trading market for the Shares causing a lower or more volatile market price for our Shares or adverse publicity or other adverse consequences; |
| our voting control is concentrated. |
Corporate Information
Our principal executive offices are located in Via Molinella 17, 35017 Piombino Dese Padua, Republic of Italy. Our telephone number is +39 049 9318111. Our website address is https://www.stevanatogroup.com/en. The information contained on, or that can be accessed through, our website is not incorporated by reference into this prospectus, and you should not consider any information contained on, or that can be accessed through, our website as part of this prospectus in deciding whether to purchase our ordinary shares. We have appointed a U.S. based head of investor relations to facilitate ongoing, transparent engagement with our shareholders. We do business under the commercial name Stevanato Group or SG. The duration of the company, which can be extended at any time by resolution of the shareholders meeting, is currently until December 31, 2100.
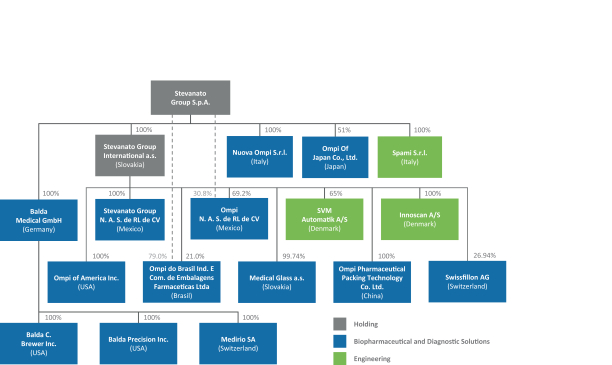
Corporate and Capital Structure
The following diagram illustrates our corporate structure following the completion of this offering:
Enforcement of Civil Liabilities
We are incorporated and currently existing under the laws of the Republic of Italy. In addition, most of our directors and officers reside outside the United States, and most of the assets of our non-U.S. subsidiaries are
10
located outside the United States. As a result, it may be a long and costly process for investors to effect service of process on us or those non-U.S. resident persons in the United States or to enforce in the United States judgments obtained in United States courts against us or those non-U.S. resident persons based on the civil liability or other provisions of the United States securities laws or other laws. It may be possible for investors to effect service of process within other jurisdictions (including Italy) upon us or those non-U.S. resident persons provided that, for example, The Hague Convention on the Service Abroad of Judicial and Extrajudicial Documents in Civil or Commercial Matters of November 15, 1965 is complied with.
Judgments of U.S. courts may be enforceable in Italy. Final enforceable and conclusive judgments rendered by U.S. courts, even if obtained by default, will not require retrial on the merits and will be enforceable in the Republic of Italy, provided that pursuant to article 64 of Italian Law No. 218 of May 31, 1995 (riforma del sistema italiano di diritto internazionale privato), the following conditions are met:
| the U.S. court which rendered the final judgment had jurisdiction according to Italian law principles of jurisdiction; |
| the relevant summons and complaint was appropriately served on the defendants in accordance with U.S. law and during the proceedings the essential rights of the defendants have not been violated; |
| the parties to the proceedings appeared before the court in accordance with U.S. law or, in the event of default by the defendants, the U.S. court declared such default in accordance with U.S. law; |
| the decision is final pursuant to U.S. law; |
| there is no conflicting final judgment previously rendered by an Italian court; |
| there is no pending proceedings before an Italian court between the same parties over the same matter which were instituted before the U.S. proceedings; and |
| the provisions of such judgment would not violate Italian public policy. |
In addition, pursuant to article 67 of Italian Law No. 218 of May 31, 1995, if a judgment rendered by a U.S. court is not complied with, its recognition is challenged or its compulsory enforcement is necessary, then a proceeding shall be initiated before the competent Court of Appeal in Italy to that end. The competent Court of Appeal does not consider the merits of the case but exclusively ascertains the fulfillment of all the conditions set out above.
In original actions brought before Italian courts, the enforceability of liabilities or remedies based solely on the U.S. federal securities law is debatable. If an original action is brought before an Italian court, the Italian court may apply not only Italian rules of civil procedure, but also certain substantive provisions of Italian law that are regarded as mandatory and may refuse to apply the U.S. law provisions or grant some of the remedies sought (e.g., punitive damages) if their application violates Italian public policy and/or any mandatory provisions of Italian law.
Italian shareholders should seek advice from their own counsel based on the applicable circumstances.
Implications of Being an Emerging Growth Company
We qualify as an emerging growth company as defined in the Jumpstart Our Business Startups Act of 2012 (the JOBS Act). An emerging growth company may take advantage, for up to five years, of specified reduced reporting and is exempt from other requirements that are otherwise generally applicable to public companies that are not emerging growth companies. These exemptions include:
| the ability to include only two years of audited financial statements and only two years of related Managements Discussion and Analysis of Financial Condition and Results of Operations disclosure in the registration statement on Form F-1 of which this prospectus is a part; |
11
| not being required to comply with the auditor attestation requirement in the assessment of our internal control over financial reporting pursuant to the Sarbanes-Oxley Act of 2002, as amended (the Sarbanes-Oxley Act), which would otherwise be applicable beginning with our second annual report following consummation of this offering; |
| even if we no longer qualify as an emerging growth company, but remain a foreign private issuer (i) reduced disclosure obligations regarding executive compensation in our periodic reports and proxy statements and (ii) not being required to submit certain executive compensation matters to stockholder advisory votes, including golden parachute compensation; and |
| not being required to comply with any requirement that may be adopted by the Public Company Accounting Oversight Board (PCAOB) regarding mandatory audit firm rotation or a supplement to the auditors report providing additional information about the audit and the financial statements (i.e., an auditor discussion and analysis). |
We may take advantage of these provisions until the last day of our fiscal year following the fifth anniversary of the completion of this offering or such earlier time that we are no longer an emerging growth company. As a result, we do not know if some investors will find our Shares less attractive. The result may be a less active trading market for our Shares, and the price of our Shares may become more volatile.
We will remain an emerging growth company until the earliest of: (i) the last day of the first fiscal year in which our annual gross revenue exceeds $1.07 billion; (ii) the last day of the fiscal year during which the fifth anniversary of the date of this offering occurs; (iii) the date that we become a large accelerated filer as defined in Rule 12b-2 under the Exchange Act, which would occur if the market value of our Shares that are held by non-affiliates exceeds $700 million as of the last business day of our most recently completed second fiscal quarter; and (iv) the date on which we have issued more than $1.00 billion in non-convertible debt securities during any three-year period. We may choose to take advantage of some but not all of these reduced requirements. We have taken advantage of reduced reporting requirements in this prospectus. Accordingly, the information contained herein may be different than the information you receive from other public companies in which you hold equity securities.
Foreign Private Issuer Status
Upon consummation of this offering, we will report under the Securities Exchange Act of 1934, as amended (the Exchange Act), as non-U.S. company with foreign private issuer status. Even after we no longer qualify as an emerging growth company, as long as we qualify as a foreign private issuer under the Exchange Act, we will be exempt from certain provisions of the Exchange Act that are applicable to U.S. domestic public companies, including:
| the rule under the Exchange Act requiring domestic filers to issue financial statements prepared under U.S. GAAP; |
| the sections of the Exchange Act regulating the solicitation of proxies, consents or authorizations in respect of a security registered under the Exchange Act; |
| the sections of the Exchange Act requiring insiders to file public reports of their stock ownership and trading activities and liability for insiders who profit from trades made in a short period of time; and |
| the rules under the Exchange Act requiring the filing with the Securities and Exchange Commission (the SEC) of quarterly reports on Form 10-Q, containing unaudited financial and other specified information, and current reports on Form 8-K, upon the occurrence of specified significant events. |
We will file with the SEC, within four months after the end of each fiscal year, or such applicable time as required by the SEC, an annual report on Form 20-F containing financial statements audited by an independent registered public accounting firm.
12
We may take advantage of these exemptions until such time as we are no longer a foreign private issuer. We would cease to be a foreign private issuer at such time as more than 50% of our outstanding voting securities are held by U.S. residents and any of the following three circumstances applied: (i) the majority of our executive officers or directors are U.S. citizens or residents; (ii) more than 50% of our assets are located in the United States; or (iii) our business is administered principally in the United States.
13
Offering price |
The initial public offering price is $21.00. |
Ordinary shares offered by us |
22,400,000 shares (or 25,760,000 shares if the underwriters exercise their over-allotment option to purchase additional ordinary shares from us in full). |
Ordinary shares offered by the Selling Shareholder |
9,600,000 shares (or 11,040,000 shares if the underwriters exercise their over-allotment option to purchase additional ordinary shares from the Selling Shareholder in full). |
Ordinary shares outstanding immediately after this offering |
33,084,725 shares (or 37,884,725 shares if the underwriters exercise their over-allotment option to purchase additional ordinary shares from us in full). |
Class A shares outstanding immediately after this offering |
261,742,515 shares (or 260,302,515 shares if the underwriters exercise their over-allotment option to purchase additional ordinary shares from us in full). |
Total ordinary shares and Class A shares outstanding immediately after this offering |
294,827,240 shares (or 298,187,240 shares if the underwriters exercise their over-allotment option to purchase additional ordinary shares from us in full). |
Over-allotment option to purchase additional ordinary shares |
We and the Selling Shareholder have granted to the underwriters an option, exercisable within 30 days from the date of this prospectus, to purchase up to additional 3,360,000 ordinary shares from us and up to 1,440,000 additional ordinary shares from the Selling Shareholder. |
Use of proceeds |
We estimate that we will receive net proceeds of approximately $439.2 million from this offering, or approximately $506.7 million if the underwriters exercise their over-allotment option to purchase additional shares from us in full, after deducting underwriting discounts and commissions and estimated offering expenses payable by us. |
We intend to use the net proceeds from this offering for general working capital and corporate purposes, including enabling us to satisfy the requirements of our investing activities and working capital needs and ensuring an appropriate level of operating and strategic flexibility. In particular, we plan to use part of the proceeds to further expand our manufacturing facilities in Piombino Dese, Italy, establish new greenfield plants for EZ-Fill® products, with a |
14
strong focus on biologics and vaccines, in Indiana (U.S.) and Zhangjiagang (China) (focusing also on engineering) and pursue strategic acquisitions to broaden our offering, our technical know-how and our international footprint. However, as our business needs continue to evolve, our intended use of proceeds may vary accordingly. See Use of Proceeds for more information. |
We will not receive any of the proceeds from the sale of shares by the Selling Shareholder. |
Dividend policy |
We have not adopted a dividend policy. The amount of any future dividend payments we may make will depend on, among other factors, our strategy, future earnings, financial condition, cash flow, working capital requirements, capital expenditures and applicable provisions of our articles of association. Dividends are approved by our shareholders at an annual general meeting. According to the current articles of association of Stevanato Holdings (our principal shareholder), the directors of such company must exercise their voting powers in such a way as to cause a distribution of at least 10% of our net income to our shareholders each year. Under Italian law, payment of annual dividends by the company is paid out of its distributable profits and available reserves for each relevant year. We have in place a number of financing agreements which include covenants that would restrict our ability, without the prior consent of the lenders, to distribute dividends if certain debt ratios are exceeded. See Dividend Policy for more information. |
Lock-up |
We, our directors and executive officers, our existing shareholders have agreed with the underwriters not to sell, transfer or dispose of any shares or similar securities for a period of 180 days after the date of this prospectus subject to limited exceptions. See Shares Eligible for Future Sale and Underwriting for more information. |
Pre-emptive rights |
New issuance of shares of capital stock, including Shares or other classes of capital stock, are authorized pursuant to a resolution of shareholders at an extraordinary meeting. Pursuant to Italian law, shareholders are entitled to subscribe newly issued shares in proportion to their respective shareholdings. Subject to certain conditions, such pre-emptive rights may be waived or limited by a resolution of the extraordinary shareholders meeting. In such event, the proposal concerning the issuance of new shares must be justified by the board of directors and the relevant subscription price must be determined based on the value of the consolidated net worth of the corporation. External auditors of the corporation must issue an opinion on the fairness of the newly issued shares subscription price. Our shareholders authorized the disapplication of pre-emptive rights for a period of years from the date of the completion of this offering. See Description of Share Capital and Articles of AssociationPreferential Subscription Rights. |
Listing |
Our Shares have been approved for listing on the NYSE under the symbol STVN. |
15
Payment and settlement |
The underwriters expect to deliver the Shares against payment therefor through the facilities of the Transfer Agent on, July 20, 2021. |
Transfer Agent |
Computershare Trust Company, N.A. |
Unless otherwise indicated, all information contained in this prospectus assumes or gives effect to:
| no exercise by the underwriters of their option to purchase additional ordinary shares from us and the Selling Shareholder in this offering; and |
| an initial public offering price of $21.00 per share. |
16
SUMMARY CONSOLIDATED FINANCIAL DATA
Our audited consolidated financial statements and unaudited interim condensed consolidated financial statements are prepared and presented in accordance with IFRS, as issued by the IASB. Our selected income statements and other financial data with respect to the fiscal years ended December 31, 2019 and 2020 and our selected statements of financial position as of December 31, 2019 and 2020 have been derived from our Consolidated Financial Statements included in this registration statement. Our selected income statements and other financial data with respect to the three months ended March 31, 2020 and 2021 and our selected condensed consolidated statement of financial position data as of March 31, 2021 have been derived from our unaudited interim condensed consolidated financial statements included elsewhere in this prospectus and have been prepared on the same basis as the audited consolidated financial statements.
On March 4, 2021, we effected a share split in which the then existing 20,002 ordinary shares split into a total of 100,010,000 ordinary shares with no par value. On July 1, 2021 we effected a share split in which the then existing 100,010,000 ordinary shares split into a total of 272,427,240 ordinary shares in the ratio of 2.724 new ordinary shares post-split for each ordinary share outstanding prior to the share split. In connection with the split that occurred on July 1, 2021, all of the ordinary shares held by the Selling Shareholder and those held into treasury were converted into Class A shares. Unless otherwise indicated, all share and per share data in this prospectus is adjusted to give effect to our share splits and is approximate due to rounding.
Our historical results are not necessarily indicative of results expected for future periods.
The following table should be read in conjunction with the section entitled Managements Discussion and Analysis of Financial Condition and Results of Operations and our Consolidated Financial Statements and notes thereto, which are included herein. Our Consolidated Financial Statements are maintained in euros. We refer you to the notes to our Consolidated Financial Statements for a discussion of the basis on which our Consolidated Financial Statements are prepared.
Consolidated Income Statements
March 31, 2020 |
March 31, 2021 |
December 31, 2019 |
December 31, 2020 |
|||||||||||||
(amounts in millions, except as indicated otherwise) | ||||||||||||||||
Revenues |
136.4 | 192.8 | 536.5 | 662.0 | ||||||||||||
Gross Profit |
39.5 | 65.4 | 138.0 | 194.2 | ||||||||||||
Operating profit |
15.4 | 42.9 | 62.2 | 103.1 | ||||||||||||
Profit before tax |
10.8 | 41.7 | 54.7 | 96.3 | ||||||||||||
Net Profit |
7.2 | 36.6 | 38.7 | 78.6 | ||||||||||||
Net profit per ordinary share: |
||||||||||||||||
Basic earnings per ordinary share (Euro) |
0.03 | 0.15 | 0.16 | 0.33 | ||||||||||||
Diluted earnings per ordinary share (Euro) |
0.03 | 0.15 | 0.16 | 0.33 |
17
Consolidated Statements of Financial Position
March 31, 2021 |
December 31, 2019 |
December 31, 2020 |
||||||||||
(amounts in millions, except as indicated otherwise) | ||||||||||||
Assets |
||||||||||||
Total current assets |
495.0 | 449.6 | 492.8 | |||||||||
Total non-current assets |
484.4 | 432.6 | 475.2 | |||||||||
Total assets |
979.3 | 882.2 | 968.0 | |||||||||
Liabilities and equity |
||||||||||||
Total current liabilities |
308.0 | 262.9 | 316.2 | |||||||||
Total non-current liabilities |
332.7 | 353.8 | 341.7 | |||||||||
Total liabilities |
640.7 | 616.7 | 657.8 | |||||||||
Total equity |
338.7 | 265.4 | 310.1 | |||||||||
Total liabilities and equity |
979.3 | 882.2 | 968.0 |
Consolidated Statements of Cash Flows
March 31, 2020 |
March 31, 2021 |
December 31, 2019 |
December 31, 2020 |
|||||||||||||
(amounts in millions, except as indicated otherwise) | ||||||||||||||||
Profit before tax |
10.8 | 41.7 | 54.7 | 96.3 | ||||||||||||
Cash flow from / (used in) operating activities |
(9.3 | ) | 5.9 | 42.6 | 155.7 | |||||||||||
Cash flow from / (used in) investing activities |
(24.7 | ) | (22.4 | ) | (74.3 | ) | (96.1 | ) | ||||||||
Cash flow from / (used in) financing activities |
3.0 | (19.8 | ) | 42.2 | (26.5 | ) | ||||||||||
Net change in cash and cash equivalents |
(31.0 | ) | (36.4 | ) | 10.4 | 33.1 |
Other financial and operating data
March 31, 2020 |
March 31, 2021 |
December 31, 2019 |
December 31, 2020 |
|||||||||||||
(amounts in millions, except as indicated otherwise) | ||||||||||||||||
EBITDA |
28.0 | 55.9 | 108.4 | 157.2 | ||||||||||||
Backlog |
324.8 | 665.1 | 303.8 | 606.7 |
Non-GAAP Financial Measures
This prospectus presents our EBITDA, Adjusted EBITDA, Adjusted EBITDA Margin, Adjusted Operating Profit, Adjusted Operating Profit Margin, CAPEX and Free Cash Flow, which are non-GAAP financial measures, and their reconciliations to the nearest measure as defined by IFRS, for the convenience of investors.
Management uses EBITDA, Adjusted EBITDA, Adjusted EBITDA Margin, Adjusted Operating Profit, Adjusted Operating Profit Margin, CAPEX and Free Cash Flow to monitor the underlying performance of the business and its operations. These measures are used by different companies for differing purposes and are often calculated in ways that reflect the circumstances of those companies. You should exercise caution in comparing these measures as reported by us to the same or similar measures as reported by other companies. These non-GAAP financial measures may not be comparable to similarly titled metrics of other companies.
EBITDA is defined as net profit before income tax expenses, net financial expenses, including share of profit of associates, amortization and depreciation. Adjusted EBITDA is defined as EBITDA as adjusted for certain income and costs expected to occur infrequently, and that management considers not reflective of ongoing operational activities of the company. EBITDA is presented to aid management in their analysis of the performance of the Group and to assist in the comparison of our performance with that of our competitors.
18
Adjusted EBITDA is provided in order to present how the underlying business has performed excluding the impact of certain non-recurring items, which may alter the underlying performance and impair comparability of results between periods.
The following table sets forth the calculation of EBITDA and Adjusted EBITDA for the three months ended March 31, 2020 and 2021 and the fiscal years ended December 31, 2019 and 2020 and provides a reconciliation of these non-GAAP measures to the most comparable IFRS measure, Net Profit. Adjusted EBITDA margin is calculated by dividing Adjusted EBITDA for a period by total revenue for the same period.
March 31, 2020 |
March 31, 2021 |
December 31, 2019 |
December 31, 2020 |
|||||||||||||
(amounts in millions, except as indicated otherwise) | ||||||||||||||||
Net profit |
7.2 | 36.6 | 38.7 | 78.6 | ||||||||||||
Income Taxes |
3.6 | 5.1 | 16.0 | 17.7 | ||||||||||||
Finance Income |
(5.7 | ) | (2.0 | ) | (8.0 | ) | (14.9 | ) | ||||||||
Finance Expenses |
10.3 | 3.2 | 15.3 | 21.8 | ||||||||||||
Share of Profit of an Associate |
0.0 | 0.0 | 0.2 | (0.1 | ) | |||||||||||
|
|
|
|
|
|
|
|
|||||||||
Operating Profit |
15.4 | 42.9 | 62.2 | 103.1 | ||||||||||||
Depreciation and Amortization |
12.6 | 12.9 | 46.2 | 54.1 | ||||||||||||
|
|
|
|
|
|
|
|
|||||||||
EBITDA |
28.0 | 55.9 | 108.4 | 157.2 | ||||||||||||
Non-recurring items |
0.0 | (0.3 | ) | 0.0 | 3.0 | |||||||||||
|
|
|
|
|
|
|
|
|||||||||
Adjusted EBITDA |
28.0 | 55.6 | 108.4 | 160.2 | ||||||||||||
|
|
|
|
|
|
|
|
|||||||||
Adjusted EBITDA Margin |
20.5 | % | 28.9 | % | 20.2 | % | 24.2 | % | ||||||||
|
|
|
|
|
|
|
|
Adjusted Operating Profit represents Operating Profit as adjusted for certain income and costs expected to occur infrequently, and that management considers not reflective of ongoing operational activities. Adjusted Operating Profit is provided in order to present how the underlying business has performed excluding the impact of the adjusting items, which may alter the underlying performance and impair comparability of results between the periods.
The following table sets forth the calculation of Adjusted Operating Profit for the three months ended March 31, 2020 and 2021 and the fiscal years ended December 31, 2019 and 2020. Adjusted Operating profit margin is calculated by dividing Adjusted Operating Profit for a period by total revenue for the same period.
March 31, 2020 | March 31, 2021 | December 31, 2019 | December 31, 2020 | |||||||||||||
(amounts in millions, except as indicated otherwise) | ||||||||||||||||
Operating Profit |
15.4 | 42.9 | 62.2 | 103.1 | ||||||||||||
Non-recurring items |
0.0 | (0.3 | ) | 0.0 | 3.0 | |||||||||||
|
|
|
|
|
|
|
|
|||||||||
Adjusted Operating Profit |
15.4 | 42.6 | 62.2 | 106.1 | ||||||||||||
|
|
|
|
|
|
|
|
|||||||||
Adjusted Operating Profit Margin |
11.3 | % | 22.1 | % | 11.6 | % | 16.0 | % | ||||||||
|
|
|
|
|
|
|
|
Capital expenditure, or CAPEX, is the sum of investment amounts on tangible fixed assets and intangible assets during the period (excluding right-of-use assets recognized during the period in accordance with IFRS 16Leases). These investment activities consist of acquisitions of property and equipment and intangible assets.
19
The following table sets forth the CAPEX for the three months ended March 31, 2021 and the fiscal years ended December 31, 2019 and 2020.
March 31, 2021 | December 31, 2019 | December 31, 2020 | ||||||||||
(amounts in millions) | ||||||||||||
Addition to Property, plant and equipment |
18.4 | 69.3 | 89.1 | |||||||||
Addition to Intangible Assets |
0.7 | 5.9 | 6.4 | |||||||||
CAPEX |
19.1 | 75.2 | 95.5 |
See Note 17 Intangible Assets and 18 Property, plant and equipment to the Consolidated Financial Statements for additional details.
Free Cash Flow is defined as cash flows from operating activities excluding interests paid and received, less investments in property, plant and equipment and intangible assets on a paid-out cash basis.
The following table sets forth the calculation of Free Cash Flow for the three months ended March 31, 2020 and 2021 and the fiscal years ended December 31,
2019 and 2020.
March 31, 2020 | March 31, 2021 | December 31, 2019 | December 31, 2020 | |||||||||||||
(amounts in millions) | ||||||||||||||||
Cash Flow from Operating Activities |
(9.3 | ) | 5.9 | 42.6 | 155.7 | |||||||||||
Interest paid |
1.2 | 1.1 | 4.7 | 5.4 | ||||||||||||
Interest received |
(0.2 | ) | (0.1 | ) | (0.6 | ) | (0.7 | ) | ||||||||
Purchase of property, plant and equipment |
(24.1 | ) | (21.7 | ) | (68.1 | ) | (89.6 | ) | ||||||||
Purchase of intangible assets |
(0.6 | ) | (0.7 | ) | (5.8 | ) | (6.4 | ) | ||||||||
|
|
|
|
|
|
|
|
|||||||||
Free Cash Flow |
(33.0 | ) | (15.5 | ) | (27.2 | ) | 64.4 | |||||||||
|
|
|
|
|
|
|
|
See Managements Discussion and Analysis of Financial Condition and Results of OperationsKey Indicators of Performance and Financial ConditionNon-GAAP Financial Measures for further information on non-GAAP measures.
20
An investment in our Shares involves a high degree of risk. You should carefully consider the risks and uncertainty described below, together with all of the other information in this prospectus, including Managements Discussion and Analysis of Financial Condition and Results of Operations and our financial statements and related notes, before deciding to invest in our Shares. Additional risks not presently known to us or that we currently deem not material may also impair our business operations. Our business, financial condition or results of operations could be materially and adversely affected by any of these risks. The trading price and value of our Shares could decline due to any of these risks, and you may lose all or part of your investment.
Risks Relating to our Business and Industry
Our product offerings are highly complex, and, if our products do not satisfy applicable quality criteria, specifications and performance standards, we could experience lost sales, delayed or reduced market acceptance of our products, increased costs and damage to our reputation.
Most of our products are highly exacting and complex due to their use for containment and injection of biologic drugs and vaccines. Providing high-quality products that deliver specificity, sensitivity and consistency, together with extensive product validation data is a fundamental driver of customer loyalty and our reputation with life sciences researchers. Our operating results depend on our ability to execute and, when necessary, improve our global quality control systems, including our ability to effectively train and maintain our employees with respect to quality control. A failure of our global quality control systems could result in problems with facility operations or preparation or provision of defective or non-compliant products which could ultimately cause harm to the final user. In each case, such problems could arise for a variety of reasons, including equipment malfunction, failure to follow specific protocols and procedures, problems with critical materials and components, failure by one or more of our suppliers to meet our quality requirements, or environmental factors and damage to, or loss of, manufacturing operations. Such problems could affect production of a particular batch or series of batches of products, requiring the destruction of such products or a halt of facility production altogether. Although we currently hold an insurance policy that covers liabilities for defective products and product recalls in amounts we believe to be adequate for our business, our coverage may not be adequate to insure against all product liability claims that may arise which may be particularly high in case failure of our products to meet the appropriate quality standards cause product recalls or damages to our customers or ultimate users. As a result of this, product defect claims or product recalls may have a material adverse effect on our business, financial condition, results of operations and cash flows.
Our success depends on our customers confidence that we can provide reliable, consistently high-quality products, which also requires us to provide validated data to support our customers use of our products. We believe that customers in our target markets are likely to be particularly sensitive to our products failing to meet the specifications shown on our data sheets. Our reputation and the public perception of our products and technologies may be impaired if our products fail to perform as expected or fail to meet applicable quality criteria, specifications or performance standards. If our products experience, or are perceived to experience, a material defect or error, this could result in loss or delay of sales, damaged reputation, diversion of development resources and increased insurance or warranty costs, any of which could harm our business. These risks are amplified in respect of our new product lines as we implement appropriate quality control criteria. We are reliant to an extent on customer feedback on the quality of our products, and it may take additional time for new products to meet the desired quality standards. Any defects or errors could also result in our inability to timely deliver products to our customers, which could in turn cause disruptions to our customers ability to obtain results, narrowing the scope of the use of our products and ultimately hindering our or their success in relevant markets. Even after any underlying concerns or problems are resolved, any lingering concerns in our target markets regarding our technology, product defects or performance standards could continue to result in lost sales, delayed market acceptance and damaged reputation, among other things. If problems in preparation or
21
manufacture of a product, failure to meet required quality standards for that product or other product defects are not discovered before such product is released to our customers, we may be subject to adverse legal or regulatory actions, including halting of manufacturing and distribution, restrictions on our operations, civil sanctions, including monetary sanctions, and criminal actions. In addition, such problems or failures subject us to other litigation claims, including claims from our customers for reimbursement of the cost of lost or damaged materials. Our customers also require specific information regarding our products and their uses, and any inaccuracies in this information could lead to products being sold for the wrong uses and may result in our having to refund or replace the products in question. Any of the above problems may adversely affect our reputation, business, financial condition and results of operations.
We must develop new products and enhance existing products, adapt to significant technological and innovative changes and respond to introductions of new products by competitors in order to remain competitive.
We sell our products in industries that are characterized by significant technological changes, frequent new product and technology introductions and enhancements and evolving regulatory requirements and industry standards. As a result, our customers needs continue to evolve and our products may be superseded by new technologies (for instance if certain drugs are no longer administered through injectables) or their demand may decline. For instance, as our sales and profitability are largely dependent on the sale of products delivered by injection, if our customers reconfigure their drug product or develop new drug products requiring less frequent dosing, our sales and profitability may suffer. Likewise, if we do not appropriately innovate and invest in new products and technologies, and be open to broadening the scope of our offering, our product offerings may become less desirable in the markets we serve, and, although changing providers is a lengthy process for our customers, they could move to new technologies offered by our competitors, especially if such competitors are able to react more directly and effectively to a customers specific demand. Though we believe customers in our markets display a significant amount of loyalty to a particular product, we also believe that because of the initial time investment required by many of our customers to reach a purchasing decision for a new product, it may be difficult to regain a customer once that customer purchases a product from a competitor.
Moreover, there is a risk that the significant amounts of time and resources (approximately 2.6% of our 2020 revenue) that we invest in research, development and identification of new products would not result in the expected positive results for our business. If we invest our resources into a new product or product enhancement that fails to meet our high quality standards and market expectations or does not perform in the way it was intended, this could adversely affect our business. Our current customers may decide not to purchase these new products or product enhancements and / or purchase a product from a competitor or cease doing business with us altogether. It can take significant time to identify an unmet customer need and develop a product to meet that need, and to the extent we fail to obtain desired levels of market acceptance, our business, financial condition or results of operations could be adversely affected.
Our estimates of our addressable market include several key assumptions based on our industry knowledge, industry publications, third-party research and other surveys, which may be based on a small sample size and may fail to accurately reflect market opportunities. While we believe that our internal assumptions are reasonable, no independent source has verified such assumptions. Industry publications, research, surveys, studies and forecasts generally state that the information they contain has been obtained from sources believed to be reliable. If any of our assumptions or estimates, or these publications, research, surveys or studies prove to be inaccurate, then the actual market for our products may be smaller than we expect, and as a result, our product revenue may be limited and our business, financial condition or results of operations could be adversely affected.
Our backlog might not accurately predict our future revenue, and we might not realize all or any part of the anticipated revenue reflected in our backlog.
Our backlog represents, as of a point in time, estimated future revenue for work not yet completed under (i) specific purchase orders, with regards to our Biopharmaceutical and Diagnostic Solution segment, and (ii) certain one-off agreements, with regards to our Engineering segment. We recognize direct revenue over the life of the
22
contract based on our performance of services under the contract. Contracts may be terminated or delayed by our customers or regulatory authorities for reasons beyond our control. To the extent projects are delayed, the timing of our revenue could be affected. In the event a customer terminates a contract, we are generally entitled to be paid for services rendered through the termination date and for services provided in winding down the project. However, we are generally not entitled to receive the full amount of direct revenue reflected in our backlog in the event of a contract termination. The duration of the projects in our backlog, and the related revenue recognition, ranges from several months to many years For orders that are placed inside a contractual firm period, we generally have a contractual right to payment in the event of cancellation. Fluctuations in our reported backlog levels also result from the timing and order pattern of our customers who often seek to manage their level of inventory on hand. Because of customer ordering patterns, our backlog reported for certain periods may fluctuate and may not be indicative of future results. A number of factors may affect backlog and the direct revenue generated from our backlog, including:
| the size, complexity and duration of projects; and |
| the cancellation or delay of projects. |
Our backlog at March 31, 2021 was 665.1 million compared to 606.7 million as of December 31, 2020 and 303.8 as of December 31, 2019. Although an increase in backlog will generally result in an increase in future direct revenue to be recognized over time (depending on future contract modifications, contract cancellations and other adjustments), an increase in backlog at a particular point in time does not necessarily correspond to an increase in direct revenues during a particular period. The timing and extent to which backlog will result in direct revenue depends on many factors, including the timing of commencement of work, the rate at which we perform services, scope changes, cancellations, delays, receipt of regulatory approvals and the nature, duration, size, complexity and phase of the studies. In addition, delayed projects remain in backlog until they are canceled. As a result of these factors, our backlog is not necessarily a reliable indicator of future direct revenue and we might not realize all or any part of the direct revenue from the authorizations in backlog as of any point in time.
If we fail to maintain and enhance our brand and reputation, our business, results of operations and prospects may be materially and adversely affected.
We believe that maintaining and enhancing our brand and reputation are of significant importance to the success of our business. We work to set a very high standard for the quality of our products and our ethical business practices, and we believe that this has been crucial to our success. We have employed and will continue to employ different types of consumer experience and interaction touchpoints designed to gauge consumer satisfaction with our products, and we also engage in rigorous product validation in order to continue to improve our product quality. We cannot assure you, however, that these activities will be successful or that we will be able to continue to maintain our brand and reputation as we expect. If our brand strength deteriorates, or if our brand is no longer associated with high-quality products, it could lead to fewer publication citations for our products, which could in turn further weaken our brand recognition and reputation. In addition, our competitors may increase the intensity of their consumer interactions or customer feedback processes, which may force us to increase our advertising spend to engage with our customer base and maintain brand and reputational awareness.
In addition, any negative publicity relating to our products or services, regardless of its veracity, could harm our brand and the perception of our brand in the market. With an increasing global focus on ethical business practices and good corporate behavior, and with such issues directly influencing consumer behavior, any failure to achieve or maintain the levels of corporate governance, social and environmental impact and corporate behaviors expected of us, including demonstrating dedication to the benefits of diversity, could negatively impact our brand and reputation. If our brand is harmed, we may not be able to gain new customers or continue to maintain positive relationships with our customers, and our business, prospects, financial condition and results of operations could be materially and adversely affected.
23
Part of our growth strategy is to increase direct customer interactions in multiple countries. Failure to anticipate and react to particular geographic requirements and sensitivities may have a negative impact on our brand and reputation, which may result in a decrease in sales or sales growth in such countries, which may adversely affect our business, prospects, financial condition and results of operations.
We are highly dependent on our management and employees. Competition for our employees is intense, and we may not be able to attract and retain the highly skilled employees that we need to support our business and our intended future growth.
Our success largely depends on the skills, experience and continued efforts of our management, including our Executive Chairman, our Chief Executive Officer and our senior leadership, as well as of our research and development and highly skilled employees. The replacement of certain members of our global leadership team would likely involve the expenditure of significant time and financial resources, and the loss of any such individual may significantly delay or prevent the achievement of our business objectives. Likewise, the members of our research and development team and our highly skilled employees, who our customers and competitors often seek to engage, may be difficult to replace in light of their sophisticated skills and experience and a shortage of such employees could disrupt our operations. As we continue to grow, our success also depends on our ability to attract, motivate and retain highly qualified individuals who will also fit within our culture. Competition for senior management and other personnel in our industry is intense, and the pool of suitable candidates is limited. If qualified personnel become scarce or difficult to attract or retain in our industry for compensation-related or other reasons, we could experience higher labor, recruiting or training costs. Further, new hires may require significant training and time before they achieve full productivity and may not become as productive as we expect. The failure to attract, retain and properly motivate members of our senior management team and other employees, to find suitable replacements for them in the event of death, illness or their desire to pursue other professional opportunities, or to maintain our corporate culture as we continue to grow, could have a negative effect on our operating results.
Our business, financial condition and results of operations depend upon maintaining our relationships with suppliers and service providers.
Our ability to sustain our income has been, and will continue to be, dependent in part on our ability to obtain favorable terms from our suppliers and services providers, including logistics services providers. These terms may change from time to time, and such changes could adversely affect our gross margins over time. In addition, our results of operations and cash flows could be adversely impacted by the acceleration of payment terms to our suppliers and/or the imposition of more restrictive credit terms and other contractual requirements. Further, if for any reason we enter into a contract with a supplier on unfavorable terms, it may harm our ability to negotiate our future contracts with that supplier or with other suppliers.
The loss of one or more of our large suppliers including as a result of consolidation, a material reduction in their supply of products or provision of services to us, extended disruptions or interruptions in their operations or material changes in the terms we obtain from them, could have a material adverse effect on our business, financial condition and results of operations.
Our business, financial condition and results of operations depend upon the availability and price of high-quality materials and energy supply and our ability to contain production costs.
Our operations depend upon our ability to obtain high-quality materials and energy supply at reasonable prices, therefore maintaining low production costs. Our ability to maintain an adequate supply of such materials and energy could be impacted by the availability and price of those materials and energy, the failure to maintain relationships with suppliers and any of such materials being proven to be toxic or otherwise inadequate to be used for the intended purpose. While we may seek to minimize the impact of price increases and potential shortages by, among other things, entering into long-term supply agreements, increasing our own prices and
24
implementing cost-saving measures, our earnings and cash flows could be adversely affected in the event these measures are insufficient to cover our costs. Moreover, while we aim to maintain a large network of product suppliers, we are unable to predict any interruption or disruption in service from our key suppliers, particularly in light of the COVID-19 pandemic. In particular, for some of the materials we use in our production cycles, including glass tubes and DuPont synthetic fiber Tyvek®, we have a limited number of (or a single-source) suppliers worldwide, and selecting new suppliers would be a lengthy and time consuming process. Any interruption or disruption in service from particular suppliers of materials means that interruptions or stoppages in such deliveries could adversely affect our operations until arrangements with alternative suppliers. If this occurs, we could expend substantial resources and time in re-establishing relationships with third-party suppliers that meet the appropriate quality, cost and regulatory requirements needed for commercially viable manufacture of our products. If we are unable to obtain the materials we need at reasonable prices or at all, we may not be able to produce certain of our products at a marketable price or at all. If our supply of materials and components is adversely affected, including as a result of the COVID-19 pandemic, we could damage our relationship with current and prospective customers and our operating results and financial condition could be adversely affected.
Moreover, we are dependent upon the ability of our suppliers to provide materials that meet our quality standards, as well as delivery schedules. Our suppliers failure to provide expected materials that meet such criteria could adversely affect production schedules and contract profitability.
The continued supply of high-quality third-party materials and energy from our suppliers is subject to a number of risks, including:
| the destruction of or damage to our suppliers facilities or their distribution infrastructure; |
| work stoppages or strikes by our suppliers employees; |
| the failure of our suppliers to provide materials of the requisite quality or in compliance with strict specifications; |
| the failure of essential equipment at our suppliers plants; |
| the failure of our suppliers to satisfy import and export control laws for goods that we purchase from them; |
| the failure of our suppliers to meet regulatory standards where applicable; |
| the failure, shortage or delay in the delivery of materials to our suppliers; |
| contractual amendments and disputes with our suppliers; and |
| inability of our suppliers to perform as a result of the weakened global economy, the COVID-19 pandemic or otherwise. |
If we experience problems with suppliers, we may not be able to find acceptable alternatives, and any such alternatives could result in increased costs for us and possible forward losses on certain contracts. Even if acceptable alternatives are found, the process of locating and securing such alternatives might be disruptive to our business, might lead to termination of our supply agreements with our customers and might disrupt the operations of our customers leading to potential claims, any of which could adversely affect our business, financial condition and results of operations.
Significant interruptions in our operations could harm our business, financial condition and results of operations.
Manufacturing, distribution, service and logistics problems can and do arise, particularly in light of the COVID-19 pandemic, and any such problems could have a significant impact on our business, financial condition and results of operations. Accordingly, any significant disruptions to the operations of our
25
manufacturing or distribution centers or logistics providers for any reason, including labor relations issues, power interruptions, severe weather, fire or other circumstances beyond our control could cause our operating expenses to increase without coverage or compensation or seriously harm our ability to fulfill our customers orders or deliver products on a timely basis, or both. Likewise, our ability to meet our customers needs and expectations may be frustrated by delays, issues or interruptions in ramping up new production lines or plants. We must also maintain sufficient production capacity in order to meet anticipated customer demand, which carries fixed costs that we may not be able to offset if orders slow, which would adversely affect our operating margins. If we are unable to manufacture our products consistently, in sufficient quantities and on a timely basis, our sales, gross margins and our other operating results will be materially and adversely affected. Prompt shipment of our products is also very important to our business. If we experience significant delays in our manufacturing, shipping or logistics processes, this could cause disruption to our customers and damage our current and future customer relationships and may adversely affect our business. Such delays may also adversely impact our new product development. For example, if we were to lose one of our sites where new product development is undertaken, we may not be able to transfer or replicate that product development at another site, with the result of lost time and financial costs of developing the new product. We may also use high-risk chemicals in the manufacture of certain of our products, which are subject to handling risks, and any disruption in our ability to source or appropriately store these chemicals could adversely affect our manufacturing operations.
As a consequence of the COVID-19 pandemic, sales of syringes and vials to and for vaccination programs globally, and visual inspection systems, increased resulting in a revenue growth acceleration. The demand for such products may shrink, if the need for COVID-19 related solutions declines.
Despite the initial short-term operational disruption, and the impact that measures established to respond to the COVID-19 pandemic had on our ability to carry out business development activities (which we believe may have had an impact on our ability to broaden our customer portfolio in the short-term), sales of syringes and vials to and for vaccination programs globally, and visual inspection systems, increased resulting in a revenue growth acceleration. We have been supplying: (i) glass vials and syringes to approximately 90% of currently marketed vaccine programs, according to our estimates based on public information (WHO, EMA, FDA); (ii) plastic diagnostic consumables for the detection and diagnosis of COVID-19; (iii) glass forming lines, which are being installed worldwide, to facilitate the distribution of glass bulks and sterile vials and syringes; and (iv) visual inspection systems.
There remains uncertainty around the magnitude of the long-term impact of COVID-19 on demand for our syringes, vials, plastic diagnostic consumables, glass forming lines, visual inspection systems and related products and services, which may shrink rapidly in the future, for instance:
| as the pandemic abates or infection rates decline; |
| as governmental and health authorities relax rules on mandatory COVID-19 testing; |
| as vaccination programs are completed or re-vaccination / booster are not required; or |
| where injectable vaccines are replaced with other vaccines not requiring our products and services. |
A lower rate of increase or a decline in sales of syringes and vials to and for vaccination programs, plastic diagnostic consumables for COVID-19 testing, glass forming lines, visual inspection systems and related products and services could adversely affect our business, financial condition and results of operations.
Our manufacturing facilities are subject to operating hazards which may lead to production curtailments or shutdowns and have an adverse effect on our business, results of operations, financial condition or cash flows.
Certain of our manufacturing processes involve heating glass to extremely high temperatures, forming plastic and operating heavy machinery and equipment, which entail a number of risks and hazards, including
26
industrial accidents, leaks and ruptures, explosions, fires, mechanical failures and environmental hazards, such as spills, storage tank leaks, discharges or releases of toxic or hazardous substances and gases, including into the environment. Any of these events, which are generally more likely to occur as our machines approach time for refurbishment, could lead to requirements for environmental remediation and civil, criminal and administrative sanctions and liabilities. These hazards may cause unplanned business interruptions (also as a consequence of remediation actions), unscheduled downtime, transportation interruptions, personal injury and loss of life, severe damage to or the destruction of property and equipment, environmental contamination and other environmental damage, civil, criminal and administrative sanctions and liabilities and third-party claims, any of which may have a material adverse effect on our business, financial condition, results of operations and cash flows. In addition, under applicable local laws, including Italian law, our directors and officers may be subject to criminal liability, in connection with injuries occurred to our employees, as a result of workplace health and safety violations by reason of their position as employers (posizione di garanzia). Convictions of our directors and officers could negatively impact our reputation. Moreover, due to the long industrial history of our manufacturing facilities and the subsequent lack of detailed information regarding historical waste and chemical storage and disposal, the risk of soil, water or groundwater contamination and related civil, administrative and criminal liabilities cannot be eliminated.
We may face significant competition in implementing our strategies for revenue growth in light of actions taken by our competitors.
In each business segment in which we operate, we face significant competition, with many competitors focusing on specific regions, customers and/or specific product segments. Competitors range from smaller, specialized companies, which may be able to more quickly respond to customers specific needs, to large multinational companies who provide a full suite of products, which may have greater financial, marketing, operational and research and development resources than we do. Such greater resources may allow our competitors to respond more effectively with new, alternative or emerging technologies. Failure to anticipate and respond to our competitors actions may impact our future sales and earnings, in particular failure to react to competitors strengthening their brand, marketing or customer experience may negatively impact our ability to attract and retain customers.
We are pursuing a number of strategies to maintain and improve our revenue growth, including:
| expand our global market position in primary containment systems; |
| leverage leadership in primary containment to build market position in drug delivery systems; |
| accelerate market penetration in life sciences systems; |
| increase our investments in R&D to address unmet market needs; |
| build on our expertise in manufacturing, assembly and inspection systems for primary containers and complex, multi-component systems; |
| leverage our scientific and engineering capabilities across the drug development timeline; |
| leverage our global geographical presence as a platform to increase our penetration in the North American and APAC regions; and |
| selectively pursue acquisitions and technology partnerships to augment and expand our product and service portfolio. |
We may not be able to successfully implement these strategies, and these strategies may not result in the desired growth of our business. Failure to anticipate and respond to our competitors actions may adversely affect our business, financial condition and results of operations.
27
Our business may be harmed if our customers discontinue or spend less on research, development, production or other scientific endeavors.
Our customer base includes leading pharmaceutical, biologic, diagnostic and medical device companies worldwide. Many factors, including public policy spending priorities, available resources and product and economic cycles, have a significant effect on the capital spending policies of these entities. For instance, any change in the international healthcare systems, including the Patient Protection and Affordable Care Act (the PPACA) in the U.S., resulting in a reduced ability of pharmaceutical companies and healthcare providers to receive reimbursements by government authorities, private insurers and other third-party payers for the costs of our products, could result in reduced demand for our products.
Fluctuations in the research and development budgets of our customers could have a significant effect on the demand for our products. Our customers determine their research and development budgets based on several factors, including the need to develop new products, continued availability of governmental and other incentives and funding, competition and the general availability of resources. Any reduction in research and development budgets or a shift of any funding source currently allocated to our business sector to different areas of research, could adversely affect our business, financial condition and results of operations.
The loss of a significant number of customers or a reduction in orders from a significant number of customers could reduce our sales and harm our operating results.
Our operating results could be negatively affected by the loss of revenue from a significant number of our customers. Our sales are fairly well distributed, with 40.6% of our revenues deriving from our top ten customers and no individual customer representing more than 10.0% of revenues in 2020. However, consolidation within our customer base, including, in particular, among pharmaceutical companies, may give larger customers greater bargaining and buying power and operational sophistication, which can enable them to operate with reduced inventories. In addition, consolidation among our customers may lead them to rely on a reduced number of suppliers, with no assurance that they will continue using our products.
We maintain close business relationships with certain customers, working closely to build the specific custom tools they need, which will then become part of our product portfolio. Our operating results could be adversely affected by the loss of a significant number of these customers, particularly during the product development phase.
Our contracts generally do not contain minimum purchase requirements, and a significant portion of our sales are on a purchase order basis. Therefore, our customers are generally not obligated to purchase any fixed quantities of products, and they may stop placing orders with us at any time. If a significant number of customers purchase fewer of our products, defer orders or fail to place additional orders with us for any reason, our sales could decline, and our operating results may not meet our expectations. In addition, if those customers order our products, but fail to pay on time or at all, our liquidity and operating results could be adversely affected.
The level and timing of orders placed by our customers vary for different reasons, including individual customer strategies, the introduction of new technologies, the desire of our customers to reduce their exposure to any single supplier and general economic conditions. If we are unable to anticipate and respond to the demands of our customers, if we have an inadequate supply of products, insufficient capacity in our sites or if we experience any disruptions to our supply chain or distribution network, we may lose customers. Alternatively, we may have excess inventory or excess capacity, and either of these factors may have a material adverse effect on our business, financial condition and results of operations.
Our business may suffer if we do not successfully manage our current and potential future growth.
Over the last 70 years we have consistently expanded our operations and anticipate expanding further as we pursue our long-term growth strategy. The key elements of our growth strategy include, among other things, the
28
expansion of our global market position in primary containment and drug delivery systems, accelerating penetration in life sciences systems, increasing our investments in research and development, building on our expertise in manufacturing, assembly and inspection systems for primary containers and complex, multi-component systems, leveraging our scientific and engineering capabilities, increasing our penetration in the North American and APAC regions and selectively pursuing acquisitions and technology partnerships to augment and expand our product and service portfolio. In particular, we also plan to use part of the proceeds of the Offering to further expand our manufacturing facilities in Piombino Dese (Italy), establish new greenfield plants for EZ-Fill® products, with strong focus on biologics and vaccines, in Indiana (U.S.) and Zhangjiagang (China) (focusing also on engineering) and pursue strategic acquisitions to broaden our offering, our technical know-how and our international footprint. Establishing new production plants for EZ-Fill® products represents a priority in light of the risks associated with our Piombino Dese (Italy) manufacturing facilities currently being the only ones devoted to the production of EZ-Fill® products which, in turn, exposes our business to risks of material disruption should any event affect the operation of such facilities. In general, such growth strategy and in particular the facilities expansion and the external acquisitions increase the complexity of our business and place a significant strain on our management, operations, technical systems, financial resources and internal control over financial reporting functions. Our current and planned personnel, systems, procedures and controls may not be adequate to support and effectively manage our future operations, especially as we employ personnel and maintain manufacturing facilities and distribution networks in several geographic locations.
We are also continuously expanding our product portfolio, and establishing and developing new products require significant management time and attention. If these products do not achieve the anticipated success or require greater levels of time and investment to reach the expected levels, it could adversely affect our business, financial condition and results of operations. Failure to appropriately integrate new products and business lines into our existing operations and systems can also affect the success of these products, and failure to adequately anticipate and plan for this integration could affect the success of these products and may also negatively impact our existing product offerings.
We may not successfully identify or integrate acquired businesses or assets into our operations or be able to fully recognize the anticipated benefits of businesses or assets that we acquire.
We consider acquisitions a useful instrument to complement our organic growth. We opportunistically explore acquiring other businesses and assets, and we have completed 3 acquisitions in the last five years, including: the acquisition of a 65% stake in the Danish SVM Automatik in February 2016, the acquisition of the operating unit of Balda Group in March 2016 and the acquisition of Medirio in May 2016.
However, we may be unable to identify or complete promising acquisitions for many reasons, including any misjudgment of the key elements of an acquisition, competition among buyers, the high valuations of businesses in our industry, the need for regulatory and other approvals, lack of internal resources to successfully pursue all attractive opportunities and availability of capital. When we do identify and complete acquisitions, we may face financial, managerial and operational challenges, including diversion of management attention and resources needed for existing operations, difficulties with integrating acquired businesses, integration of different corporate cultures, increased expenses, potential dilution of our brand, assumption of unknown liabilities, potential disputes with the sellers and the need to evaluate the financial systems of and establish internal controls for acquired entities. Further, we seek out acquisitions of companies that maintain the same high quality standards that we maintain, and if we misjudge or overestimate a companys product quality standards, we may not be able to use these products or implement the strategies that were the primary reason for the acquisition, which would lead to a significant loss both financially and in time spent by our teams trying to integrate the product or implement the strategy. There can be no assurance that we will engage in any additional acquisitions or that we will be able to do so on terms that will result in any expected benefits.
In addition, our ability to realize the benefits we anticipate from our acquisition activities, including any anticipated sales growth, cost synergies and other anticipated benefits, will depend in large part upon whether we
29
are able to integrate such businesses efficiently and effectively. Integration is an ongoing process, and we may not be able to fully integrate such businesses smoothly or successfully, and the process may take longer than expected. Further, the integration of certain operations and the differences in operational culture following such activity will continue to require the dedication of significant management resources, which may distract managements attention from day-to-day business operations.
There may also be unasserted claims or assessments that we failed or were unable to discover or identify in the course of performing due diligence investigations of target businesses. While we normally negotiate representation and warranties and related indemnification in relation to such acquisitions, these may not be enough to cover our exposure if a significant liability arises in connection with any acquisition agreement. We cannot assure you that these indemnification provisions will protect us fully or at all, and as a result we may face unexpected liabilities that could adversely affect our business, financial condition and results of operations.
If we are unable to successfully integrate the operations of acquired businesses into our business, we may be unable to realize the sales growth, cost synergies and other anticipated benefits of such transactions, and our business, results of operations and cash flow could be adversely affected.
Our reputation, ability to do business and results of operations may be impaired by improper conduct by any of our employees, agents or business partners.
We cannot provide assurance that our internal controls and compliance systems will always protect us from acts committed by employees, agents or business partners of ours (including third-party suppliers, distributors or of businesses we acquire or partner with) that would violate U.S. and/or other national laws, including the laws governing payments to government officials, bribery, fraud, kickbacks and false claims, pricing, sales and marketing practices, conflicts of interest, competition, export and import compliance, money laundering and data privacy. In particular, the U.S. Foreign Corrupt Practices Act, the U.K. Bribery Act and similar anti-bribery laws in other jurisdictions generally prohibit companies and their intermediaries from making improper payments for the purpose of obtaining or retaining business. Any improper actions by our employees, suppliers and distributors or allegations of such acts could damage our reputation and subject us to civil or criminal investigations in Italy, under Italian Legislative Decree No. 231 of June 8, 2001 (the Decree 231) pursuant to which a legal entity can be held liable to pay fines in connection with certain criminal offenses committed, inter alia, by its directors, officers or employees, the United States and in other jurisdictions, and any related shareholder lawsuits could lead to substantial civil and criminal, monetary and nonmonetary penalties and could cause us to incur significant legal and investigatory fees. In particular, pursuant to Decree 231, a defense can be established by an entity involved in a Decree 231 investigation, if such entity can prove, among others, that it adopted and properly implemented an organization, management and control model aimed at effectively preventing the commission of the criminal acts involved prior to such unlawful conduct having taken place. We approved and adopted the current version of our organization, management and control model provided by Decree 231 (Model 231) by means of a resolution of the board of directors dated April 7, 2021, and appointed the current supervisory body (the Supervisory Body) that supervises the functioning of and compliance with Model 231, and monitors and assesses the implementation status of preventive measures, with regular reports to the board of directors, in November 2020. The adoption of organization and management models does not by itself exclude applicability of the penalties provided by Decree 231. In fact, upon commission of an offense resulting in administrative liability of the Group pursuant to Decree 231, the court will evaluate the models and their actual implementation. Failure to comply with Decree 231 could result in the imposition of criminal sanctions on our directors and/or monetary sanctions, other types of sanctions (e.g., interdictory sanctions, including prohibitions, confiscation of the price or profits deriving from the crime and publication of the judgment) and loss of confidence of our customer base as well as render us ineligible to participate in a public tender or result in the termination of a public contract already awarded, which could have a material adverse effect on the business, financial condition, results of operations and prospects of the Group.
In addition, a government may seek to hold us liable as a successor for violations committed by companies in which we invest or that we acquire.
30
We also rely on our suppliers to adhere to our supplier standards of conduct, and material violations of such standards of conduct could occur that could have a material effect on our business, reputation, financial condition and results of operations.
Our global operations are subject to international market risks that may have a material effect on our liquidity, financial condition, results of operations and cash flows.
We operate manufacturing facilities in Italy, Slovakia, Denmark, Germany, United States, Mexico, China and Brazil, and sell and distribute our products in more than 70 countries. As part of our business strategy, we will continue to seek to expand our sales and market share in various international markets in which we currently operate and evaluate expansion opportunities into additional international markets. The economies of some of these markets differ from the economies of our core markets factors in Europe and in some cases present new and greater risks. Our financial results and operations are substantially dependent upon macro-economic and political conditions, particularly in Italy, Slovakia, Denmark, Germany, United States, Mexico, China and Brazil, where we operate manufacturing facilities. High levels of sovereign debt in certain countries (including Italy), combined with weak growth, political instability and high unemployment rates, could lead to additional fiscal reforms (including austerity measures), sovereign debt restructurings, currency instability, increased counterparty credit risk, high levels of volatility and, potentially, disruptions in the credit and equity markets, as well as other outcomes, each of which, alone or combined with other factors, could have a material adverse effect on our business, results of operations, access to credit and capital markets and, therefore, our ability to implement our growth strategy.
Macro-economic difficulties and political instability remain particularly evident in Italy. Since January 2012, Italys sovereign debt rating has been downgraded by Standard and Poors, Fitch Ratings and Moodys Investor Service, reflecting their views as to Italys increasing vulnerability to external financing risks and the negative implications these could have for economic growth and public finances as well as fragile market confidence and deterioration in Italys near-term economic outlook. Any further downgrade of the Italian sovereign debt rating could create additional economic uncertainty and negatively impact Italys growth, which could in turn affect consumer confidence, discretionary spending and, consequently, demand for our products.
Furthermore, policies, measures, controls or other actions implemented by the governments of emerging markets or countries which we target for increased sales may restrict our business operations or harm our financial results. As a result, our revenue is exposed to risks inherent to the country where we operate or intend to operate including risks related to differing political, legal, regulatory and economic conditions and regulations.
As a multinational corporation, we are exposed to fluctuations in currency exchange rates, which could adversely affect our cash flows and results of operations.
International markets contribute a substantial portion of our revenue, and we intend to continue expanding our presence globally. The exposure to fluctuations in currency exchange rates takes on different forms. International revenue and costs are subject to the risk that fluctuations in exchange rates could adversely affect our reported revenue and profitability when translated into Euro for financial reporting purposes. These fluctuations could also adversely affect the demand for products and services provided by us. As a multinational corporation, our businesses often invoice third-party customers in currencies other than the one in which they primarily do business (the functional currency), especially U.S. dollars and the Mexican Pesos. Movements in the invoiced currency relative to the functional currency could adversely impact our cash flows and our results of operations. As our international sales grow, exposure to fluctuations in currency exchange rates could have a larger effect on our financial results.
The deterioration of the sovereign debt of several countries, together with the risk of contagion to other, more stable, countries, has exacerbated the global economic crisis. In particular, a deterioration in general economic conditions caused by instability in the Eurozone could have a material adverse effect on our business, financial condition, results of operations and prospects.
31
We are required to comply with a wide variety of laws and regulations and are subject to regulation by various federal, state and foreign agencies.
In all the jurisdictions in which we operate, we are subject to a number of laws, regulations and practices concerning, inter alia, the health and safety of our employees, the use, manufacture and importing of chemicals and the protection of the environment and natural resources.
In the event that the applicable laws and regulations were to change such that our products or our production processes were subject to greater regulatory control or restrictions, it could have a significant impact on our ability to market and sell our products and could require us to spend significant amounts to ensure and monitor compliance with such laws and regulations such that our business, financial condition and results of operations could be adversely affected. For instance, both the EU and the United States are considering to further restrict in the next years the use of ethylene oxide, the main sterilizing agent used in our production processes. If the use of ethylene oxide is further restricted, or completely banned, this would require us to identify new sterilizing agents and would have a negative impact on our financial condition and results of operations.
We are also subject to a variety of federal, state, local and international laws and regulations that govern, among other things, the importation and exportation of products, the handling, transportation and manufacture of substances that could be classified as hazardous, laws governing government contracts and our business practices such as anti-corruption and antitrust laws. Although we believe that we comply in all material respects with applicable laws and regulations, there can be no assurance that a regulatory agency or tribunal would not reach a different conclusion concerning the compliance of our operations with applicable laws and regulations. In addition, there can be no assurance that we will be able to maintain or renew existing permits, licenses or other regulatory approvals or obtain, without significant delay, future permits, licenses or other approvals needed for the operation of our businesses. Furthermore, loss of a permit, license or other approval in any one portion of our business may have indirect consequences in other portions of our business if regulators or customers, for example, cease doing business with such other portion due to fears that such loss is a sign of broader concerns about our ability to deliver products or services of sufficient quality.
Any noncompliance by us with applicable laws and regulations or the failure to maintain, renew or obtain necessary permits and licenses could have an adverse effect on our business, financial condition and results of operations. Failure to comply with these laws and regulations can lead to agency action, including warning letters, product recalls, product seizures, monetary sanctions, injunctions to halt manufacturing or distribution, restrictions on our operations, withdrawal of existing or denial of future approvals, permits or registrations, including those relating to products or facilities and civil and criminal sanctions. To the extent these agencies were to take enforcement action, such action may be made publicly available, and such publicity could harm our ability to sell these regulated products globally and may harm our reputation. In addition, such actions could limit the ability of our customers to obtain regulatory clearance or approval for their products in the United States or abroad and/or our customers may incur significant costs in obtaining or maintaining such regulatory clearances or approvals in the United States or abroad. In addition, any such failure relating to the products we provide exposes us to direct and third-party product liability claims as well as contractual claims from our customers, including claims for reimbursement for lost or damaged products, as well as potential recall liability, which could be significant. Customers may also claim loss of profits due to lost or delayed sales, although our contractual arrangements typically place limits on such claims. There can be no assurance that any such contractual limitation will be applicable or sufficient or fully enforced in any given situation.
Given the relevance of our activities in the healthcare sector, investments by non-Italian entities in the Company, as well as certain asset disposals by the Company, may be subject to the prior authorization of the Italian Government (so called golden powers).
Due to the relevance of our activities in the healthcare sector, it is not possible to exclude the recurrence of the conditions for the exercise, by the Italian Government, of the so called golden powers, aimed at
32
safeguarding the ownership structures of Italian companies operating in strategic sectors, which may adversely impact the liquidity and value of the Shares. The golden power regime, set forth in (i) Law Decree no. 21 of March 15, 2012 (converted into law by Law no. 56 of May 11, 2012), as amended and supplemented (Golden Power Decree), (ii) Law Decree no. 105 of September 21, 2020 (converted into law by Law no. 133 of November 18, 2020), as amended and supplemented, (iii) Law Decree no. 23 of April 8, 2020 (converted into law by Law no. 40 of June 5, 2020), as amended and supplemented, and (iv) Decree of the President of the Council of Ministers no. 179 of December 18, 2020, also cover the healthcare sector. The powers set forth in the Golden Power Decree include, inter alia, the powers to: (i) veto, or impose specific conditions on, the purchase by non-EU companies of shareholdings in companies having assets and relationships in sectors which are considered strategic (e.g., defense and national security, energy, transport and telecommunications, health, etc., the Strategic Companies), and (ii) veto, or impose specific conditions on, the adoption of certain corporate resolutions, acts or transactions by the same companies which may pose a threat to national security.
The Golden Power Decree requires companies to notify the office of the Italian Prime Minister within 10 days of: (i) any purchase by a non-EU entity of a stake in a Strategic Company resulting in the buyer acquiring control of such company pursuant to article 2359 of the Italian Civil Code and of the Italian Financial Act (TUF); and (ii) any resolution, act or transaction adopted by a Strategic Company resulting in a transfer of ownership, control or availability of strategic assets to a non-EU entity. Any resolution, act or transaction adopted by a Strategic Company, whose effect is to change the destination of a strategic asset, or a change in the corporate purpose of the Strategic Company. Furthermore, the regulation requires to notify the dissolution of the company or the amendment of certain provisions of their articles of association. The office of the Italian Prime Minister must exercise its power to veto the transaction or impose conditions within 45 days from the date of notice. In the interim, all rights related to the shares other than economic rights are suspended, and any decision adopted in violation of such suspension is null and void, but once the term has expired the relevant transaction can be completed. Should the office of the Italian Prime Minister veto the transaction, the buyer must sell the acquired shares or quotas within one year. As part of the emergency related to COVID-19, as a result of the Law Decree of April 8, 2020, no 23, these powers have been temporarily strengthened until December 31, 2021 by Law Decree of April 22, 2021 no. 52, converted with amendments by Law of June 17, 2021 no. 87.
The violation of the notification obligation or of the prescriptions imposed by virtue of the exercise of special powers, unless the fact constitutes a criminal offence, is subject to a pecuniary administrative sanction up to double the value of the transaction and in any case not less than one percent of the cumulative turnover achieved by the companies involved in the last financial year for which the financial statements were approved.
As a result, our ability to pursue commercial or industrial strategic resolutions, acts or transactions that involve the acquisition of, or the subscription for, our shares by a partner (or that imply an amendment to our shareholders structure) may be restricted by the Italian Governments decision to exercise its special powers with respect to our business. Therefore, the application of the golden powers regime could have a material adverse effect on our business, results of operations, financial condition or prospects.
Furthermore, in the future, our shareholders ability to enter into change of control or takeover transactions may be impacted by the exercise by the Italian Government of its special powers under the golden power regime. Our shareholders may not be able to transfer their interests or such a transfer may be subject to conditions, which diminish the value of the transaction and discourage investments. This may limit our shareholders ability to benefit from the proceeds of certain proposed asset sales or acquisitions or business combinations, and may limit our shareholders ability to benefit from possible premiums connected to a proposed change of control transaction, tender offer or other strategic transactions.
33
The laws and regulations which we are subject to, such as U.S., EU and other anti-corruption laws, trade controls, economic sanctions and similar laws and regulations in the jurisdictions which we operate, are complex and the regulatory and political regimes under which we operate are volatile. Our failure to comply with the relevant laws and regulations could subject us to civil, criminal and administrative penalties and harm our reputation.
Certain of our operations are subject to U.S., EU and foreign anti-corruption and trade control laws and regulations, such as the Foreign Corrupt Practices Act (the FCPA), export controls and economic sanctions programs, including those administered by the U.S. Treasury Departments Office of Foreign Assets Control (OFAC). As a result of doing business in foreign countries and with foreign partners, we may be exposed to a heightened risk of violating anti-corruption, export control, and sanctions laws and regulations.
The FCPA prohibits us from providing anything of value to foreign officials for the purposes of obtaining or retaining business or securing any improper business advantage. It also requires us to keep books and records that accurately and fairly reflect our transactions. As part of our business, we may deal with state-owned business enterprises, the employees of which are considered foreign officials for purposes of the FCPA. Other anti-corruption legislation which we may be required to adhere to, sets out wider prohibitions including against private bribery, which is also relevant to our business.
Economic sanctions and export controls may restrict our ability to conduct business with or in certain jurisdictions, individuals and entities. We are not a U.S. person and are not owned or controlled by one or more U.S. persons. We have in the past engaged in dealings with parties in Cuba, Iran, and Syria, and we have ongoing de minimis activities with parties in Iran and Cuba. We believe that such activities have been conducted in compliance with all applicable sanctions and export controls, and are implementing policies and procedures designed to ensure continued compliance. However, we cannot be certain that these safeguards will be fully effective in the future to ensure compliance, and the scope and reach of U.S. sanctions laws could also change over time.
Violations of anti-corruption, export control and sanctions laws and regulations are punishable by civil penalties, including fines, denial of export privileges, injunctions, asset seizures, debarment from government contracts and revocations or restrictions of licenses, as well as criminal fines and imprisonment. There can be no assurance that all of our employees, consultants, agents or other associated persons will not take actions in violation of these laws and regulations, and that our procedures will effectively prevent us from violating these regulations in every transaction in which we may engage or provide a defense to any alleged violation. In particular, we may be held liable for the actions that our local strategic partners take inside or outside of the United States, even though our partners may not be subject to these laws. Such a violation, even if our policies prohibit it, could have a material adverse effect on our reputation, business, results of operations and financial condition.
We are subject to product liability and other claims in the ordinary course of business.
Our business involves risk of product liability claims related to providing incorrect product information at the time of purchase, claims for defective containment solutions which may impair drug efficacy and other claims in the ordinary course of business. Furthermore, there may be product liability risks that are unknown or which become known in the future. We may also face claims raised by our present employees for injury deriving from the lifting and handling of loads and the use of heavy machinery, as well as claims raised by our present and past employees for injury and illness from hazardous substances used or present at certain of our facilities. Substantial, complex or extended litigation on any claim could cause us to incur significant costs and distract our management. For example, lawsuits by governmental authorities, employees, shareholders, suppliers, collaborators, distributors, customers, competitors or others could be very costly and substantially disrupt our business. Our exposure to such claims may increase as we seek to increase the geographic scope of our sourcing and sales activities and to the extent that we expand our manufacturing operations. We maintain insurance policies but we cannot assure you that our insurance coverage will be available in all pending or any future cases brought against us. Furthermore, our ability to recover under any insurance is subject to the terms and conditions
34
of such insurance, as well as the financial viability of our and such third parties insurers, as well as legal enforcement under the local laws governing these arrangements. Insurance coverage in general or coverage for certain types of liabilities, such as product liability in developing markets, may not be readily available for purchase or cost-effective for us to purchase. Furthermore, many of our insurance policies are subject to deductibles and retentions. Accordingly, we could be subject to uninsured and unindemnified future liabilities requiring us to provide additional reserves to address such liabilities. An unfavorable result in a case for which adequate insurance or indemnification is not available could adversely affect our business, financial condition and results of operations.
Occasionally, we are also involved in disputes, litigation and regulatory matters incidental to and in the ordinary course of our business, including employment matters, commercial disputes, government compliance matters, environmental matters, and other matters arising out of the normal conduct of our business. Where merited, we will vigorously defend ourselves in such matters. There can be no assurance that the impact of any pending or future claims will not be material to our business, financial condition or results of operations.
We are exposed to credit risk on accounts receivable and certain prepayments made in the normal course of business.
Our average day sales outstanding for 2020 has been approximately 70 days, but a number of customers are pushing for longer payment terms (also offering no recourse discounting solutions). A substantial majority of our outstanding trade receivables are not covered by collateral or credit insurance. In addition, we may make advances to suppliers in the normal course of business. While we have procedures to monitor exposure to credit risk on trade receivables and other current assets, there can be no assurance such procedures will effectively limit our credit risk and avoid losses, which could have a material adverse effect on our financial condition and operating results.
We may be required to record a charge to earnings if our goodwill and other amortizable intangible assets or other investments become impaired.
We are required under IFRS to test goodwill for impairment at least annually and to review our goodwill, amortizable intangible assets and other investments, including those acquired through acquisition activity, for impairment when events or changes in circumstance indicate the carrying value may not be recoverable.
Factors that could lead to impairment of goodwill, amortizable intangible assets and other investments, including those acquired through acquisitions, include significant adverse changes in the business climate and actual or projected operating results and declines in the financial condition of our business. We may be required in the future to record additional charges to earnings if our goodwill, amortizable intangible assets or other investments become impaired. Any such charge would adversely impact our financial results.
If relations between China and the United States deteriorate, our business in the United States and China could be materially and adversely affected.
The relationship between China and the United States is subject to periodic tension. Changes in political conditions in the United States and China and changes in the state of China-U.S. relations are difficult to predict and could adversely affect our business. For instance, the U.S. administration has called for substantial changes to trade agreements and imposed significant increases on tariffs on goods imported into the United States, particularly from China. Other countries have responded similarly, with tariffs on goods entering their countries. We currently have facilities and sell products in China and have invested, and expect to continue investing, in the country, and if the Chinese government makes any changes to its laws or policy concerning foreign ownership of companies or assets located within China, or imposes any significant increases on tariffs on goods imported into or out of China, it could have a significant impact on our business and financial results.
35
If our employees were to engage in a strike or other work stoppage, our business, operating results and financial position could be materially adversely affected.
We employ approximately 4,350 employees, as at March 2021, in multiple jurisdictions (approximately 49% of which based in Italy, 12% based in Mexico, 9% based in Germany, 8% based in Slovakia, 6% based in the U.S., Brazil and Denmark and 4% based in China). A significant portion of our employees in Italy, Germany, Slovakia, Mexico, Denmark and China are covered by collective bargaining arrangements made either at the local or national level in their respective countries. Although we believe that our relations with our employees are satisfactory, no assurance can be given that this will continue. If disputes with our unions arise, or if our workers engage in a strike or other work stoppage, we could incur higher labor costs or experience a significant disruption of operations, which could have a material adverse effect on our business, operating results and financial position.
We are subject to tax laws, tariffs and potential tax audits in multiple jurisdictions that could affect our financial results.
We are subject to tax laws, tariffs and potential tax audits in multiple jurisdictions. The application and interpretation of these laws in different jurisdictions affect our international operations in complex ways and are subject to change, and some changes may be retroactively applied. Our tax liabilities in the different countries where we operate depend, in part, on transfer pricing and administrative charges among us and our subsidiaries. These arrangements require us to make judgments with which tax authorities may disagree, potentially resulting in the assessment of material additional taxes, penalties, interest or other charges to resolve these issues.
Transactions that we have structured in light of current tax rules could have material and adverse consequences for us if tax rules change. Tax audits, changes in tax laws, their application and interpretation or imposition of any new or increased tariffs, duties and taxes could increase our tax burden and materially and adversely affect our sales, profits and financial condition and could have an adverse effect on our business, net assets, or results of operations. Such factors could also cause us to expend significant time and resources and/or cause investors to lose confidence in our reported financial information.
We are exposed to Italian tax risks related to our multinational operations.
We operate in many different jurisdictions throughout the world, through our group companies. Over recent years, tax laws and practice applicable in various countries have become increasingly complex and sophisticated, particularly with respect to cross-border transactions. Italy has historically implemented a number of domestic provisions including those implementing EU anti-abuse Directives and OECD principles aimed at facing tax basis erosion schemes and allocation of income between associated enterprises adopted by multinational groups.
Italian Tax authorities are increasingly scrutinizing multinational groups based on these provisions by also enforcing exchange of information instruments in force with foreign tax authorities.
The combination of the above factors may lead to an increased likelihood of tax audits with respect, among other things, to: (i) tax residence, (ii) permanent establishment, (iii) transfer pricing, (iv) Controlled Foreign Company legislation, (v) taxation of dividends and capital gains derived upon interests held in companies located in low-tax Jurisdictions, (vi) withholding tax application on cross-border payments, and (vii) anti-hybrid mismatches. In any such case, depending on the specific circumstances, tax audits and/or tax litigations with the Italian tax authorities could result in tax liabilities and fines and penalties of significant amounts, which could be in excess of the amounts. We provide for in our financial statements for tax liabilities.
The application of indirect taxes could adversely affect our business and results of operations.
The application of indirect taxes, such as sales and use tax, value-added tax, provincial taxes, goods and services tax, business tax and gross receipt tax, to our business is a complex and evolving issue. Significant
36
judgment is required to evaluate applicable tax obligations. As a result, amounts recorded may be subject to adjustments by the relevant tax authorities. In many cases, the ultimate tax determination is uncertain because it is not clear how new and existing statutes might apply to our business. A number of jurisdictions globally have introduced (or are looking to introduce) additional value added tax (or similar tax) calculation requirements as well as additional reporting, record-keeping, collection and remittance obligations on businesses like ours.
There can be no assurance that we will not be a passive foreign investment company for U.S. federal income tax purposes, which could result in adverse U.S. federal income tax consequences to U.S. holders of our ordinary shares.
A non-U.S. corporation will be a passive foreign investment company (PFIC) for any taxable year if either: (i) at least 75% of its gross income is passive income for purposes of the PFIC rules or (ii) at least 50% of the value of its assets (generally determined on the basis of a quarterly average) is attributable to assets that produce or are held for the production of passive income. Whether we are treated as a PFIC is a factual determination that is made on an annual basis after the close of each taxable year. This determination will depend on, among other things, the composition of our income and assets, as well as the value of our assets (which generally will be determined by reference to the public price of the Shares, which may fluctuate significantly), from time to time.
Based on the current and anticipated composition of our income, assets and operations and the expected price of the Shares in this offering, we believe we were not a PFIC for U.S. federal income tax purposes for our most recent taxable year and do not expect to be a PFIC for the current taxable year or for foreseeable future years. Nevertheless, there can be no assurance that we will not be a PFIC for the current taxable year or for any future taxable year. If we are treated as a PFIC for any taxable year during which a U.S. investor held Shares, such U.S. investor could be subject to adverse U.S. federal income tax consequences. See Income Tax ConsiderationsU.S. Federal Income Tax Considerations Passive Foreign Investment Company.
We are subject to restrictive covenants under certain financing agreements, which could impair our ability to run our business.
We have in place a number of financing agreements which include covenants (such as negative covenants that would restrict our ability to distribute dividends and exceed certain indebtedness ratios) which may restrict our ability to operate our business. Our failure to comply with these covenants, including as a result of events beyond our control, could result in a default or event of default that could materially and adversely affect our financial condition and results of operations. For additional information on applicable regulations see Management Discussion and AnalysisLiquidity and Capital Resources.
The indemnification provisions of acquisition agreements by which we have acquired companies or businesses may not fully protect us, and we may face unexpected liabilities.
Certain of the acquisition agreements by which we have acquired companies or businesses require the former owners to indemnify us against certain liabilities related to the operation of the company or business before we acquired it. In most of these agreements, however, the liability of the former owners is limited, and certain former owners may be unable to meet their indemnification responsibilities. While we are protected by representation and warranties and related indemnification in relation to such acquisitions, these may not be enough to cover our exposure if a significant liability arose in connection with any acquisition agreement. We cannot assure you that these indemnification provisions will protect us fully or at all, and as a result we may face unexpected liabilities that adversely affect our business, financial condition and results of operations.
37
Our business depends on our ability to use and access information systems, and any failure to successfully maintain these systems or implement new systems to handle our changing needs could materially harm our operations.
We depend on standardized procedures and multiple information systems for our operations, customer service and quality and safety procedures. Furthermore, we rely on information technology systems to process, transmit, store and protect electronic information, including confidential customer, supplier, employee or other business information. Through our online platform, we collect and store confidential information that website users provide to us when submitting queries or job applications.
We use commercially available third-party technology solutions, software and software systems with some proprietary configurations. We also store data using third-party cloud services. Our information systems may be subject to damage or interruption from power outages, computer and telecommunications failures, computer viruses, security breaches, vandalism, catastrophic events, natural disasters, terrorist attacks, hackers and other security issues as well as human error. If our information systems are damaged, fail to work properly or otherwise become unavailable, particularly in light of the COVID-19 pandemic, we may incur substantial costs to repair or replace them, and we may experience a loss of critical information, customer disruption and interruptions or delays in our ability to perform essential functions and implement new and innovative services. If the cloud service providers we use were to experience unplanned downtime, delays or other issues delivering data to our information technology systems, including due to increased usage during the COVID-19 pandemic, it could adversely impact business operations. The compromising of our information systems or those with which we interact could harm our reputation and expose us to regulatory actions and claims from customers and other persons, any of which could adversely affect our business, financial condition and results of operations.
In addition, we may not have the necessary resources to enhance existing information systems or implement new systems where necessary to handle our increasing volume and/or our changing needs, and we may experience unanticipated delays, complications and expenses in implementing and integrating our systems. Any interruptions in operations would adversely affect our ability to properly allocate resources and timely deliver our products, which could result in customer dissatisfaction. We currently rely on certain legacy systems that are no longer supported by their respective manufacturers, with only a small number of current employees able to maintain these systems. Any failure of these systems could have a business impact. The failure to successfully implement and maintain information systems could have an adverse effect on our ability to obtain new business, retain existing business and maintain or increase our sales and profit margins, any of which could adversely affect our business, financial condition and results of operations.
Cyber security risks and the failure to maintain the confidentiality, integrity and availability of our computer hardware, software and internet applications and related tools and functions, could result in damage to our reputation, data integrity and/or subject us to costs, fines or lawsuits under data privacy or other laws or contractual requirements.
The integrity and protection of the data we hold is critical to our business. The regulatory environment governing information, security and privacy laws is increasingly demanding and continues to evolve. Implementing and maintaining compliance with applicable security and privacy regulations may increase our operating costs and/or adversely impact our ability to market our products and services to customers. Although our computer and communications hardware are protected through physical and software safeguards, they are still vulnerable to fire, storm, flood, power loss, earthquakes, telecommunications failures, physical or software break-ins, software viruses and similar events. These events could lead to the unauthorized access, disclosure and use of non-public information. We could be subject to risks caused by misappropriation, misuse, leakage, falsification, system malfunction or intentional or accidental release or loss of information maintained in our information systems and networks and those of our OEM suppliers, including our cloud service providers. The techniques used by criminal elements to attack computer systems are sophisticated, change frequently and may originate from less regulated and remote areas of the world. As a result, we may not be able to address these
38
threats proactively or implement adequate preventative measures. If our computer systems are compromised, we could be subject to fines, damages, litigation and enforcement actions, and we could lose trade secrets, the occurrence of which could harm our business.
If we are unable to maintain reliable information technology systems and appropriate controls with respect to global data privacy and security requirements and prevent data breaches, we may suffer regulatory consequences in addition to business consequences. The European Union and the United Kingdom have adopted comprehensive data protection and security laws. The European Unions Regulation (EU) 2016/679 of the European Parliament and of the Council of April 27, 2016 on the protection of natural persons with regard to the processing of personal data and on the free movement of such data, and repealing Directive 95/46/EC (General Data Protection Regulation), or the GDPR, which became effective in May 2018, as supplemented by national laws, and the UK GDPR (collectively, Applicable Data Protection Laws) impose strict requirements on controllers and processors of personal data in the European Economic Area, or EEA and the United Kingdom, including, for example, higher standards for obtaining consent from individuals to process their personal data, more robust disclosures to individuals and a strengthened individual data rights regime and shortened timelines for data breach notifications. Applicable Data Protection Laws create new compliance obligations and increase financial penalties for noncompliance (including possible fines of up to 4% of global annual revenues for the preceding financial year or 20 million, or £17.5 million in the UK, (whichever is higher) for the most serious violations). Data privacy laws in the European Union and the United Kingdom are developing rapidly and, as a consequence of Brexit, the UK will be free to diverge from European Union data privacy laws. We may therefore be subject in the future to separate and additional data protection obligations to those that we are already subject to. This may result in additional costs and may necessitate changes to our business practices, which in turn may compromise our growth strategy and otherwise adversely affect our business, reputation, legal exposures, financial condition and results of operations. In recent years, the United States and European lawmakers and regulators have expressed concern over electronic marketing and the use of third-party cookies, web beacons and similar technology for online behavioral advertising. In the European Union, marketing is defined broadly to include any promotional material and the rules specifically on e-marketing are currently set out in the ePrivacy Directive which will be replaced by a new ePrivacy Regulation. While the ePrivacy Regulation was originally intended to be adopted on May 25, 2018 (alongside the GDPR), it is still going through the European legislative process. The current draft of the ePrivacy Regulation imposes strict opt-in e-marketing rules with limited exceptions for business to business communications and significantly increases fining powers to the same levels as the GDPR. The UK has implemented the ePrivacy Directive into national law through the UK Privacy and Electronic Communications Regulation 2003, however it is unclear whether the UK will align itself to the ePrivacy Regulation, once implemented. This again introduces the possibility we will be subject to, and required to comply with, a separate and additional legal regime with respect to data privacy, which may result in additional costs and may necessitate changes to our business practices, which in turn may compromise our growth strategy and otherwise adversely affect our business, reputation, legal exposures, financial condition and results of operations.
There are also numerous U.S. federal and state laws and regulations related to the privacy and security of personal information. Although we take measures to protect data from unauthorized access, use or disclosure, our information technology and infrastructure may be vulnerable to attacks by hackers or viruses or breached due to employee error, malfeasance or other malicious or inadvertent disruptions. Any such breach or interruption could compromise our networks, and the information stored there could be accessed by unauthorized parties, manipulated, publicly disclosed, lost or stolen. Any such access, breach or other loss of information could result in legal claims or proceedings and liability under federal or state laws that protect the privacy of personal information and may result in regulatory penalties.
Additionally, the Gramm-Leach-Bliley Act of 1999 (along with its implementing regulations) (the GLBA) restricts certain collection, processing, storage, use and disclosure by covered companies of certain personal information, requires notice to individuals of privacy practices and provides individuals with certain rights to prevent the use and disclosure of certain non-public or otherwise legally protected information. The
39
GLBA also imposes requirements regarding the safeguarding and proper destruction of personal information through the issuance of data security standards or guidelines. In addition, many U.S. states in which we operate now or may operate in the future have laws that protect the privacy and security of sensitive and personal information. Certain U.S. state laws may be more stringent or broader in scope, or offer greater individual rights, with respect to sensitive and personal information than federal, international or other state laws, and such laws may differ from each other, which may complicate compliance efforts. State laws are changing rapidly, and there is discussion in the U.S. Congress of a new federal data protection and privacy law to which we may be subject.
We are also reliant on certain manual processes for collecting and processing data, and any failures in these processes or failure to handle the data collected in accordance with relevant regulations could lead to enforcement actions. Complying with all applicable laws, regulations, standards and obligations relating to data privacy, security and transfers may cause us to incur substantial operational costs or require us to modify our data processing practices and processes. Government enforcement actions can be costly and interrupt the regular operation of our business, and data breaches or violations of data privacy laws can result in significant fines, reputational damage and civil lawsuits, any of which may adversely affect our business, financial condition and results of operations. We may not be able to respond quickly or effectively to regulatory, legislative and other developments, and these changes may in turn impair our ability to commercialize our products or increase our cost of doing business. In addition, if our practices are not consistent or viewed as not consistent with legal and regulatory requirements, including changes in laws, regulations and standards or new interpretations or applications of existing laws, regulations and standards, we may become subject to audits, inquiries, whistleblower complaints, adverse media coverage, investigations, loss of export privileges, severe criminal or civil sanctions or reputational damage. Any of the foregoing could have an adverse effect on our competitive position, business, financial condition, results of operations and prospects.
The uncertain effects of climate change and potential climate change legislation could lead to business interruption, significantly increased costs and/or other adverse consequences to our business.
Climate change and potential climate change legislation may present risks to our operations, including business interruption, significantly increased costs and/or other adverse consequences to our business. Some of the potential impacts of climate change to our business include physical risks to our facilities, water and energy supply limitations or interruptions, disruptions to our supply chain and impairment of other resources. In addition, if legislation or regulations are enacted or promulgated in the U.S., Europe or Asia or any other jurisdictions in which we do business that limit or reduce allowable greenhouse gas emissions and other emissions, such restrictions could have a significant effect on our operating and financial decisions, including those involving capital expenditures to reduce emissions, and our results of operations. Our manufacturing operations may not be able to operate as planned if we are not able to comply with new legal and regulatory legislation around climate change, or it may become too costly to operate in a profitable manner. Additionally, suppliers added expenses could be passed on to us in the form of higher prices and we may not be able to pass on such expenses to our customers through price increases.
Risks Relating to our Intellectual Property
Our trade secrets may be misappropriated or disclosed, and confidentiality agreements with directors, employees and third parties may not adequately prevent disclosure of trade secrets and protect other proprietary information.
In addition to registered intellectual property rights, we rely on trade secrets and confidential know-how to protect our technology, especially because we believe that patent protection alone would not be sufficient to protect our business. However, trade secrets and confidential know-how are difficult to protect, and we have limited control over the protection of trade secrets and confidential know-how used by our licensors, collaborators and suppliers.
40
To protect this type of information against disclosure or appropriation by competitors, our usual practice is to require our directors, employees, consultants, contractors and advisors to enter into confidentiality agreements and, if applicable, material transfer agreements, consulting agreements or other similar agreements with us prior to beginning research or disclosing proprietary information. Moreover, we put in place appropriate procedures to identify confidential material and restrict access to documentation. However, current or former employees, consultants, contractors and advisers may unintentionally or willfully disclose our confidential information to competitors, we have entered into, and may in the future enter into additional, collaborations with our competitors, and confidentiality agreements may not provide an adequate remedy in the event of unauthorized disclosure of confidential information. In addition, the need to share trade secrets and other confidential information increases the risk that such trade secrets become known to our competitors, are inadvertently incorporated into the technology of others, or are disclosed or used in violation of these agreements. Enforcing a claim that a third party obtained illegally and is using trade secrets and/or confidential know-how is expensive, time consuming and the outcome is unpredictable, and the enforceability of confidentiality agreements may vary from jurisdiction to jurisdiction. Moreover, if any of our trade secrets and confidential know-how were to be lawfully obtained or independently developed by a competitor or other third party, we would have no right to prevent them from using that technology or information to compete with us. In some cases, we have entered into joint development agreements with our competitors that necessitate the sharing of certain trade secrets with these competitors. Given that our competitive position is based, in part, on our know-how and trade secrets, a competitors knowledge of our trade secrets or other unauthorized use or disclosure could impair our competitive position and may have an adverse effect on our business and results of operations.
If we are unable to obtain and maintain patent protection for our technology, products and potential products, or if the scope of the patent protection obtained is not sufficiently broad, we may not be able to compete effectively in our markets.
Our success depends in part on our ability to secure and maintain patent protection with respect to our technology, current products and potential products, and any future potential products and technology we may develop. We seek to protect our proprietary position by filing or collaborating with our licensors to file patent applications related to our proprietary technologies, products and potential products.
The patent prosecution process is expensive, time consuming and complex, and we may not be able to file, prosecute, maintain, defend, enforce or license all necessary or desirable patents at a reasonable cost or in a timely manner in all desirable jurisdictions. As a result, we may not be able to prevent competitors or other third parties from developing and commercializing competitive products in all such fields and jurisdictions.
It is possible that we will fail to identify patentable aspects of our research and development output or fail to take the necessary steps to seek patent protection before it is too late to obtain patent protection. We may not have the right to control the preparation, filing, and prosecution of patent applications, or to maintain the rights to patents licensed from third parties. Therefore, these patents and patent applications may not be prosecuted and enforced in a manner consistent with the best interests of our business. The patent applications that we own or in-license may fail to result in issued patents with claims that cover our relevant proprietary products and technology, including current products, potential products, and any future potential products we may develop, in whole or in part. Our existing patents may have issued with claims that fail to cover our relevant proprietary products and technology, including current products, potential products and any future potential products we may develop, in whole or in part. In addition, our existing patents and any future patents we obtain may not be sufficiently broad to prevent others from using our technology or from developing competing products and technologies. Patents may not be granted for a number of reasons, including known or unknown prior art, deficiencies in the patent application or the lack of novelty or the underlying invention or technology. In addition, publications of discoveries in scientific literature often lag behind the actual discoveries, and patent applications in certain jurisdictions are not published until 18 months after filing or in some cases, at all. Therefore, we cannot be certain that we or our licensors were the first to make or file the inventions claimed in our owned or licensed patents or pending patent applications.
41
Even if patents do successfully issue and even if such patents cover our current products, current potential products and any future potential products we may develop, third parties may challenge their validity, ownership, enforceability or scope, which may result in such patents being narrowed, invalidated, or held unenforceable or circumvented. We may become involved in proceedings challenging our owned or licensed patent rights, which could limit our ability to stop others from using or commercializing similar or identical technology and products, or could limit the duration of the patent protection of our technology, products and potential products. Such proceedings also may result in substantial costs and require significant time from our management and employees, even if the eventual outcome is favorable to us. In addition, the issuance of a patent does not give us the right to practice the patented invention. Third parties may have blocking patents that could prevent us from marketing our products, if approved, or practicing our own patented technology. Our competitors may also be able to circumvent our patents by developing similar or alternative potential products in a non-infringing manner.
Any of the foregoing could have an adverse effect on our competitive position, business, financial condition, results of operations and prospects.
We depend in part on proprietary technology licensed from others. If we lose our existing licenses or are unable to acquire or license additional proprietary rights from third parties, we may not be able to continue developing our potential products.
We are a party to certain license agreements for certain intellectual property and proprietary technology, and we may enter into additional agreements, including license agreements, with other parties in the future that impose certain obligations on us. If we fail to comply with our obligations to our licensors or any of our other current or future collaborators, our counterparties may have the right to terminate these agreements, in which event we might not be able to develop, manufacture or market any product, potential product or other technology that is covered by these agreements, which could adversely affect the value of the potential product being developed under any such agreement, or we may face claims for monetary damages or other penalties under these agreements. Termination of these agreements or reduction or elimination of our rights under these agreements may result in us having to negotiate new or reinstated agreements with less favorable terms, or cause us to cease or experience significant delays in the development and commercialization of our products, potential products or technologies and, our competitors or other third parties could have the freedom to market products and technologies identical or competitive to ours.
We may rely on third parties from whom we license proprietary technology to file and prosecute patent applications and maintain patents and otherwise protect the intellectual property we license from them. We may have limited control over these activities or any other intellectual property that may be related to our in-licensed intellectual property. We may have limited control over the manner in which our licensors initiate an infringement proceeding against a third-party infringer of the intellectual property rights, or defend certain of the intellectual property that may be licensed to us.
The growth of our business may depend in part on our ability to acquire or in-license additional proprietary rights. We may be unable to acquire or in-license any relevant third-party intellectual property rights that we identify as necessary or important to our business operations. We may fail to obtain any of these licenses at a reasonable cost or on reasonable terms, if at all, which would harm our business. In that event, we may be required to expend significant time and resources to redesign our products, potential products or technologies or the methods for manufacturing them or to develop or license replacement technology, all of which may not be feasible on a technical or commercial basis, which could adversely impact our business, financial condition, results of operations and prospects.
Disputes may arise regarding intellectual property subject to a license agreement and certain provisions in such agreements may be susceptible to multiple interpretations. The resolution of any contract interpretation disagreement that may arise could affect what we believe to be the scope of our rights to the relevant intellectual property or technology, or increase what we believe to be our diligence, financial or other obligations under the
42
relevant agreement, or we may face claims for monetary damages or other penalties under these agreements. Moreover, disputes may also arise over the inventorship and ownership of inventions and know-how resulting from the joint creation or use of intellectual property by our licensors or licensees and us and our partners. If disputes over intellectual property that we have licensed or any other dispute described above related to our license agreements prevent or impair our ability to use and enforce such intellectual property or maintain our licensing arrangements on commercially acceptable terms, we may be unable to successfully develop and commercialize the affected products, potential products or technologies. Any of the foregoing could have an adverse effect on our competitive position, business, financial condition, results of operations and prospects.
Third parties may assert claims against us alleging infringement, misappropriations or other violations of their patents and proprietary rights, or we may need to become involved in lawsuits to defend or enforce our patents, either of which could result in substantial costs or loss of productivity, delay or prevent the development and commercialization of our products and potential products, or prohibit our use of proprietary technology or sale of products.
Our commercial success depends, in part, upon our ability to develop, manufacture, market and sell our products and other technologies without alleged or actual infringement, misappropriation or other violation of the patents and proprietary rights of third parties. However, our research, development and commercialization activities may be subject to claims that we infringe, misappropriate or otherwise violate patents or other intellectual property rights owned or controlled by third parties. The various markets in which we operate can be subject to litigation regarding patents and other intellectual property rights. For example, our third-party collaborators may not properly obtain, maintain, enforce or defend our intellectual property or proprietary rights or may use or misappropriate our proprietary information in such a way that could jeopardize or invalidate our intellectual property rights or expose us to potential litigation. Our competitors have made substantial investments in patent portfolios and competing technologies, and may have applied for or obtained or may in the future apply for or obtain, patents that will prevent, limit or otherwise interfere with our ability to make, use and sell our products. In addition, patent holding companies that focus solely on extracting royalties and settlements by enforcing patent rights may target us.
We may be subject to third-party claims including patent infringement or similar adversarial proceedings or litigation in various jurisdictions. Even if we believe such claims are without merit, a court of competent jurisdiction could hold that these third-party patents are valid, enforceable and infringed, and the holders of any such patents may be able to block our ability to commercialize the applicable product or potential product unless we obtained a license under the applicable patents, or until such patents expire or are finally determined to be invalid or unenforceable. Third parties may obtain patents in the future and claim that use of our technologies, products and potential products infringes upon these patents. Additionally, because patent applications can take many years to issue, there may be currently pending patent applications which may later result in issued patents that our products, potential products or technologies may infringe. If any third-party patents issued from such applications were held by a court of competent jurisdiction to cover aspects of our products, potential products or technologies, the holders of any such patents may be able to prohibit our commercialization of the applicable product, potential product or technology until such patent expires or is finally determined to be invalid or unenforceable or unless we obtained a license.
In addition, defending such claims could cause us to incur substantial expenses and, if we fail, could cause us to pay substantial damages if we are found to be infringing a third partys patent rights. Further, if a patent infringement suit is brought against us, our development, manufacturing or sales activities relating to the product, potential product or technology that is the subject of the suit may be delayed or terminated, as parties making claims against us may obtain injunctive or other equitable relief. As a result of patent infringement claims, or in order to avoid potential infringement claims, we may choose to seek, or be required to seek, a license from the third party, which may require payment of substantial royalties or fees, or require us to grant a cross-license under our intellectual property rights. These licenses may not be available on reasonable terms or at all. Even if a license can be obtained on reasonable terms, the rights may be nonexclusive, which would give our competitors access to
43
the same intellectual property rights. If we are unable to enter into a license on acceptable terms, we could be prevented from commercializing one or more of our products, potential products or technologies, or forced to modify such products or potential products, or to cease some aspect of our business operations, which could harm our business significantly. We might also be forced to redesign or modify our products, potential products or technologies so that we no longer infringe the third-party intellectual property rights, which may result in significant cost or delay to us, or such redesign or modification could be impossible or technically not viable.
Even if we were ultimately to prevail, any of these events could require us to divert substantial financial and management resources that we would otherwise be able to devote to our business, force us to face negative publicity, adversely impact prospective customers or prohibit us from manufacturing, importing, marketing or otherwise commercializing our products, potential products, services and technology. In addition, because of the substantial amount of discovery required in connection with intellectual property litigation, there is a risk that some of our confidential information could be compromised by disclosure during this type of litigation. There could also be public announcements of the results of hearings, motions or other interim proceedings or developments, and if securities analysts or investors view these announcements in a negative light, the price of our ordinary shares could be adversely affected. We may not have sufficient financial or other resources to adequately conduct such litigation or proceedings. Some of our competitors may be able to sustain the costs of such litigation or proceedings more effectively than we can because of their substantially greater financial resources, adversely affecting our ability to compete in the marketplace.
We may become involved in lawsuits to protect or enforce our intellectual property, which could be expensive, time consuming and unsuccessful and have an adverse effect on the success of our business.
Competitors or other third parties may infringe, misappropriate or otherwise violate our patents or other intellectual property. In addition, our third-party collaborators may use or misappropriate our intellectual property and proprietary information in such a way that could jeopardize our ownership and intellectual property rights. If we or one of our licensors were to initiate legal proceedings against a third party to enforce a patent covering one of our products or potential products, the defendant could counterclaim that our patent is invalid or unenforceable. In patent litigation in certain countries, defendant counterclaims alleging invalidity or unenforceability are commonplace. Third parties may initiate invalidity proceedings even in the absence of infringement proceedings. Grounds for a validity challenge could be an alleged failure to meet any of several statutory requirements. Interference or derivation proceedings provoked by third parties or brought by us or declared by the relevant patent authority may be necessary to determine the priority of inventions with respect to our patents or patent applications. The outcome of proceedings involving assertions of invalidity and unenforceability during patent litigation is unpredictable.
If a defendant were to prevail on a legal assertion of invalidity or unenforceability, we would lose at least part, and perhaps all, of the patent protection on our products, potential products and other technology, which may allow third parties to commercialize our technology or products and compete directly with us, without payment to us, or could require us to obtain license rights from the prevailing party in order to be able to manufacture or commercialize our products, potential products or technologies without infringing third-party patent rights. Even if a defendant does not prevail on a legal assertion of invalidity or unenforceability, our patent claims may be construed in a manner that would limit our ability to enforce such claims against the defendant and others. Accordingly, despite our efforts, we may not be able to prevent third parties from infringing upon, misappropriating or otherwise violating our intellectual property rights. Even if we were to successfully assert our patents or other intellectual property rights, or to settle at an early stage, such litigation could burden us with substantial unanticipated costs or a court may not award remedies that sufficiently compensate us for our losses. The impact of public announcements of the results of hearings related to such awards on our business may be uncertain. Our patents and other intellectual property rights also will not protect our technology, products and potential products if competitors design around our protected technology, products and potential products without infringing our patents or other intellectual property rights.
44
Obtaining and maintaining our patent protection depends on compliance with various procedural, document submission, fee payment and other requirements imposed by governmental patent agencies, and our patent protection could be reduced or eliminated for non-compliance with these requirements.
We rely on external law firms, their extended network of partners worldwide and their internal check procedures for patent maintenance and prosecution. In the event that we or our licensors fail to maintain the patents and patent applications covering our products and potential products or if we or our licensors otherwise allow our patents or patent applications to be abandoned or lapse, it could create opportunities for competitors to enter the market, which would hurt our competitive position and could impair our ability to successfully commercialize our products.
We enjoy only limited geographical protection with respect to certain patents, and we may not be able to protect our intellectual property rights throughout the world.
Filing, prosecuting and defending patents covering our technology, products and potential products in all countries throughout the world would be prohibitively expensive, and even in countries where we have sought protection for our intellectual property, such protection can be less extensive than those in Europe and the United States. Competitors may use our and our licensors technologies in jurisdictions where we have not obtained patent protection or licensed patents to develop their own products and, further, may export otherwise infringing products to territories where we and our licensors have patent protection, but where enforcement is not as strong as that in the European Union or the United States. These products may compete with our products, and our or our licensors patents or other intellectual property rights may not be effective or sufficient to prevent them from competing.
Many jurisdictions have compulsory licensing laws under which a patent owner may be compelled to grant licenses to third parties. In addition, many jurisdictions limit the enforceability of patents against government agencies or government contractors. In these jurisdictions, the patent owner may have limited remedies, which could materially diminish the value of such patents. If we or any of our licensors are forced to grant a license to third parties with respect to any patents relevant to our business, our competitive position may be adversely impacted, which could have a material adverse effect on our business.
The legal system in certain foreign jurisdictions, particularly those in certain developing countries, do not favor the enforcement of patents, trade secrets and other intellectual property protection. Proceedings to enforce our patent and other intellectual property rights in foreign jurisdictions could result in substantial costs and divert our efforts and attention from other aspects of our business, could put our patents and other intellectual property rights at risk of being invalidated or interpreted narrowly and our patent applications at risk of not issuing and could provoke third parties to assert claims against us. Accordingly, our efforts to enforce our intellectual property rights around the world may be inadequate to obtain a commercial advantage from the intellectual property that we develop or license. Any of the foregoing could have an adverse effect on our competitive position, business, financial condition, results of operations and prospects.
We may be subject to claims that our employees, consultants, independent contractors or collaborators have wrongfully used or disclosed confidential information of their former employers or other third parties, and we may be subject to claims asserting ownership of what we regard as our own intellectual property.
We do and may employ individuals who were previously employed at universities or other life sciences companies, including our licensors, competitors or potential competitors. Although we seek to protect our ownership of intellectual property rights by ensuring that our agreements with our employees, consultants, collaborators, independent contractors and other third parties with whom we do business include provisions requiring such parties to assign rights in inventions to us and to not use the know-how or confidential information of their former employer or other third parties, we may be subject to claims that we or our employees, consultants, collaborators or independent contractors have inadvertently or otherwise used or disclosed
45
know-how or confidential information of their former employers or other third parties, or that former employers or other third parties have an ownership interest in our patents. Litigation may be necessary to defend against these claims, and if we fail, in addition to paying monetary damages, we may lose valuable personnel or intellectual property rights, such as exclusive ownership of, or right to use, valuable intellectual property, which could result in customers seeking other sources for the technology, or ceasing from doing business with us. Moreover, any such litigation or the threat thereof may adversely affect our reputation, our ability to form strategic alliances, engage with scientific advisors or hire employees or consultants, any of which could adversely affect our business, including in terms of substantial cost, reputational loss and/or a distraction to our management and other employees.
If conflicts arise between us and our collaborators or strategic partners, these parties may act in a manner adverse to us and could limit our ability to implement our strategies and protect our intellectual property rights.
If conflicts arise between our corporate or academic collaborators or strategic partners and us, the other party may act in a manner adverse to us and could limit our ability to implement our strategies and protect our intellectual property rights. Our collaborators or strategic partners may have or may, in the future, develop, either alone or with others, products in related fields that are competitive with the products we have or may develop. In addition, our collaborators or strategic partners may use our intellectual property and proprietary information in such a way that could jeopardize our ownership and intellectual property rights. Competing products, either developed by the collaborators or strategic partners or to which the collaborators or strategic partners have rights, may result in the withdrawal of partner support for our products.
Our collaborators or strategic partners also could preclude us from entering into collaborations with their competitors, fail to obtain timely regulatory approvals, terminate their agreements with us prematurely, fail to devote sufficient resources to the development and commercialization of products, use our intellectual property and proprietary information in such a way that could jeopardize our ownership and intellectual property rights, or merge with or be acquired by a third party who may do any of these things. Any of the foregoing could harm our development and commercialization efforts and materially adversely affect our business.
If our trademarks and trade names are not adequately protected, we may not be able to build name recognition in our markets of interest and our business may be adversely affected.
Although we currently own trademark registrations and have trademark applications pending, it may be possible that some trademarks may be the subject of a governmental or third-party objection, which could prevent the registration or maintenance of the same. We cannot assure you that any currently pending trademark applications or any trademark applications we may file in the future will be approved. If we are unsuccessful in obtaining trademark protection for our primary brands, we may be required to change our brand names; additionally, if competitors try to adopt trade names or trademarks similar to ours, this might impede our ability to build brand identity and possibly lead to market confusion, adversely affecting our business in the long-term. In addition, there could be potential trade name or trademark infringement claims brought by owners of other registered trademarks or trademarks that incorporate variations of our unregistered trademarks or trade names. Our efforts to enforce or protect our proprietary rights related to trademarks, trade secrets, domain names, copyrights or other intellectual property may be ineffective and could result in substantial costs and diversion of resources and could adversely impact our financial condition or results of operations.
Risks Relating to Our Shares and this Offering
The price of our ordinary shares may be volatile and may fluctuate due to factors beyond our control.
The initial public offering price for the ordinary shares was determined through negotiations between the underwriters and us, and may vary from the market price of our ordinary shares following this offering. If you
46
purchase our ordinary shares in this offering, you may not be able to resell those ordinary shares at or above the initial public offering price. The market price of our ordinary shares may fluctuate significantly due to a variety of factors, including:
| operating results that vary from our financial guidance or the expectations of securities analysts and investors; |
| the financial performance of the major end markets that we target; |
| our voting control is concentrated; |
| the operating and securities price performance of companies that investors consider to be comparable to us; |
| announcements of strategic developments, acquisitions and other material events by us or our competitors; |
| failure to meet or exceed financial estimates and projections of the investment community or that we provide to the public; |
| issuance of new or updated research or reports by securities analysts; |
| changes in government regulations; |
| financing or other corporate transactions; |
| the loss of any of our key personnel; |
| sales of our shares by us, our executive officers and board members, holders of our shares or other shareholders in the future; |
| price and volume fluctuations in the overall stock market, including as a result of trends in the economy as a whole; and |
| other events and factors, many of which are beyond our control. |
These and other market and industry factors may cause the market price and demand for our ordinary shares to fluctuate substantially, regardless of our actual operating performance, which may limit or prevent investors from readily selling their ordinary shares and may otherwise negatively affect the liquidity of our ordinary shares. In addition, the stock market in general, and pharmaceutical and biotechnology companies in particular, have experienced extreme price and volume fluctuations that have often been unrelated or disproportionate to the operating performance of these companies. In the past, when the market price of a stock has been volatile, holders of that stock have sometimes instituted securities class action litigation against the issuer. If any of the holders of our ordinary shares were to bring such a lawsuit against us, we could incur substantial costs defending the lawsuit and the attention of our senior management would be diverted from the operation of our business. Any adverse determination in litigation could also subject us to significant liabilities.
The dual class structure of our shares may adversely affect the value and trading market for the ordinary shares.
Our shares carry different voting rights depending on their class. Holders of ordinary shares are entitled to one vote per share, while holders of Class A shares (held solely by the Selling Shareholder or held in treasury by the Company) are entitled to three votes per share. Under no circumstances the ordinary shares can be converted into Class A shares. We cannot predict whether our dual class structure will result in a lower or more volatile market price for our ordinary shares or in adverse publicity or other adverse consequences. For example, certain index providers such as S&P Dow Jones and FTSE Russell have announced restrictions on including companies with multiple-class share structures in certain of their indexes. In addition, several stockholder advisory firms have announced their opposition to the use of multiple class structures. As a result, the dual class structure of our
47
shares may cause stockholder advisory firms to publish negative commentary regarding our corporate governance practices or otherwise seek to cause us to change our capital structure. Any such exclusion from indices or any actions or publications by stockholder advisory firms critical of our corporate governance practices could adversely affect the value and trading market for our ordinary shares.
If securities or industry analysts do not publish research, or publish inaccurate or unfavorable research, about our business, the price of our ordinary shares and our trading volume could decline.
The trading market for our ordinary shares will depend in part on the research and reports that securities or industry analysts publish about us and our business. Securities and industry analysts do not currently, and may never, publish research on us. If no or not enough securities or industry analysts commence coverage on us, the trading price for our ordinary shares would likely be negatively affected. In the event securities or industry analysts initiate coverage, if one or more of the analysts who cover us downgrade our ordinary shares or publish inaccurate or unfavorable research about our business, the price of our ordinary shares would likely decline. If one or more of these analysts cease coverage of us or fail to publish reports on us regularly, demand for our ordinary shares could decrease, which might cause the price of our ordinary shares and trading volume to decline.
We have broad discretion in the use of the net proceeds from this offering and may not use them effectively.
We intend to use the net proceeds from this offering for general working capital and corporate purposes, including enable us to satisfy the requirements of our investing activities and working capital needs and ensure an appropriate level of operating and strategic flexibility. Generally, we intend to use part of the proceeds to further expand our manufacturing facilities in Piombino Dese (Italy), establish new greenfield plants for EZ-Fill® products, with strong focus on biologics and vaccines, in Indiana (U.S.) and Zhangjiagang (China) (focusing also on engineering), and pursue strategic acquisitions to broaden our offering, our technical know-how and our international footprint. However, as our business needs continue to evolve, our intended use of proceeds may vary accordingly. Our management will have broad discretion in the application of the net proceeds from this offering and could spend the proceeds in ways that do not improve our results of operations or enhance the value of our ordinary shares. The failure by our management to apply these funds effectively could result in financial losses or cause the price of our ordinary shares to decline. Pending their use, we may invest the net proceeds from this offering in a manner that does not produce income or that loses value.
Our voting control is concentrated.
Stevanato Holding S.r.l., our controlling shareholder and holding company of the Stevanato family, exercises a significant majority of the voting power with respect to our outstanding shares because of the multiple voting shares that it holds. Class A Shares are entitled to three votes per share, and ordinary shares are entitled to one vote per share. Upon completion of the offering, Stevanato Holding S.r.l. may hold 84.07% to 84.65% of the voting rights of the Company, depending on whether and the extent to which the overallotment option in connection with the offering is exercised. Excluding treasury shares (which voting right is suspended), Stevanato Holding S.r.l. may hold 94.78% to 95.44% of the voting rights of the Company, depending on whether and the extent to which the overallotment option in connection with the offering is exercised.
As a result, the Company qualifies as a controlled company pursuant to the NYSE listing rules and, therefore, Stevanato Holding S.r.l. potentially has the ability to control the outcome of matters submitted to our shareholders for approval, including the election and removal of directors and any arrangement or sale of all or substantially all of our assets. This concentrated control could delay, defer or prevent a change of control, arrangement or merger or sale of all or substantially all of our assets that our other shareholders may support. Conversely, this concentrated control could allow the holder of the class A multiple voting shares to consummate a transaction that our other shareholders do not support. In addition, the holder of the class A multiple voting shares may make long-term strategic investment decisions and take risks that may not be successful and/or may seriously harm our business.
48
Future sales, or the possibility of future sales, of a substantial number of our shares could adversely affect the price of our ordinary shares.
Future sales of a substantial number of our shares, or the perception that such sales will occur, could cause a decline in the market price of our ordinary shares.
Upon completion of this offering, we will have ordinary shares outstanding. The ordinary shares offered in this offering will be freely tradable without restriction under the Securities Act, except for any of our shares that may be held or acquired by our directors, executive officers and other affiliates, as that term is defined in the Securities Act, which will be restricted securities under the Securities Act. Restricted securities may not be sold in the public market unless the sale is registered under the Securities Act or an exemption from registration is available.
We, our executive officers, directors and substantially all of our shareholders, including the Selling Shareholder, have agreed, subject to specified exceptions, with the underwriters not to directly or indirectly sell, offer, contract or grant any option to sell (including any short sale), pledge, transfer, establish an open put equivalent position within the meaning of Rule 16a-l(h) under the Exchange Act; or otherwise dispose of any shares, options or warrants to acquire shares, or securities exchangeable or exercisable for or convertible into shares currently or hereafter owned either of record or beneficially; or publicly announce an intention to do any of the foregoing for a period of 180 days after the date of this prospectus without the prior written consent of the underwriters.
All of our shares outstanding as of the date of this prospectus may be sold in the public market by existing shareholders 180 days after the date of this prospectus, subject to applicable limitations imposed under federal securities laws. See Shares Eligible for Future Sale for a more detailed description of the restrictions on selling our Shares after this offering.
In the future, we may also issue our securities if we need to raise capital in connection with a capital raise or acquisition. The amount of securities issued in connection with a capital raise or acquisition could constitute a material portion of our then-outstanding shares.
The rights of our shareholders may differ from the rights typically offered to shareholders of a U.S. corporation.
We are incorporated as a joint stock company (società per azioni) under Italian law. The rights of holders of our shares and, therefore, certain of the rights of holders of shares, are governed by Italian law, including certain provisions of the Italian Civil Code (the Italian Civil Code) and by our articles of association. These rights differ in certain respects from the rights of shareholders in typical U.S. corporations. See Description of Share CapitalDifferences in Corporate Law in this prospectus for a description of the principal differences between the provisions of the Italian Civil Code applicable to companies that are listed on a regulated market (società che fannno ricorso al mercato del capitale di rischio) and, for example, the Delaware General Corporation Law relating to shareholders rights and protections.
Claims of U.S. civil liabilities may not be enforceable against us.
We are incorporated under Italian law. Most of our assets are located outside the United States. The majority of our management and board of directors reside outside the United States. As a result, it may not be possible for investors to effect service of process within the United States upon such persons or to enforce judgments obtained in U.S. courts against them or us, including judgments predicated upon the civil liability provisions of the U.S. federal securities laws.
No assurance can be given that we will continue to pay or declare dividends.
We have historically paid dividends during the last three years. However, there can be no assurance that we will pay or declare dividends in the future. The actual declaration and payment of future dividends, the amount of
49
any such dividends, and the establishment of record and payment dates, if any, are subject to determination by our Board of Directors each quarter after its review of the current strategy, applicable debt covenants and financial performance and position, among other things. Our declaration and payment of future dividends is subject to risks and uncertainties, including: deterioration of our financial performance or position; inability to declare a dividend in compliance with applicable laws or debt covenants; an increase in our cash needs or decrease in available cash; and the business judgment of the board of directors that a declaration of a dividend is not in our best interest.
As a foreign private issuer, we are exempt from a number of rules under the Exchange Act, we are permitted to file less information with the SEC than domestic companies, and we will be permitted to follow home country practice in lieu of the listing requirements of NYSE, subject to certain exceptions. Accordingly, there may be less publicly available information concerning us than there is for issuers that are not foreign private issuers.
As a foreign private issuer, we are exempt from certain rules under the Exchange Act, including certain disclosure and procedural requirements applicable to proxy solicitations under Section 14 of the Exchange Act, our board of directors, officers and principal shareholders are exempt from the reporting and short-swing profit recovery provisions of Section 16 of the Exchange Act, and we are not required to file periodic reports and financial statements with the SEC as frequently or as promptly as companies whose securities are registered under the Exchange Act but are not foreign private issuers. Foreign private issuers are also not required to comply with Regulation FD, which restricts the selective disclosure of material non-public information. Accordingly, there may be less publicly available information concerning us than there is for companies whose securities are registered under the Exchange Act but are not foreign private issuers, and such information may not be provided as promptly as it is provided by such companies.
The NYSE corporate governance rules require listed companies to have, among other things, a majority of independent board members and independent director oversight of executive compensation, nomination of directors and corporate governance matters. As a foreign private issuer, we are permitted to, and we will, follow home country practice in lieu of the above requirements. As long as we rely on the foreign private issuer exemption to certain of the NYSE corporate governance standards, a majority of the directors on our board of directors are not required to be independent directors, our remuneration committee is not required to be comprised entirely of independent directors and we will not be required to have a nomination committee. Therefore, our board of directors approach to governance may be different from that of a board of directors consisting of a majority of independent directors, and, as a result, the management oversight of our Company may be more limited than if we were subject to all of the NYSE corporate governance standards. Accordingly, our shareholders may not have the same protections afforded to shareholders of companies that are subject to all NYSE corporate governance requirements.
We are an emerging growth company and it cannot be excluded that the reduced disclosure requirements applicable to emerging growth companies will make the ordinary shares less attractive to investors.
We are an emerging growth company as defined in the JOBS Act. As an emerging growth company, we are only required to provide two years of audited financial statements and only two years of related selected financial data and management discussion and analysis of financial condition and results of operations disclosure. In addition, we are not required to obtain auditor attestation of our reporting on internal control over financial reporting, have reduced disclosure obligations regarding executive compensation and are not required to hold non-binding advisory votes on executive compensation. In addition, the JOBS Act provides that an emerging growth company can take advantage of an extended transition period for complying with new or revised accounting standards. This allows an emerging growth company to delay the adoption of these accounting standards until they would otherwise apply to private companies. We have elected to take advantage of such extended transition period. We cannot predict whether investors will find our ordinary shares to be less attractive as a result of our reliance on these exemptions. If some investors find our ordinary shares to be less
50
attractive as a result, there may be a less active trading market for our ordinary shares and the price of our ordinary shares may be more volatile.
We may lose our foreign private issuer status in the future, which could result in significant additional costs and expenses.
As discussed above, we are a foreign private issuer and, therefore, we are not required to comply with all of the periodic disclosure and current reporting requirements of the Exchange Act. The determination of foreign private issuer status is made annually on the last business day of an issuers most recently completed second fiscal quarter, and, accordingly, the next determination will be made with respect to us on June 30, 2022. We would lose our foreign private issuer status if, for example, more than 50% of our shares were held by U.S. residents, and more than 50% of our total assets are located in the United States as of June 30, 2021. If we lose our foreign private issuer status on this date, we will be required to file with the SEC periodic reports and registration statements on U.S. domestic issuer forms beginning on January 1, 2023, which are more detailed and extensive than the forms available to a foreign private issuer. We will also have to mandatorily comply with U.S. federal proxy requirements, and our officers, directors and principal shareholders will become subject to the short-swing profit disclosure and recovery provisions of Section 16 of the Exchange Act. In addition, we will lose our ability to rely upon exemptions from certain corporate governance requirements under the listing rules of the NYSE. As a U.S. listed public company that is not a foreign private issuer, we will incur significant additional legal, accounting and other expenses that we will not incur as a foreign private issuer, and accounting, reporting and other expenses in order to maintain a listing on a U.S. securities exchange. These expenses will relate to, among other things, the obligation to present our financial information in accordance with U.S. GAAP in the future.
The obligations associated with being a public company will require significant resources and management attention.
As a public company in the United States, we will incur legal, accounting and other expenses that we did not previously incur. We will become subject to the reporting requirements of the Exchange Act, and the Sarbanes-Oxley Act, the listing requirements of the NYSE and other applicable securities rules and regulations. Compliance with these rules and regulations will increase our legal and financial compliance costs, make some activities more difficult, time-consuming or costly and increase the demand on our systems and resources, particularly after we are no longer an emerging growth company. The Exchange Act requires that we file annual and current reports with respect to our business, financial condition and results of operations. The Sarbanes-Oxley Act requires, among other things, that we establish and maintain effective internal controls and procedures for financial reporting. Furthermore, the need to establish the corporate infrastructure demanded of a public company may divert managements attention from implementing our growth strategy, which could prevent us from improving our business, financial condition and results of operations. We have made, and will continue to make, changes to our internal controls and procedures for financial reporting and accounting systems to meet our reporting obligations as a public company. However, the measures we take may not be sufficient to satisfy our obligations as a public company. In addition, these rules and regulations will increase our legal and financial compliance costs and will make some activities more time-consuming and costly. For example, we expect these rules and regulations to make it more difficult and more expensive for us to obtain director and officer liability insurance, and we may be required to incur substantial costs to maintain the same or similar coverage, and our business, prospects, financial condition and results of operations could be materially and adversely affected.
In addition, changing laws, regulations and standards relating to corporate governance and public disclosure are creating uncertainty for public companies, increasing legal and financial compliance costs and making some activities more time consuming. These laws, regulations and standards are subject to varying interpretations, in many cases due to their lack of specificity, and, as a result, their application in practice may evolve over time as new guidance is provided by regulatory and governing bodies. This could result in continuing uncertainty regarding compliance matters and higher costs necessitated by ongoing revisions to disclosure and governance
51
practices. We intend to invest resources to comply with evolving laws, regulations and standards, and this investment may result in increased general and administrative expenses and a diversion of managements time and attention from revenue-generating activities to compliance activities. If our efforts to comply with new laws, regulations and standards differ from the activities intended by regulatory or governing bodies due to ambiguities related to their application and practice, regulatory authorities may initiate legal proceedings against us, and our business, prospects, financial condition and results of operations could be materially and adversely affected.
For as long as we are an emerging growth company under the JOBS Act, our independent registered public accounting firm will not be required to attest to the effectiveness of our internal control over financial reporting pursuant to Section 404(b) of the Sarbanes-Oxley Act (Section 404(b)). We could be an emerging growth company for up to five years. See Prospectus SummaryImplications of Being an Emerging Growth Company and Prospectus SummaryForeign Private Issuer Status. Furthermore, after the date we are no longer an emerging growth company, our independent registered public accounting firm will only be required to attest to the effectiveness of our internal control over financial reporting depending on our filer status. Even if our management concludes that our internal controls over financial reporting are effective, our independent registered public accounting firm may still decline to attest to our managements assessment or may issue a report that is qualified if it is not satisfied with our controls or the level at which our controls are documented, designed, operated or reviewed, or if it interprets the relevant requirements differently from us. In addition, in connection with the implementation of the necessary procedures and practices related to internal control over financial reporting, we may identify deficiencies that we may not be able to remediate in time to meet the deadline imposed by the Sarbanes-Oxley Act for compliance with the requirements of Section 404. Failure to comply with Section 404 could subject us to regulatory scrutiny and sanctions, impair our ability to raise revenue, cause investors to lose confidence in the accuracy and completeness of our financial reports and negatively affect the price of our ordinary shares.
There is no existing market for our ordinary shares, and we do not know if one will develop to provide you with adequate liquidity.
Prior to this offering, there has been no public market for our ordinary shares. We cannot predict the extent to which investor interest in our Company will lead to the development of an active trading market on NYSE or otherwise or how liquid that market might become. If an active trading market does not develop, you may have difficulty selling any of our ordinary shares that you purchase, and the value of such ordinary shares might be materially impaired. The initial public offering price for our Shares will be determined by negotiations between us and the representative of the several underwriters and may not be indicative of prices that will prevail in the open market following this offering. Consequently, you may not be able to sell your ordinary shares at prices equal to or greater than the price you paid in this offering.
If you purchase ordinary shares in this offering, you will suffer immediate and substantial dilution of your investment.
The initial public offering price of our ordinary shares is substantially higher than the net tangible book value per share. Therefore, if you purchase our ordinary shares in this offering, you will pay a price per share that substantially exceeds our pro forma net tangible book value per share after this offering. Based on the initial public offering price of $21.00 per share, you will experience immediate dilution of $18.46 per share, representing the difference between our pro forma net tangible book value per share after giving effect to this offering at the initial public offering price. See Dilution for more detail.
We may need to raise additional funds to finance our future capital needs, which may dilute the value of our outstanding shares or prevent us from growing our business.
We may need to raise additional funds to finance our existing and future capital needs. If we raise additional funds through the sale of equity securities, we may issue such additional shares at a discount to the trending price
52
of our shares, which may dilute the value of our outstanding shares. We may also decide to issue securities, including debt securities that have rights, preferences and privileges senior to our shares. Any debt financing would increase our level of indebtedness and could negatively affect our liquidity and restrict our operations. We also can provide no assurances that the funds we raise will be sufficient to finance our existing indebtedness. We may be unable to raise additional funds on terms favorable to us or at all. If financing is not available or is not available on acceptable terms, we may be unable to fund our future needs. This may prevent us from increasing our market share, capitalizing on new business opportunities or remaining competitive in our industry.
If we fail to comply with requirements relating to being a public company in the United States when obligated to do so, our business could be harmed and our ordinary shares price could decline.
Prior to this offering, we were a private company with limited accounting personnel and other relevant resources with which to address our internal controls and procedures. Neither we nor our registered public accounting firm have performed an assessment or audit, respectively, of our internal control over financial reporting during any period in accordance with the provisions of the Sarbanes-Oxley Act and it is possible that, had we and our registered public accounting firm performed an assessment or audit, respectively, of our internal control over financial reporting in accordance with the provisions of the Sarbanes-Oxley Act, significant deficiencies and/or material weaknesses which have been identified. The continued presence of material weaknesses and/or significant deficiencies in any future financial reporting periods could result in financial statement errors that, in turn, could lead to errors in our financial reports, delays in our financial reporting, and that could require us to restate our operating results, or our auditors may be required to issue a qualified audit report, investors may lose confidence in the accuracy and completeness of our financial reports and the market price of our ordinary shares could be materially and adversely affected. We might also not identify one or more material weaknesses and/or significant deficiencies in our internal controls in connection with evaluating our compliance with Section 404(a) of the Sarbanes-Oxley Act (Section 404(a)), which requires that beginning with our second annual report following our initial public offering, management assess and report annually on the effectiveness of our internal control over financial reporting and identify any material weaknesses in our internal control over financial reporting. Although Section 404(b) requires our independent registered public accounting firm to issue an annual report that addresses the effectiveness of our internal control over financial reporting, we have opted to rely on the exemptions provided in the JOBS Act, and consequently will not be required to comply with SEC rules that implement Section 404(b) until such time as we are no longer an EGC. We could be an emerging growth company for up to five years. Prospectus SummaryImplications of Being an Emerging Growth Company and Prospectus SummaryImplications of Being a Foreign Private Issuer. Furthermore, after the date we are no longer an emerging growth company, our independent registered public accounting firm will only be required to attest to the effectiveness of our internal control over financial reporting depending on our filer status. Even if our management concludes that our internal controls over financial reporting are effective, our independent registered public accounting firm may still decline to attest to our managements assessment or may issue a report that is qualified if it is not satisfied with our controls or the level at which our controls are documented, designed, operated or reviewed, or if it interprets the relevant requirements differently from us.
We expect our first Section 404(a) assessment to be required in connection with our annual report for the fiscal year ending December 31, 2022.
In order to achieve and maintain compliance with the requirements of Section 404(a), we will need to expend significant resources and provide significant management oversight. Implementing any appropriate changes to our internal controls may require specific compliance training of our directors and employees, entail substantial costs in order to modify our existing accounting systems, take a significant period of time to complete and divert managements attention from other business concerns. These changes may not, however, be effective in maintaining the adequacy of our internal controls.
If either we are unable to conclude that we have effective internal control over financial reporting or, at the appropriate time, our independent registered public accounting firm is unable to provide us with an unqualified
53
report on the effectiveness of our internal control over financial reporting as required by Section 404(b), investors may lose confidence in our operating results, the price of our ordinary shares could decline, and we may be subject to litigation or regulatory enforcement actions. In addition, if we are unable to meet the requirements of Section 404, we may not be able to remain listed on the NYSE.
54
NOTE REGARDING FORWARD-LOOKING STATEMENTS
Forward-looking statements include statements concerning plans, objectives, goals, strategies, future events or performance, and underlying assumptions and other statements, which are other than statements of historical or present facts or conditions. These forward-looking statements are contained principally in the sections entitled Prospectus Summary, Risk Factors, Use of Proceeds, Managements Discussion and Analysis of Financial Condition and Results of Operations and Business. These statements relate to events that involve known and unknown risks, uncertainties and other factors, including those listed under Risk Factors, which may cause our actual results, performance or achievements to be materially different from any future results, performance or achievements expressed or implied by the forward-looking statements.
In some cases, these forward-looking statements which reflect our current views with respect to future events and financial performance. The words believe, anticipate, intend, estimate, forecast, project, plan, potential, may, should, expect and similar expressions identify forward-looking statements. Forward-looking statements contained in this prospectus include, but are not limited to, statements about:
| our future financial performance, including our revenue, operating expenses and our ability to maintain profitability; |
| our expectations regarding the development of our industry and the competitive environment in which we operate; |
| our goals and strategies; and |
| our proposed use of proceeds. |
The forward-looking statements in this document are based upon various assumptions, many of which are based, in turn, upon further assumptions, including, without limitation, managements examination of historical operating trends, data contained in our records and other data available from third parties. Although we believe that these assumptions are reasonable, because these assumptions are inherently subject to significant uncertainties and contingencies that are difficult or impossible to predict and are beyond our control, we cannot assure you that we will achieve or accomplish these expectations, beliefs or projections.
In addition to these important factors and matters discussed elsewhere in this prospectus, important factors that, in our view, could cause actual results to differ materially from those discussed in the forward-looking statements include:
| our product offerings are highly complex, and, if our products do not satisfy applicable quality criteria, specifications and performance standards, we could experience lost sales, delayed or reduced market acceptance of our products, increased costs and damage to our reputation; |
| we must develop new products and enhance existing products, adapt to significant technological and innovative changes and respond to introductions of new products by competitors to remain competitive; |
| our backlog might not accurately predict our future revenue, and we might not realize all or any part of the anticipated revenue reflected in our backlog; |
| if we fail to maintain and enhance our brand and reputation, our business, results of operations and prospects may be materially and adversely affected; |
| we are highly dependent on our management and employees. Competition for our employees is intense, and we may not be able to attract and retain the highly skilled employees that we need to support our business and our intended future growth; |
| our business, financial condition and results of operations depend upon maintaining our relationships with suppliers and service providers; |
55
| our business, financial condition and results of operations depend upon the availability and price of high-quality materials and energy supply and our ability to contain production costs; |
| significant interruptions in our operations could harm our business, financial condition and results of operations; |
| our manufacturing facilities are subject to operating hazards which may lead to production curtailments or shutdowns and have an adverse effect on our business, results of operations, financial condition or cash flows; |
| our business may be harmed if our customers discontinue or spend less on research, development, production or other scientific endeavors; |
| we may face significant competition in implementing our strategies for revenue growth in light of actions taken by our competitors; and |
| any other risk we mention in the section Risk Factors. |
We caution readers of this registration statement not to place undue reliance on these forward-looking statements, which speak only as at their dates. We undertake no obligation to update any forward-looking statement or statements to reflect events or circumstances after the date on which such statement is made or to reflect the occurrence of unanticipated events. New factors emerge from time to time, and it is not possible for us to predict all of these factors. Further, we cannot assess the impact of each such factor on our business or the extent to which any factor, or combination of factors, may cause actual results to be materially different from those contained in any forward-looking statement.
56
We estimate that we will receive net proceeds from this offering of approximately $439.2 million (367.8 million), at an offering price of $21.00 (17.59) per share, after deducting underwriting discounts and commissions and estimated offering expenses payable by us, and assuming no exercise of the underwriters option to purchase 3,360,000 additional shares from us. If the underwriters exercise in full their option to purchase additional shares from us, we estimate that we will receive net proceeds of approximately $506.7 million (424.4 million) after deducting underwriting discounts and commissions and estimated offering expenses payable by us.
We intend to use the net proceeds from this offering for general corporate purposes, including enabling us to satisfy the requirements of our investing activities and working capital needs and ensuring an appropriate level of operating and strategic flexibility. In particular, we plan to use part of the proceeds to further expand our manufacturing facilities in Piombino Dese, Italy, establish new greenfield plants for EZ-Fill® products, with a strong focus on biologics and vaccines, in Indiana (U.S.) and Zhangjiagang (China) (focusing also on engineering), and pursue strategic acquisitions to broaden our offering, our technical know-how and our international footprint. However, as our business needs continue to evolve, our intended use of proceeds may vary accordingly.
57
We have not adopted a dividend policy. In the years ended December 31, 2019 and 2020, we declared and paid dividends of an aggregate of 6,170,000 and 8,900,000 (6,955,398 in dividends and 1,944,602 in distributable reserve), respectively. On January 20, 2021, we had declared and paid dividends of an aggregate of 11,200,000 out of the distributable reserve (the so called riserva straordinaria).
The amount of any future dividend payments we may make will depend on, among other factors, our strategy, future earnings, financial condition, cash flow, working capital requirements, capital expenditures and applicable provisions of our articles of association. Under Italian law, payment of annual dividends by the company is paid out of its distributable profits and available reserves for each relevant year. Dividends are approved by our shareholders at an annual general meeting, which must be convened to approve our annual financial statements within 120 or, under certain circumstances, within 180 days after the end of the financial year to which such financial statements relate. See Description of Share CapitalShareholders Meetings.
According to current article 22 of Stevanato Holdings (our principal shareholder) articles of association, the directors of such company must exercise their voting powers in such a way as to cause a distribution of at least 10% of our net income to our shareholders each year.
The ordinary shares sold in this offering will have the same dividend rights as the other currently outstanding shares and will be entitled to dividends, if any are declared and paid, starting from the year ending December 31, 2021.
We have in place a number of financing agreements which include covenants that would restrict our ability, without the prior consent of the lenders, to distribute dividends if certain debt ratios are exceeded. See Managements Discussion and Analysis of Financial Condition and Results of OperationsLiquidity and Capital Resources.
Mandatory reserves
The payment of annual dividends is proposed by the board of directors and is subject to the approval by the shareholders at the annual general meeting. Before dividends are paid out of our net income in any year, an amount equal to 5% of such net income must be allocated to the companys legal reserve until such reserve is equal to at least one-fifth of the nominal value of the companys issued share capital. If our share capital is reduced as a result of accumulated losses, dividends may not be paid until the share capital is reconstituted or reduced by the same amount as the accumulated losses. Pursuant to articles 2433 et seq. of the Civil Code and article 28 of the articles of association, the board of directors may authorize the distribution of interim dividends, subject to certain limitations.
Repayment and Prescription
Any annual dividends declared by us must be paid in compliance with applicable laws. Shareholders cannot be required to repay dividends that have been paid based on duly approved financial statements, if the shareholders collected such dividends in good faith. Dividends not collected within five years from the date they become payable will be forfeited in the companys favor and will be added to the reserves.
If the Company pays any dividends, they will be paid in Euro. See Taxation for a discussion of certain Italian income tax provisions regarding the taxation of dividends.
58
The following table sets forth the Companys cash and cash equivalents and capitalization as of March 31, 2021 on:
| an actual basis, and |
| on an adjusted basis to reflect the issuance and sale of 22,400,000 ordinary shares in this offering at a public offering price of $21.00 per share, after deducting underwriting discounts and commissions and estimated offering expenses payable by us, and the application of net proceeds from this offering, as described under the section of this prospectus titled Use of Proceeds. |
You should read this table together with our audited consolidated financial statements and related notes beginning on page F-1, as well as the section of this prospectus titled Managements Discussion and Analysis of Financial Condition and Results of Operations and the other financial information included elsewhere in this prospectus.
As of March 31, 2021 | ||||||||
Actual (in millions) |
As Adjusted (in millions) |
|||||||
Cash and cash equivalents |
80.2 | 448.0 | ||||||
Debt |
||||||||
Current debt |
66.4 | 66.4 | ||||||
Non-current debt |
262.7 | 262.7 | ||||||
Total Debt |
329.1 | 329.1 | ||||||
Shareholders equity |
||||||||
Shares, with no par value: 272,427,240 actual shares issued and outstanding, 294,827,240 as adjusted shares issued and outstanding |
20.0 | 387.8 | ||||||
Reserves and Retained earnings |
282.5 | 282.5 | ||||||
Net profit attributable to equity holders of the parent |
36.6 | 36.6 | ||||||
Non-controlling interests |
(0.3 | ) | (0.3 | ) | ||||
Total shareholders equity |
338.7 | 706.6 | ||||||
Total capitalization |
667.8 | 1,035.6 |
59
The number of our shares to be outstanding after this offering is based on total outstanding ordinary shares and Class A shares as of the date of this prospectus.
Unless otherwise indicated, all information contained in this prospectus assumes or gives effect to:
| no exercise by the underwriters of their option to purchase additional ordinary shares from us and the Selling Shareholder in this offering; and |
| an initial public offering price of $21.00 per share. |
60
If you invest in our ordinary shares, your interest will be diluted to the extent of the difference between the initial public offering price per share and the pro forma as adjusted net tangible book value per share immediately following the consummation of this offering.
At March 31, 2021, we had a net tangible book value of 258.6 million ($308.7 million), corresponding to a net tangible book value of 0.95 ($1.13) per share. Net tangible book value per share is determined by dividing (i) our total assets, excluding intangible assets, less our total liabilities by (ii) the total number of shares outstanding (including ordinary shares and Class A shares).
After giving further effect to our issuance and sale of ordinary shares in this offering at an initial public offering price of $21.00 per share after deducting the underwriting discounts and commissions and estimated offering expenses payable by us, and our application of the estimated net proceeds from this offering, as described under the section of this prospectus titled Use of Proceeds, our pro forma as adjusted net tangible book value as of March 31, 2021 would have been 626.4 million ($747.9 million), or 2.12 ($2.54) per share. This represents an immediate increase of 1.17 ($1.40) in pro forma as adjusted net tangible book value per share to existing shareholders and immediate dilution of 15.46 ($18.46) in pro forma as adjusted net tangible book value per share to new investors purchasing ordinary shares in this offering. Dilution in net tangible book value per share to new investors is determined by subtracting as adjusted net tangible book value per share after this offering from the initial public offering price per share paid by new investors.
The following table illustrates this dilution to new investors purchasing ordinary shares in the offering.
Initial public offering price |
$ | 21.00 | ||||||
As adjusted net tangible book value per share as of March 31, 2021 |
$ | 1.13 | ||||||
Increase in net tangible book value per share attributable to this offering |
$ | 1.40 | ||||||
|
|
|||||||
As adjusted net tangible book value per share after this offering |
$ | 2.54 | ||||||
|
|
|||||||
Dilution per share to new investors in this offering |
$ | 18.46 |
61
If the underwriters were to exercise their option to purchase additional ordinary shares in full, the pro forma as adjusted net tangible book value per share after the offering would be $2.73 (2.29) per share, and the dilution per share to new investors would be $18.27 (15.30) per share.
The following table summarizes, on the pro forma as adjusted basis described above as of March 31, 2021, the differences between the number of shares purchased from us, the total consideration and the average price per share paid by existing shareholders and by investors participating in this offering, at the public offering price of $21.00 per share, before deducting the underwriting discounts and commissions and estimated offering expenses.
Share Purchased | Total Consideration | Average Price Per share |
||||||||||||||||||
Number | Percent | Amount | Percent | |||||||||||||||||
Existing shareholders |
272,427,240 | 92.4 | % | 20,002,000 | 4.8 | % | | 0.073 | ||||||||||||
|
|
|
|
|
|
|
|
|
|
|||||||||||
New investors |
22,400,000 | 7.6 | % | 393,960,000 | 95.2 | % | | 17.588 | ||||||||||||
|
|
|
|
|
|
|
|
|
|
|||||||||||
Total |
294,827,240 | 100 | % | 413,962,000 | 100 | % | | 1.404 | ||||||||||||
|
|
|
|
|
|
|
|
|
|
If the underwriters exercise their option to purchase additional ordinary shares in full, the following will occur:
| the percentage of our shares held by existing shareholders will decrease to 91.4% of the total number of our shares outstanding after this offering; and |
| the percentage of our shares held by new investors will increase to 8.6% of the total number of our shares outstanding after this offering. |
The above discussion and tables are based on total ordinary shares and Class A shares outstanding as of March 31, 2021.
In addition, we may choose to raise additional capital due to market conditions or strategic considerations, even if we believe we have sufficient funds for our current or future operating plans. To the extent that additional capital is raised through the sale of equity or convertible debt securities, the issuance of these securities may result in further dilution to our shareholders.
62
MANAGEMENTS DISCUSSION AND ANALYSIS OF FINANCIAL CONDITION AND
RESULTS OF OPERATIONS
You should read the following discussion of our financial condition and results of operations in conjunction with our consolidated financial statements and the notes included elsewhere in this prospectus. The following discussion contains forward-looking statements that involve certain risks and uncertainties including, but not limited to, those described in the Risk Factors section of this prospectus. Our actual results could differ materially from those discussed in these statements. Factors that could cause or contribute to these differences include those discussed below and elsewhere in this prospectus, particularly under the Risk Factors and Special Note Regarding Forward-Looking Statements sections. Certain numerical figures set out in this section, including financial data presented in millions and thousands, have been subject to rounding adjustments and, as a result, the totals of the data in this section may vary slightly from the actual arithmetic totals of such information. In addition, as a result of such rounding, the totals of certain financial information presented in tabular form may differ from the information that would have appeared in such totals using the unrounded financial information.
Overview
We are a leading global provider of drug containment, drug delivery and diagnostic solutions to the pharmaceutical, biotechnology and life sciences industries. We deliver an integrated, end-to-end portfolio of products, processes and services that address customer needs across the entire drug life cycle at each of the development, clinical and commercial stages. Our core capabilities in scientific research and development, our commitment to technical innovation and our engineering excellence are central to our ability to offer value added solutions to our clients.
We have secured a leadership position within the drug development and delivery value chain through our investment in research and development and the expansion of our global footprint and capabilities. Over our 70 year history, we have earned a leading reputation for high quality and reliability that has enabled us to become a partner of choice for more than 700 companies globally, including 41 of the top 50 pharmaceutical companies (which comprise all of the top 15) and eight of the top ten in-vitro diagnostic companies, as measured by 2020 revenue, according to data collected by Global Data. We also serve 15 of the top 20 biotechnology companies by market capitalization in the NASDAQ Biotechnology Index and over 100 biotechnology customers in total.
Our priority is to provide flexible solutions that preserve the integrity of pharmaceutical products and enable our customers to deliver safe and effective treatments to patients while reducing time to market, total cost of ownership (i.e., logistics, drug product waste, storage and personnel costs) and supply chain risk. We achieve this by developing our products in close collaboration with our customers, leveraging our scientific research capabilities, technical expertise and engineering and manufacturing excellence to meet their quality requirements.
Our solutions are highly integrated with the development, production and commercialization processes of our customers. In addition to manufacturing drug containment and delivery solutions, we provide a full set of services across all stages of drug development, from pre-clinical to clinical and commercialization. We also engineer machinery and equipment for the production of drug containment and delivery systems that can be integrated into both our customers and our own manufacturing processes. Our involvement at each stage of a drugs life cycle, together with the breadth of our offering, enables us to serve as a one-stop-shop for our customers, which we believe represents a significant competitive advantage.
We operate across the healthcare industry and serve some of its fastest growing segments, including biologics, biosimilars, vaccines and molecular diagnostics. As a result of how closely integrated we are in the drug production and delivery supply chain, we are well-positioned to benefit from secular trends within our target industries, such as increases in demand resulting from pharmaceutical innovation, acceleration and expansion of vaccination programs, growth in biologics/biosimilars, self-administration of medicines, aging demographics and increasing quality standards and regulation.
63
We estimate that our total addressable market, based on our current offering, exceeds $11 billion in terms of revenue generated by all market participants in 2020, and consists of biopharmaceutical injectables and in-vitro diagnostic products. Within each of these markets, we operate in some of the fastest growing segments, including pre-fillable syringes, drug delivery systems, molecular diagnostics and assembly equipment. We believe there are opportunities to further expand our addressable markets, including by targeting (i) complementary containment solutions, (ii) additional delivery systems, (iii) complementary engineering solutions and (iv) aftersales support and services.
We operate our business in two segments:
| Biopharmaceutical and Diagnostic Solutions, which includes all the products, processes and services developed and provided for the containment and delivery of pharmaceutical and biotechnology drugs and reagents, as well as the production of diagnostic consumables; and |
| Engineering, which includes all of the equipment and technologies developed and provided to support the end-to-end pharmaceutical, biotechnology and diagnostic manufacturing processes (assembly, visual inspection, packaging and serialization and glass converting). |
In the three months ended March 31, 2021, we generated approximately 83% of total sales from our Biopharmaceutical and Diagnostic Solutions segment and approximately 17% from our Engineering segment, compared to 88% and 12%, respectively, in the three months ended March 31, 2020. Both for the year ended December 31, 2019 and 2020, we generated approximately 85% of total sales from our Biopharmaceutical and Diagnostic Solutions segment and approximately 15% from our Engineering segment.
We refer to our premium products in the Biopharmaceutical and Diagnostic Solutions segment as our high-value solutions. High-value solutions are wholly owned, internally developed products, processes and services for which we hold intellectual property rights or have strong proprietary know-how, and that are characterized by particular complexity and high performance. Our high-value solutions deliver significant benefits to customers in terms of time-to-market and reduced total cost of ownership. Among our key high-value solutions is our EZ-Fill® line of ready-to-fill injectable products, which can be customized to clients needs. For additional information on EZ-Fill® see BusinessBusiness SegmentsBiopharmaceutical and Diagnostic Solutions Container Closure Systems (CCS).
We have nine production plants for manufacturing and assembling pharmaceutical and healthcare products across Europe (Italy, Germany and Slovakia) and the rest of the world (Brazil, China, Mexico and the United States), five plants for the production of machinery and equipment (Italy and Denmark), two sites for analytical services (Italy and the United States) and two commercial offices (Japan and the United States). Our manufacturing facilities in Mexico (serving the U.S. market), China and Brazil are greenfield operations established by us. Our manufacturing facilities in Slovakia, Denmark, Germany and the United States were acquired in strategic transactions over the past 15 years. Our global footprint, together with our proprietary, highly standardized manufacturing systems and processes, allow us to provide quality consistent products and services to our customers in more than 70 countries.
Since the outbreak of COVID-19, we have increased production capacity to support our customers efforts to provide a rapid response to COVID-19. In this context, we have been providing: (i) glass vials and syringes to approximately 90% of currently marketed vaccine programs, according to our estimates based on public information (WHO, EMA, FDA); (ii) diagnostic solutions for the detection and diagnosis of COVID-19; (iii) glass forming lines, which are being installed worldwide, to facilitate the distribution of glass bulks and sterile vials and syringes; and (iv) visual inspection systems. COVID-19 has generated increased demand for our products and services, further enabling us to accelerate our growth strategy.
64
Factors Affecting Our Performance
Our financial condition and results of operations have been, and will continue to be, affected by a number of important factors, including the following:
Increasing Market Share in Growing Markets
We are a key partner to leading companies in the pharmaceutical, biotechnology and life sciences industries, serving as one of the preeminent providers of drug containment, drug delivery, diagnostic and engineering solutions to these end markets. The demand for our solutions is driven, in part, by trends affecting the pharmaceutical, biotechnology and life sciences markets, such as the aging of the global population, the increasing incidence of chronic diseases (e.g. diabetes), continued innovation in biologic injectables, increasing access to advanced healthcare in developing and transitioning countries, broader demand for vaccine programs, increasing propensity of biotechnology companies to outsource non-core competencies and growth in self-injection systems where the primary container (i.e., glass containers) is integrated into the delivery device. We believe that as a result of our global footprint and deep-rooted cooperation with our customers, we have been and will continue to be able to anticipate such market trends and adapt our products and services offering to benefit from them. Our ability to continue to grow our revenue and increase our market share will depend, in part, on our continued ability to target fast-growing market segments and to introduce new products and technologies more efficiently than our competitors.
Shift in Sales Mix Towards High-Value Solutions
We continue to increase our focus on our innovation platform to extend and improve our in-house proprietary product offering. Our high-value products generate substantially higher revenues and profits than other containment and delivery solutions. We also believe that high-value products will support continued market share expansion in research use markets while enabling us to extend our product offering, through industry partners, to clinical applications. We expect to continue to devote significant resources to increase the proportion of high-value solutions we offer by focusing on developing innovative new products, both as part of our existing portfolio and in complementary and adjacent markets.
Impact of COVID-19 Pandemic
In 2020, the global COVID-19 pandemic caused both governments and private organizations to implement numerous measures seeking to contain the spread of the virus. These measures impacted and are expected to continue to impact our business and operations in several ways.
Initial short-term impacts of COVID-19 on our production and operational capabilities included: (i) labor absenteeism; (ii) disruptions to production lines; (iii) delays in, and increased costs of, logistics; (iv) short-term drop in sales of certain non-COVID-19 related orders, which were cancelled and or postponed; and (v) increased labor costs in the form of employee bonuses to recognize and reward general efforts during the pandemic.
Despite the initial short-term operational disruption, and the impact that the measures established to respond to the COVID- 19 pandemic had on our ability to carry out business development activities (which we believe may have had an impact on our ability to broaden our customer portfolio in the short-term), sales of syringes and vials to and for vaccination programs globally and visual inspection systems, increased resulting in a revenue growth acceleration. We have been supplying: (i) glass vials and syringes to approximately 90% of currently marketed vaccine programs, according to our estimates based on public information (WHO, EMA, FDA); (ii) plastic diagnostic consumables for the detection and diagnosis of COVID-19; (iii) glass forming lines, which are being installed worldwide, to facilitate the distribution of glass bulks and sterile vials and syringes; and (iv) visual inspection systems. Going forward, we anticipate that demand for syringes, vials and related products and services will remain elevated as the COVID-19 vaccine and treatment roll-out continues globally and, more
65
generally, as epidemic preparedness, including through new vaccination programs and booster shots, becomes a greater priority going forward. However, there remains uncertainty around the magnitude of the long-term impact of COVID-19 on demand for our solutions.
Maximizing Efficiency in Our Production Processes
Our production costs depend on our ability to maximize efficiency in our production processes. In 2018, we started the implementation of SG Steps, an operational excellence program aimed, among other things, at continuously improving the efficiency of our processes. Due to the integrated nature of our business, the SG Steps program resulted in an increase in the overall effectiveness of the equipment in our facilities, improved quality and efficiency in our global production processes and reduced delivery time, returns from customers, production scraps and waste. Our ability to maintain low production costs and, as a consequence, increase our profitability, will depend on how successful we are in further maximizing the efficiency of our processes, especially in newly acquired facilities where the SG Steps program will need to be implemented.
Selling, General and Administrative (SG&A) Expenses
We have historically recorded significant selling, general and administrative expenses associated with personnel expenses, expenses for professional services and other expenses, including depreciation and amortization. In recent years, as a result of the implementation of the SG Steps, our SG&A expenses have grown at a substantially lower rate than the growth of our revenue.
In 2020, our selling, general and administrative expenses were at 11.9% of our revenue compared to 14.3% in 2019. As a result of operating as a U.S. public company, we expect to incur additional general and administrative costs including expenses related to compliance with U.S. securities and stock exchange rules and regulations, additional insurance expenses, investor relations activities and other administrative and professional services, which may affect our SG&A to revenue ratio in the following financial years. In any given year, our aim is to grow revenue at a higher rate than the growth of our selling, general and administrative expenses (excluding non-recurring items such as expenses incurred in connection with our listing).
Research and Development Expenses
In 2020, our research and development expenses were 2.6% of our revenue, compared to 1.5% in 2019. Expenses in research and new product development are a strategic enabler for our future growth and we expect to continue to make substantial investments in this area in coming years. Through continued spending in our research and development programs, we intend to drive revenue and profit growth through processes that will improve innovation and quality of our existing products, facilitating the shift towards high-value products, services and solutions.
Our ability to leverage the significant investments in research and new product development which we made in recent years is critical to our future performance. We will continue to develop (i) containment solutions for innovative biologic drugs, including cell and gene therapies, and (ii) a sustainable pipeline of patient-centric drug delivery systems that support the transition of therapy from hospital to homecare and facilitate patient self-administration.
In the area of containment solutions, the development of new products will be targeted at maintaining the stability, potency and purity of our customers products prior to administration. New therapies for diabetes, cancer and autoimmune diseases are based on large, complex biologic molecules that are extremely sensitive to their storage environment. In the area of drug delivery systems, we will be targeting the development of easy-to-use, accurate, reliable self-injection systems for complex pharmaceutical and biotechnology products. We have developed a portfolio of devices for this market that can be used off-the-shelf or customized to the specific needs of the customer.
66
We will continue developing new drug delivery systems based on three pillars: patient centricity, sustainability and digitalization, core capabilities to meet our customers need for connected health devices. We apply a rigorous stage&gate development process, which de-risks our development projects and reduces total development costs. Development timelines for new drug delivery devices typically fall into the range of four to five years to reach the start of initial production.
Key Indicators of Performance and Financial Condition
Non-GAAP Financial Measures
We monitor and evaluate our operating and financial performance using several non-GAAP financial measures, including: EBITDA, Adjusted EBITDA, Adjusted EBITDA Margin, Adjusted Operating Profit, Adjusted Operating Profit Margin, CAPEX and Free Cash Flow. We believe that these non-GAAP financial measures provide useful and relevant information regarding our performance and improve our ability to assess our financial condition. While similar measures are widely used in the industry in which we operate, the financial measures we use may not be comparable to other similarly titled measures used by other companies, nor are they intended to be substitutes for measures of financial performance or financial position as prepared in accordance with IFRS.
EBITDA, Adjusted EBITDA and Adjusted EBITDA Margin
EBITDA is defined as net profit before income tax expenses, net financial expenses, including share of profit of associates, amortization and depreciation. Adjusted EBITDA is defined as EBITDA as adjusted for certain income and costs expected to occur infrequently, and that management considers not reflective of ongoing operational activities of the company. EBITDA is presented to aid management in their analysis of the performance of the Group and to assist in the comparison of our performance with that of our competitors. Adjusted EBITDA is provided in order to present how the underlying business has performed excluding the impact of certain non-recurring items, which may alter the underlying performance and impair comparability of results between periods.
The following table sets forth the calculation of EBITDA and Adjusted EBITDA for the three months ended March 31, 2020 and 2021 and the fiscal years ended December 31, 2019 and 2020 and provides a reconciliation of these non-GAAP measures to the most comparable IFRS measure, Net Profit. Adjusted EBITDA margin is calculated by dividing Adjusted EBITDA for a period by total revenue for the same period.
March 31, 2020 | March 31, 2021 | December 31, 2019 | December 31, 2020 | |||||||||||||
(amounts in millions, except as indicated otherwise) | ||||||||||||||||
Net Profit |
7.2 | 36.6 | 38.7 | 78.6 | ||||||||||||
Income Taxes |
3.6 | 5.1 | 16.0 | 17.7 | ||||||||||||
Finance Income |
(5.7 | ) | (2.0 | ) | (8.0 | ) | (14.9 | ) | ||||||||
Finance Expenses |
10.3 | 3.2 | 15.3 | 21.8 | ||||||||||||
Share of Profit of an Associate |
0.0 | 0.0 | 0.2 | (0.1 | ) | |||||||||||
|
|
|
|
|
|
|
|
|||||||||
Operating Profit |
15.4 | 42.9 | 62.2 | 103.1 | ||||||||||||
Depreciation and Amortization |
12.6 | 12.9 | 46.2 | 54.1 | ||||||||||||
|
|
|
|
|
|
|
|
|||||||||
EBITDA |
28.0 | 55.9 | 108.4 | 157.2 | ||||||||||||
Non-recurring items |
0.0 | (0.3 | ) | 0.0 | 3.0 | |||||||||||
|
|
|
|
|
|
|
|
|||||||||
Adjusted EBITDA |
28.0 | 55.6 | 108.4 | 160.2 | ||||||||||||
|
|
|
|
|
|
|
|
|||||||||
Adjusted EBITDA Margin |
20.5 | % | 28.9 | % | 20.2 | % | 24.2 | % | ||||||||
|
|
|
|
|
|
|
|
67
Adjusted Operating Profit and Adjusted Operating profit Margin
Adjusted Operating Profit represents Operating Profit as adjusted for certain income and costs expected to occur infrequently, and that management considers not reflective of ongoing operational activities. Adjusted Operating Profit is provided in order to present how the underlying business has performed excluding the impact of the adjusting items, which may alter the underlying performance and impair comparability of results between the periods.
The following table sets forth the calculation of Adjusted Operating Profit for the three months ended March 31, 2020 and 2021 and the fiscal years ended December 31, 2019 and 2020. Adjusted Operating Profit margin is calculated by dividing Adjusted Operating Profit for a period by total revenue for the same period.
For further information on Non-recurring items see General and Administrative Expenses below.
March 31, 2020 | March 31, 2021 | December 31, 2019 | December 31, 2020 | |||||||||||||
(amounts in millions, except as indicated otherwise) | ||||||||||||||||
Operating Profit |
15.4 | 42.9 | 62.2 | 103.1 | ||||||||||||
Non-recurring items |
0.0 | (0.3 | ) | 0.0 | 3.0 | |||||||||||
|
|
|
|
|
|
|
|
|||||||||
Adjusted Operating Profit |
15.4 | 42.6 | 62.2 | 106.1 | ||||||||||||
|
|
|
|
|
|
|
|
|||||||||
Adjusted Operating Profit Margin |
11.3 | % | 22.1 | % | 11.6 | % | 16.0 | % | ||||||||
|
|
|
|
|
|
|
|
CAPEX
Capital Expenditure, or CAPEX, is the sum of investment amounts in tangible fixed assets and intangible assets during the period (excluding right-of-use assets recognized during the period in accordance with IFRS 16 Leases). These investment activities consist of acquisitions of property, plant and equipment and intangible assets.
The following table sets forth the CAPEX for the three months ended March 31, 2021 and the fiscal year ended December 31, 2019 and 2020:
March 31, 2021 | December 31, 2019 | December 31, 2020 | ||||||||||
(amounts in millions) | ||||||||||||
Addition to Property, plants and equipment |
18.4 | 69.3 | 89.1 | |||||||||
Addition to Intangible Assets |
0.7 | 5.9 | 6.4 | |||||||||
|
|
|
|
|
|
|||||||
CAPEX |
19.1 | 75.2 | 95.5 | |||||||||
|
|
|
|
|
|
See Note 17 Intangible Assets and Note 18 Property, plant and equipment to the Consolidated Financial Statements for additional details.
For further information on Capital Expenditure on a paid-out cash basis see Liquidity and Capital Resources Capital Expenditure below.
Free Cash Flow
Free Cash Flow is defined as cash flows from operating activities excluding interests paid and received, less investments in property, plant and equipment and intangible assets on a cash basis.
68
The following table sets forth the calculation of Free Cash Flow for the three months ended March 31, 2020 and 2021 and the fiscal year ended December 31, 2019 and 2020:
March 31, 2020 | March 31, 2021 | December 31, 2019 | December 31, 2020 | |||||||||||||
(amounts in millions) | ||||||||||||||||
Cash Flow from / (used in) Operating Activities |
(9.3 | ) | 5.9 | 42.6 | 155.7 | |||||||||||
Interest paid |
1.2 | 1.1 | 4.7 | 5.4 | ||||||||||||
Interest received |
(0.2 | ) | (0.1 | ) | (0.6 | ) | (0.7 | ) | ||||||||
Purchase of property, plant and equipment |
(24.1 | ) | (21.7 | ) | (68.1 | ) | (89.6 | ) | ||||||||
Purchase of intangible assets |
(0.6 | ) | (0.7 | ) | (5.8 | ) | (6.4 | ) | ||||||||
|
|
|
|
|||||||||||||
Free Cash Flow |
(33.0 | ) | (15.5 | ) | (27.2 | ) | 64.4 | |||||||||
|
|
|
|
|
|
|
|
For further information on cash flow see Liquidity and Capital Resources Operating and Investing Activities below.
Components of Our Results of Operations
The following discussion sets forth certain components of our statements of operations as well as factors that impact those items.
Results discussed in this section of the prospectus is consolidated according to IFRS accounting principles and therefore does not include Companys inter-segment items.
Revenue and Segment Reporting
Our revenue is divided into two main segments:
(i) | Biopharmaceutical and Diagnostic Solutions: which includes all the products, processes and services developed and provided for the containment and delivery of pharmaceutical and biotechnology drugs and reagents, as well as the production of diagnostic consumables. This segment is split into two sub-categories: |
| high-value solutions; and |
| other containment and delivery solutions. |
(ii) Engineering: | which includes all of the equipment and technologies developed and provided to support the end-to-end biopharmaceutical and diagnostic manufacturing processes (assembly, visual inspection, packaging and serialization and glass converting). We believe operating in this segment differentiates us from our competitors, and enables us to provide integrated end to end solutions, reduce time to market and improve the quality of our products. |
Revenue recognized in the three months ended March 31, 2020 and 2021 amounted to 136.4 million and 192.8 million, respectively, and those recognized for the years ended December 31, 2019 and 2020 amounted to 536.5 million and 662.0 million, respectively.
In the three months ended March 31, 2021, we generated approximately 83% of total sales from our Biopharmaceutical and Diagnostic Solutions segment and approximately 17% from our Engineering segment, compared to 88% and 12%, respectively, in the three months ended March 31, 2020. Both for the year ended December 31, 2019 and 2020, we generated approximately 85% of total sales from our Biopharmaceutical and Diagnostic Solutions segment and approximately 15% from our Engineering segment.
69
Costs and Expenses
Cost of Sales
Cost of sales for the three months ended March 31, 2020 and 2021 amounted to 96.9 million and 127.4 million, respectively, while as of December 31, 2019 and 2020 amounted to 398.5 million and 467.9 million, respectively. Cost of sales primarily consists of the cost of materials, components and labor expense related to the production and distribution of goods and services. Cost of sales also includes depreciation and amortization of 10.6 for the three months ended March 31, 2020 and 2021, and 38.5 million and 45.3 million for the fiscal year ended December 31, 2019 and 2020, respectively.
Selling and Marketing Expenses
Selling and marketing expenses amounted to 6.3 million and 5.9 million for the three months ended March 31, 2020 and 2021, respectively, and to 26.1 million and 20.0 million for the years ended December 31, 2019 and 2020, respectively. These expenses are mainly related to personnel expenses for our sales organization. They include also depreciation and provision for bad and doubtful debts totalling 1.4 million for the three months ended March 31, 2020 and 2021, respectively, and to 4.6 million and 1.9 million for the years ended December 31, 2019 and 2020, respectively.
Research and Development Expenses
Research and development expenses amounted to 4.0 million and 5.8 million for the three months ended March 31, 2020 and 2021, respectively, and to 7.8 million and 17.4 million for the years ended December 31, 2019 and 2020, respectively. These expenses include costs for research and development activities to support the innovation of our product range and components and amortization of capitalized development costs.
General and Administrative Expenses
General and administrative expenses amounted to 14.2 million and 14.0 million for the three months ended March 31, 2020 and 2021, respectively, and to 50.6 million and 58.9 million for the years ended December 31, 2019 and 2020, respectively. These expenses include personnel expenses for general and administrative functions, consultancies, directors compensation, rental fees, depreciation and amortization.
70
Results of Operations
Three months ended March 31, 2020 versus three months ended March 31, 2021
The following table sets forth our results of operations for the three months ended March 31, 2020 and 2021.
March 31, 2020 | March 31, 2021 | |||||||
(amounts in millions) | ||||||||
Revenue |
136.4 | 192.8 | ||||||
Costs of sales |
96.9 | 127.4 | ||||||
Gross Profit |
39.5 | 65.4 | ||||||
|
|
|
|
|||||
Other operating Income |
0.2 | 3.2 | ||||||
|
|
|
|
|||||
Selling and Marketing Expenses |
6.2 | 5.9 | ||||||
|
|
|
|
|||||
Research and Development Expenses |
3.9 | 5.8 | ||||||
|
|
|
|
|||||
General and Administrative Expenses |
14.2 | 14.0 | ||||||
Operating Profit |
15.4 | 42.9 | ||||||
|
|
|
|
|||||
Finance Income |
5.7 | 2.0 | ||||||
|
|
|
|
|||||
Finance Expense |
10.3 | 3.2 | ||||||
|
|
|
|
|||||
Share of Profit of an Associate |
| | ||||||
|
|
|
|
|||||
Profit Before Tax |
10.8 | 41.7 | ||||||
Income Taxes |
3.6 | 5.1 | ||||||
|
|
|
|
|||||
Net Profit |
7.2 | 36.6 | ||||||
|
|
|
|
Revenue
Revenue increased by 56.4 million, or 41.4%, to 192.8 million for the three months ended March 31, 2021, compared to 136.4 million for the three months ended March 31, 2020.
Biopharmaceutical and Diagnostic Solutions. Revenue generated by the Biopharmaceutical and Diagnostic Solutions segment increased by 40.2 million, or 33.4%, to 160.6 million for the three months ended March 31, 2021, from 120.4 million in the three months ended March 31, 2020.
Revenue growth for this segment was due to: (i) the increase in sales volumes of our premium priced high-value solutions, which grew by 14.7 million, or 48.8%, to 44.9 million for the three months ended March 31, 2021, from 30.2 million for the three months ended March 31, 2020, reflecting our continuing efforts to strategically shift towards a product mix that includes a higher proportion of high-value solutions, such as EZ-Fill® products and high-value syringes; and (ii) a general increase in demand for our other containment and delivery solutions, which caused sales to increase by 25.5 million, or 28.2%, to 115.6 million for the three months ended March 31, 2021, from 90.2 million in the three months ended March 31, 2020. COVID-19 contributed to higher demand for our products, causing a revenue increase which more than offset the decrease in, or slower growth in, sales of products, services and solutions destined to businesses that were closed or less active as a result of COVID-19 business disruptions.
Engineering. Revenue generated by the Engineering segment increased by 16.2 million, or 101.1%, to 32.3 million for the three months ended March 31, 2021, from 16.0 million for the three months ended March 31, 2020.
71
Revenue increase in this segment was amplified by the effects of COVID-19, which caused an increase in sales of visual inspection systems and glass forming lines. The increase was also due to higher sales of assembly and packaging machines.
Revenue Breakdown by Region.
Our ongoing geographic expansion resulted in an increase in sales in all markets where we operate and in particular in a 23.2 million, or 75.2%, increase in North America and a 5.2 million, or 47.9%, increase in APAC, which are our fastest growing markets, and a 26.7 million, or 29.5%, and 1.3 million, or 30.4%, increase in Europe and the South American region, respectively.
Cost of Sales
Cost of sales includes mainly raw materials and components, other variable costs, direct and indirect labor, depreciation of property, plant and equipment, utilities and manufacturing overhead.
Cost of sales increased by 30.5 million, or 31.5%, to 127.4 million for the three months ended March 31, 2021, compared to 96.9 million for three months ended March 31, 2020. Our overall cost of sales increased less than proportionally compared to our revenues, mainly as a consequence of our continuing efforts to increase efficiency in our production processes. The increase in cost of sales resulted from a general increase in cost of materials and components and direct and indirect personnel costs mainly due to the significant growth of our sales volumes. Cost of sales were also negatively impacted by a 4.0 million provision for a specific risk related to a potential customer claim relating to defective syringes.
Gross Profit
Gross profit increased by 25.9 million, or 65.6%, to 65.4 million for the three months ended March 31, 2021, compared to 39.5 million for the three months ended March 31, 2020. This increase was mainly driven by our Biopharmaceutical and Diagnostic Solutions segment for which gross profit increased significantly due to our continuing efforts to shift towards a product mix that includes a higher proportion of high-value solutions and to increase efficiency by better leveraging our installed capacity and fixed expenses. The increase in the Engineering segment gross profit was mainly driven by a substantial growth in sales of vision inspection and glass converting machinery and the adoption of integrated project management systems in our plants which created synergies through the pooling and more efficient utilization of resources across such entities. Gross profit improved also as a result of our greater focus on aftersales activities, which have higher gross profit margins compared to the sale of machinery.
Other Operating Income
Other operating income, which includes all revenue from customers not derived from the sale of our products, services and solutions such as revenue from feasibility studies, design, development and industrialization of new products, increased by 3.0 million to 3.2 million for the three months ended March 31, 2021, compared to 0.2 million for the three months ended March 31, 2020. Other operating income represents a minor part of our income and its amount varies yearly depending of the specific business agreements in place. The increase during the three months ended March 31, 2021 mainly accounts for fees collected from customers in connection with purchase orders or cancellation fees related to COVID-19, customers contribution for pre-feasibility studies and other grants.
Selling and Marketing Expenses
Selling and marketing expenses decreased by 0.4 million, or 5.8%, to 5.9 million for the three months ended March 31, 2021, compared to 6.2 million for the three months ended March 31, 2020. This decrease, which was due to a reduction in travel, fair and exhibition expenses as a consequence of the COVID-19 pandemic, was partially offset by the increase in personnel expenses due to new hires.
72
Research and Development Expenses
Research and development expenses increased by 1.9 million, or 47.4%, to 5.8 million for the three months ended March 31, 2021, compared to 3.9 million for the three months ended March 31, 2020, mainly in connection with our investments to structure our drug delivery systems department and setting up our new research and development lab in Boston.
General and Administrative Expenses
General and administrative expenses were substantially unchanged at 14.0 million for the three months ended March 31, 2021, compared to 14.2 million in the three months ended March 31, 2020. The reduction in personnel expenses (1.4 million) due to a non-recurring accrual reversal related to cash settled awards under a now terminated stock option plan and the lower travel and business costs (reduced by 0.4 million) were offset by the non-recurring consultancy costs relating to our IPO process (1.5 million).
Operating Profit
As a result of the foregoing, operating profit increased by 27.6 million, or 179.1%, to 42.9 million for the three months ended March 31, 2021, compared to 15.4 million for the three months ended March 31, 2020.
Net Finance Expenses
Finance expenses, net of finance income, decreased by 3.3 million (or 73.0%) to 1.2 million for the three months ended March 31, 2021, from 4.6 million for the three months ended March 31, 2020. Finance expense include bank interest on the Groups financial debt (recalculated using the amortized cost method) and interest on leases, recognized in accordance with IFRS 16Leases.
Profit Before Tax
Profit before taxes increased by 30.9 million, or 285.5%, to 41.7 million for the three months ended March 31, 2021, compared to 10.8 million for the three months ended March 31, 2020.
Income Taxes
Income taxes increased by 1.6 million, or 43.8%, to 5.1 million for the three months ended March 31, 2021, compared to 3.6 million for the three months ended March 31, 2020. Average tax rate decreased by 20.7%, from 33.05% to 12.33% in the first quarter of 2021. In March 2021, the group reached an agreement with the Italian Tax Authority regarding the applicability of the so called Patent box regime, resulting in a retroactive 5.5 million tax saving for the financial years 2016-2020. The normalized effective tax rate without this one-off item is 25.5%.
March 31, 2020 | March 31, 2021 | |||||||
(amounts in millions) | ||||||||
Income Tax Expenses reported in the statement of profit or loss |
3.6 | 5.1 |
Net Profit
Net profit increased by 29.3 million, or 404.8%, to 36.6 million for the three months ended March 31, 2021, compared to 7.2 million for the three months ended March 31, 2020.
73
Year ended December 31, 2019 versus year ended December 31, 2020
The following table sets forth our results of operations for the years ended December 31, 2019 and 2020.
December 31, 2019 | December 31, 2020 | |||||||
(amounts in millions) | ||||||||
Revenue |
536.5 | 662.0 | ||||||
Costs of sales |
398.5 | 467.9 | ||||||
|
|
|
|
|||||
Gross Profit |
138.0 | 194.2 | ||||||
|
|
|
|
|||||
Other operating Income |
8.7 | 5.2 | ||||||
|
|
|
|
|||||
Selling and Marketing Expenses |
26.1 | 20.0 | ||||||
|
|
|
|
|||||
Research and Development Expenses |
7.8 | 17.4 | ||||||
|
|
|
|
|||||
General and Administrative Expenses |
50.6 | 58.9 | ||||||
Operating Profit |
62.2 | 103.1 | ||||||
|
|
|
|
|||||
Finance Income |
8.0 | 14.9 | ||||||
|
|
|
|
|||||
Finance Expense |
15.3 | 21.8 | ||||||
|
|
|
|
|||||
Share of Profit of an Associate |
(0.2 | ) | 0.1 | |||||
|
|
|
|
|||||
Profit Before Tax |
54.7 | 96.3 | ||||||
Income Taxes |
16.0 | 17.7 | ||||||
|
|
|
|
|||||
Net Profit |
38.7 | 78.6 | ||||||
|
|
|
|
Revenue
Revenue increased by 125.5 million, or 23.4%, to 662.0 million for the year ended December 31, 2020, compared to 536.5 million for the year ended December 31, 2019.
Biopharmaceutical and Diagnostic Solutions. Revenue generated by the Biopharmaceutical and Diagnostic Solutions segment increased by 109.9 million, or 24.1%, to 564.9 million for the year ended December 31, 2020 from 455.0 million in the year ended December 31, 2019.
Revenue growth for this segment was due: (i) to the increase in sales volumes of our premium priced high-value solutions, which revenue grew by 55.6 million, or 61.3%, to 146.3 million for the year ended December 31, 2020, from 90.7 million for the year ended December 31, 2019, reflecting our continuing efforts to strategically shift towards a product mix that includes a higher proportion of high-value solutions, such as EZ-Fill® products and high-value syringes; and (ii) to a general increase in demand for our other containment and delivery solutions, which caused sales to increase by 54.3 million, or 14.9%, to 418.6 million for the year ended December 31, 2020, from 364.3 million in the year ended December 31, 2019. COVID-19 contributed to a higher demand for our products, causing a revenue increase which more than offset any decrease in sales of our products to businesses impacted by COVID-19 such as anesthetic, diagnostic, plastic and minor surgeries related businesses.
Engineering. Revenue generated by the Engineering segment, increased by 15.6 million, or 19.1%, to 97.1 million for the year ended December 31, 2020 from 81.5 million for the year ended December 31, 2019. Growth in this segment was driven by higher sales of visual inspection systems, which are utilized widely by companies supplying products and services to address the COVID-19 pandemic. This growth offset the lower increase in sales of assembly equipment and slight decrease in sales of glass forming machines resulting from the inability to travel and logistical difficulties with deliveries and in situ installation due to COVID-19.
74
Revenue Breakdown by Region. Our revenue grew by 42.5 million, or 32.1%, in North America (which accounted for approximately 27.0% of our total revenue for the year ended December 31, 2020), by 11.6 million, or 20.9%, in the APAC region (which accounted for approximately 10.0% of our total revenue for the year ended December 31, 2020), and by 75.3 million, or 23.3%, in Europe (which accounted for approximately 60.0% of our total revenue for the year ended December 31, 2020) while it decreased slightly by 3.9 million, or 15.2%, in South America (which accounted for approximately 3.0% of our total revenue for the year ended December 31, 2020).
Revenue increase in the North America and the APAC regions resulted from our recent international expansion efforts. Since the beginning of 2020, we sought to strengthen our position in the United States by establishing leadership positions dedicated to that region within our organization. In addition, we recorded an increase in orders of high-value solutions in the United States by certain key customers, which also contributed to the increase in revenue in that region.
Cost of Sales
Cost of sales increased by 69.4 million, or 17.4%, to 467.9 million for the year ended December 31, 2020 compared to 398.5 million for the year ended December 31, 2019, mainly due to the cost of materials, components and labor expenses related to the production and distribution of goods and services. Cost of sales increased less than proportionally compared to our revenue, mainly due to our ongoing efforts to maximize efficiency through automation initiatives and reduction of scraps and returns from customers. COVID-19 caused a slight increase in our costs of sales due to the extra bonuses that we paid to our employees to reward work and attendance in the year ended December 31, 2020 and the new hires we made to address the increasing demand for our products and services and to ensure business continuity during the pandemic.
Gross Profit
Gross profit increased by 56.2 million, or 40.7%, to 194.2 million for the year ended December 31, 2020 compared to 138.0 million for the year ended December 31, 2019. This increase was mainly driven by the Biopharmaceutical and Diagnostic Solutions segment for which gross profit increased significantly due to the increasing proportion of high-value solutions sold, the increase in demand for our products and services during the pandemic and a less than proportional increase of our costs.
The increase in the Engineering segment gross profit was mainly driven by the adoption of shared management systems in our subsidiaries which created synergies through the pooling and more efficient utilization of resources across such entities.
Moreover, in 2020 we fully leveraged the capabilities integration among entities acquired in 2016 and newly established plant in Brazil.
Other Operating Income
Other operating income, which includes all revenue from customers not derived from the sale of our products, services and solutions such as revenue from feasibility studies, design, development and industrialization of new products, decreased by 3.5 million, or 40.2%, to 5.2 million for the fiscal year ended December 31, 2020 compared to 8.7 million for the year ended December 31, 2019. Other operating income represents a minor part of our income and its amount varies yearly depending of the specific business agreements in place.
Selling and Marketing Expenses
Selling and marketing expenses decreased by 6.1 million, or 23.3%, to 20.0 million for the year ended December 31, 2020 compared to 26.1 million for the year ended December 31, 2019. These expenses are mainly related to personnel expenses for our sales organization. They also include depreciation and provisions for bad and doubtful debts of 1.1 million for the year ended December 31, 2020 (3.9 million for the year ended December 31, 2019).
75
The decrease in selling and marketing expenses was mainly due to the reduction in bad debt provision and travel expenses and cancellation of trade fairs as a consequence of the COVID-19 pandemic, and to the decrease in marketing activities and business consultancies.
Research and Development Expenses
Research and development expenses increased by 9.6 million, or 122.2%, to 17.4 million for the year ended December 31, 2020, compared to 7.8 million for the year ended December 31, 2019. Such expenses include costs for research and development activities to support the innovation of our product range and components and include amortization of capitalized development costs.
The increase in research and development expenses reflects our strategy to focus on innovation and an increasingly higher mix of premium products and was primarily due to the development of proprietary products and our investments in connection with the continued development of high-value drug delivery systems, as well as other high-value products, engineering solutions and further investments in our analytical services.
General and Administrative Expenses
General and administrative expenses increased by 8.3 million, or 16.4%, to 58.9 million for the year ended December 31, 2020, compared to 50.6 million in the year ended December 31, 2019. These expenses mainly comprise personnel expenses for management of the company as well as depreciation and amortization of 5.4 million (compared to 6.1 million in 2019), of which amortization of fair value adjustments from purchase price allocations amounted to 1.0 million (as in 2019).
A material part of the increase (2.8 million) was related to non-recurring litigation costs arising from a lawsuit brought by Clere BSD GmbH (plaintiff) against Balda AG (defendant), one of the Groups subsidiaries, in connection with the payment of certain transfer fees for the acquisition of a patent by the defendant, where Clere was awarded 2.8 million. The litigation ended in 2020. The increase is also due to the business growth and the increase in personnel expenses for long-term incentive and cash settled awards.
Operating Profit
As a result of the foregoing, operating profit increased by 40.9 million, or 65.7%, to 103.1 million for the year ended December 31, 2020, compared to 62.2 million for the year ended December 31, 2019.
Net Finance Expenses
Finance expenses, net of finance income, decreased by 0.3 million (or 4.4%) to 6.9 million for the year ended December 31, 2020, from 7.2 million for the year ended December 31, 2019. Finance expense include bank interest on the Groups financial debt (recalculated using the amortized cost method) and interest on leases, recognized in accordance with IFRS 16Leases.
In 2020, COVID-19 caused fluctuations in the exchange rate of the main currencies we are exposed to (in particular the Mexican pesos) affecting our finance income and expenses.
Profit Before Tax
Profit before taxes increased by 41.6 million, or 76.1%, to 96.3 million for the year ended December 31, 2020, compared to 54.7 million for the year ended December 31, 2019.
Income Taxes
Income taxes increased by 1.6 million, or 10.5%, to 17.7 million for the year ended December 31, 2020, compared to 16.0 million for the year ended December 31, 2019.
76
Income taxes
As a global organization, we and our subsidiaries file income tax returns in Italy, the U.S. federal jurisdiction and various state and other foreign jurisdictions. Deferred taxes are calculated based on the global allocation criteria, taking into account the cumulative amount of all the temporary differences, based on the average expected rates in force when these temporary differences reverse.
Deferred tax assets are recorded if there is reasonable certainty that the temporary differences will reverse in future years against assessable income not lower than the differences that will be reversed.
December 31, 2019 | December 31, 2020 | |||||||
(amounts in millions) | ||||||||
Current Income Tax |
||||||||
Current Taxes |
20.5 | 29.5 | ||||||
|
|
|
|
|||||
Deferred Taxes |
||||||||
Deferred Taxes |
(4.5 | ) | (11.8 | ) | ||||
|
|
|
|
|||||
Income Tax Expenses reported in the statement of profit or loss |
16.0 | 17.7 | ||||||
|
|
|
|
Current Taxes
Current taxes increased by 9.0 million, or 43.9%, to 29.5 million for the year ended December 31, 2020, compared to 20.5 million for the year ended December 31, 2019. This increase, due to higher pre-tax profits, was mitigated by the application of the hyper-depreciation (iper ammortamento) provided by the 2017 Italian Budget Law on certain machinery and by a change in the tax regime applicable to our Chinese business (to which a tax rate of 15% instead of 25% is now applicable).
Deferred Taxes
In 2020, we recorded a deferred taxes benefit of 11.8 million, compared to 4.5 million in 2019, mainly in connection with a step-up in the tax value of certain assets.
Income Tax Expenses reported in the statement of profit or loss
In 2020, we recorded income tax expenses reported in the statement of profit or loss of 17.7 million, compared to 16.0 in 2019.
Net Profit
Net profit increased by 39.9 million, or 103.1%, to 78.6 million for the year ended December 31, 2020, compared to 38.7 million for the year ended December 31, 2019.
Liquidity and Capital Resources
Since our inception, we have financed our operations mainly through cash generated by our operating activities and debt financing. Our primary requirements for liquidity and capital are to finance capital expenditures, working capital (which is the difference of current assets and current liabilitiesnet of current financial assets, current financial liabilities, cash and cash equivalents), and general corporate purposes.
Our primary sources of liquidity are our cash and cash equivalents and medium and long-term loans from a number of financial institutions, as described below. For the three months ended March 31, 2020 and 2021, we had cash and cash equivalents of 52.3 million and 80.2 million and other current financial assets of
77
40.6 million and 41.5 million, respectively, while as of December 31, 2020, we had cash and cash equivalents of 115.6 million (compared to 85.4 million in 2019) and other current financial assets of 41.5 million (compared to 41.3 million in 2019). Our cash and cash equivalents primarily consist of cash at bank and highly liquid investments, such as short-term deposits, which are unrestricted from withdrawal or use, or which have original maturities of three months or less when purchased. We believe that our total available liquidity (defined as cash and cash equivalents plus undrawn committed credit lines and marketable securities), in addition to funds that will be generated from operating activities, will enable us to satisfy the requirements of our investing activities and working capital needs for the next 12 months and ensure an appropriate level of operating and strategic flexibility.
Our total current liabilities were 308.0 million as of March 31, 2021 (compared to 316.2 million and 262.9 million as of December 31, 2020 and 2019, respectively), which primarily includes 87.4 million trade payables, 80.0 million financial liabilities, 30.8 million tax payables, 5.6 million lease liabilities and 104.3 other liabilities mainly relating to payables to personnel and social security institutions as well as allowance for future expected customer returns.
Financing activities
We manage our working capital to support our business and operations. In terms of financing activities, we have been actively seeking additional financing to improve our liquidity position and we have been able to raise capital through private placements to investors, as well as debt financing.
Pricoa Private Placement. On April 16, 2020 we entered into a note purchase and private shelf agreement with PGIM, Inc. and certain of its affiliates (the Note Purchase Agreement), pursuant to which, for a period of three years following the date of the agreement (unless earlier terminated) the company may issue, and PGIM, Inc. or certain of its affiliates may purchase, up to US$69.5 million of our notes. Additionally, on the same date, we issued 50.0 million of our Senior Notes, Series A, due April 16, 2028 to PGIM, Inc. (the Notes), with an interest rate of 1.4%. Repayment of the Notes is required to be made in two tranches, 25.0 million on April 16, 2027, and the reminder at the expiration of the notes.
Pursuant to the Note Purchase Agreement, Nuova Ompi S.r.l. provided to PGIM, Inc. and its affiliates a subsidiary guarantee, guaranteeing the repayment of the notes.
The Note Purchase Agreement imposes certain covenants on us, including: (i) the notes must always rank at least pari passu with all other unsecured and unsubordinated indebtedness of the company and the guarantor; (ii) any covenant included in a different financing agreement which is more favorable to the lenders must apply to the Note Purchase Agreement, as well; (iii) the aggregate EBITDA of the company and the guarantor must always be at least equal to a certain percentage of the EBITDA of our group; (iv) no merger or consolidation for any guarantor unless expressly permitted by the Note Purchase Agreement; (v) no dealings with sanctioned entities; (vi) the ratio of consolidated net debt to consolidated EBITDA not to be greater than 3.50 to 1.00 with an increase of up to 4.0x once; (vii) consolidated net debt to equity not to be greater than 2 to 1; (viii) no liens in excess of a certain amount except for, among others, (a) existing ones, (b) tax liens, (c) liens in the ordinary course of business, (d) judgment liens; (ix) no sale of assets in excess of a certain amount; (x) no subsidiary indebtedness beyond a certain basket; and (xi) no segregation of assets under Italian law.
Additional Medium and Long-Term Loan Facilities. As of March 31, 2021, we had medium and long-term loan facilities totaling 274.8 million in available principal, fully drawn down.
The total outstanding amount includes amounts raised between 2016 and 2019. In 2019, we raised approximately 100 million from four bank loans with an average term of five years, three-year pre-amortization period and 3.6 million due beyond five years. The all-in fixed interest rate, inclusive of hedging and upfront fees, is 1.5%. These loan agreements impose certain covenants on us, including: (i) not to exceed certain
78
consolidated net debt to consolidated EBITDA ratios (not greater than 4.0 to 1.0 in three of the loan agreements and not greater than 3.5 to 1.0, at 4.0x, in the remaining fourth one); (ii) to maintain a consolidated net debt to equity ratio equal to or lower than 2 to 1 and at least amounting to 200 million; (iii) not to sell assets having a value, or to grant liens or loans to third parties, exceeding certain amounts; (iv) to ensure that the loans always rank at least pari passu with other debt of the company; (v) not to segregate assets (as defined under Italian law); and (vi) not to distribute dividends or reserves nor to carry out extraordinary transactions resulting in the breach of financial covenants.
In 2017 and 2018 we raised approximately 158 million from five loans with an average term of 4.4 years. These loans include covenants consistent with those described for the 2019 loans. The all-in fixed interest rate, inclusive of hedging and upfront fees, is 1.1%. The outstanding principal of the five loans as at March 31, 2021 is 114.3 million due within five years.
The remaining 175 million was underwritten between 2016 and early 2017 mainly in connection with our strategic acquisitions. The outstanding principal amount as of March 31, 2021 was 57.7 million, due within five years. In 2019 the financial covenants included in these agreements were renegotiated to align them with those described above for the 2019 loans. Applicable interest rates are in the range of 0.70% to 1.35%.
Short-Term Loan Facilities. As of March 31, 2021, we had short-term facilities totaling 62.9 million in available principal, of which we had drawn down 4.6 million.
Capital Expenditures
Our capital expenditures consist of property, plant and equipment and intangible assets. During the three months ended March 31, 2021, our total capital expenditures were 19.1 million, which included (i) 14.2 million relating to our capacity expansion (including 6.0 million in new production lines for EZ-Fill® syringes in Piombino Dese, and the remainder in new production lines for bulk products in Mexico and Piombino Dese, new machinery for high precision plastic injection molding and assembly for container in vitro diagnostic solution required to face the increasing COVID-19 demand), (ii) 2.3 million for maintenance, increasing quality and improving our IT systems, (iii) 1.4 million to improve efficiency of our production processes, (iv) 0.8 million to improve safety our plants and production sites, and (v) 0.4 million for research and development, including laboratory equipment, molds and other related equipment.
During the fiscal year ended December 31, 2020, capital expenditures for growth and capacity expansion were 69.7 million, which included (i) 38.6 million relating to our new industrial property complex in Piombino Dese (Italy), (ii) 18.5 million for new production lines for non EZ-Fill® products in Piombino Dese, Mexico and Slovakia facilities (of which 11.6 million to face the increasing COVID-19 related demand), and (iii) 9.2 in facilities and machinery for high precision plastic injection molding and assembly for container in vitro diagnostic solution. Of the 38.6 million invested in our new plant in Piombino Dese, 15.1 million were spent to complete the construction of the plant and 23.5 million invested in machinery for the production of EZ-Fill® syringes (of which 9.1 million to face the increasing COVID-19 related demand).
Capital expenditures for maintenance, increasing quality and improving our IT systems amounted to 10.8 million, while for research and development, including laboratory equipment, molds and other related equipment, amounted to 8.4 million. We intend to devote the same portion of capital expenditures to growth and capacity expansion in future years.
Finally, we invested 3.8 million to improve efficiency of our production processes and 3.0 million to improve safety our plants and production sites.
We expect that the net proceeds from the offering and our cash and cash equivalents, in addition to funds that will be generated from operating activities, will enable us to satisfy the requirements of our investing
79
activities and working capital needs and ensure an appropriate level of operating and strategic flexibility. In particular, we plan to use part of the proceeds to further enlarge our manufacturing facilities in Piombino Dese (Italy), establish new greenfield plants for EZ-Fill® products, with strong focus on biologics and vaccines, in Indiana, (U.S.) and Zhangjiagang (China) (focusing also on engineering), and pursue strategic acquisitions to broaden our offering, our technical know-how and our international footprint. However, as our business needs continue to evolve, our intended use of proceeds may vary accordingly.
Cash Flow
The following table presents the summary consolidated cash flow information for the periods presented.
Three months ended March 31 2020 |
Three months ended March 31 2021 |
Year ended December 31, 2019 |
Year ended December 31, 2020 |
|||||||||||||
(amounts in millions) | ||||||||||||||||
Cash flows from / (used in) operating activities |
(9.3 | ) | 5.9 | 42.6 | 155.7 | |||||||||||
Cash flows from / (used in) investing activities |
(24.7 | ) | (22.4 | ) | (74.3 | ) | (96.1 | ) | ||||||||
Cash flows from / (used in) financing activities |
3.0 | (19.8 | ) | 42.2 | (26.5 | ) | ||||||||||
Net change in cash and cash equivalents |
(31.0 | ) | (36.4 | ) | 10.4 | 33.1 |
Cash generated from operating activities
Net cash generated from operating activities was 5.9 million for the three months ended March 31, 2021 (compared to 9.3 million cash used in operating activities in the three months ended March 31, 2020) and 155.7 million for the year ended December 31, 2020 (compared to 42.6 million for the year ended December 31, 2019). This improvement was mainly driven by EBITDA generation of 157.2 million and a reduction in our net working capital. In 2020, our working capital decreased by 33.2 million to 100.7 million (15.2% of revenue) from 133.9 million (24.9% of revenue) in 2019. In 2020, despite of the revenue increase, account receivables remained stable at 128.0 million, as a result of a significant reduction in past due receivables, while account payable, grew by 24.9% in line with the revenue increase. Our inventories net of advances from customers decreased from 21.8% of revenue in 2019 to 18,9% of revenue in 2020.
Cash used in investing activities
Net cash used in investing activities was 22.4 million for the three months ended March 31, 2021 (compared to 24.7 million for the three months ended March 31, 2020) and 96.1 million for the year ended December 31, 2020 (compared to 74.3 million cash used in investing activities for the year ended December 31, 2019), consisting mainly of the purchase of property and equipment to increase our production capacity. In particular, more than 70% of our capital expenditures were made in order to increase capacity for EZ-Fill vials and syringes, acquire new machinery (including bulk lines for vials) and in connection with the construction of our new plant in Piombino Dese. We also invested in R&D and strengthening the security of our IT systems.
Cash used in financing activities
Net cash used in financing activities was 19.8 for the three month ended March 31, 2021 (compared to 3.0 generated from financing activities for the three month ended March 31, 2020) and 26.5 million for the year ended December 31, 2020 (compared to 42.2 million generated from financing activities for the year ended December 31, 2019). As of March 31, 2021, 4.1 million related to new borrowings and 11.4 million to loan repayment. Dividends distributed amounted to 11.2 million while payment of the principal portion of lease liabilities was 1.6 million.
80
Net change in cash and cash equivalents
The net change in cash and cash equivalents was 36.4 for the three month ended March 31, 2021 (compared to 30.1 for the three month ended March 31, 2020) and 33.1 million for the year ended December 31, 2020, compared to 10.4 million for the year ended December 31, 2019.
Off balance sheet arrangements
Off-balance sheet arrangements may be summarized as follows:
December 31, 2019 | December 31, 2020 | |||||||
(in millions) | ||||||||
Guarantees |
74.9 | 86.6 | ||||||
of which secured |
4.7 | 4.7 |
As of December 31, 2020, we issued guarantees to third parties for 86.6 million in the ordinary course of business. Such amount includes advance payment and performance bonds as well as suretyships and letters of comfort to financial institutions on outstanding short-term facilities in favor of foreign subsidiaries; some of which include floating charges for 4.7 million.
Contractual Obligations and Commitments
The following table summarizes payments due under our contractual obligations and commitments at December 31, 2020:
Due within one year | Due between one and three years |
Due between four and five years |
Due beyond five years |
Total | ||||||||||||||||
(in million) | ||||||||||||||||||||
Borrowings(1) |
61.9 | 131.5 | 84.8 | 8.0 | 286.2 | |||||||||||||||
Notes |
(0.1 | ) | (0.1 | ) | (0.1 | ) | 49.9 | 49.6 | ||||||||||||
Lease liabilities(2) |
5.4 | 8.5 | 5.1 | 6.6 | 25.6 | |||||||||||||||
Other liabilities(3) |
52.6 | 1.7 | | 0.1 | 54.4 | |||||||||||||||
Employee Benefits |
| 21.3 | 8.4 | | 29.7 | |||||||||||||||
|
|
|
|
|
|
|
|
|
|
|||||||||||
Total liabilities |
119.8 | 162.9 | 98.2 | 64.6 | 445.5 | |||||||||||||||
|
|
|
|
|
|
|
|
|
|
(1) | Represents the cash flow for loan repayment obligations, including amortized cost effect and bank overdrafts for Euro 0.6 million, relating to bank loans. The loans include provisions which may accelerate the reimbursement plan of the obligations, such as in case of breach of covenants, change of control or cross default. |
(2) | Represents the discounted cash flow for lease obligations relating mainly to manufacturing facilities, plant and machinery and IT infrastructure, vehicles and other tangible assets. |
(3) | Represents other liabilities reflected on our balance sheet and, in particular, payables to personnel and social security institutions as well as allowance for future expected customer returns and put option liabilities. |
Recently Adopted Accounting Pronouncements
A description of recently issued accounting pronouncements that may potentially impact our financial position, result of operations or cash flows is disclosed in Note 3 to our audited consolidated financial statements included elsewhere in this prospectus.
Quantitative and Qualitative Disclosures about Market Risk
The Group is exposed to the following financial risks connected with its operations:
| financial market risk, mainly relating to foreign currency exchange rates and to interest rates; |
81
| liquidity risk, with particular reference to the availability of funds and access to the credit market, should the Group require it, and to financial instruments in general; |
| credit risk, arising both from its normal commercial relations with customers, and its financing activities. |
These risks could significantly affect our financial position, results of operations and cash flows, and for this reason we identify and monitor them, in order to detect potential negative effects in advance and take the necessary action to mitigate them, primarily through our operating and financing activities and if required, through the use of derivative financial instruments.
The following section provides qualitative and quantitative disclosures regarding the effect that these risks may have upon us. The quantitative data reported in the following section does not have any predictive value.
Financial market risks
Due to the nature of our business, we are exposed to a variety of market risks, including foreign currency exchange rate risk and, to a lesser extent, interest rate risk.
Our exposure to foreign currency exchange rate risk arises from our global footprint (both in terms of productions and commercialization), as in some cases we sell our products in the currencies of the destination markets, which may differ from the currency of the countries the Group operates in.
Our exposure to interest rate risk arises from the need to fund certain activities and the possibility to deploy surplus funds. Changes in market interest rates may have the effect of either increasing or decreasing our net profit/(loss), thereby indirectly affecting the costs and returns of financing and investing transactions.
These risks could significantly affect our performance, and are therefore identified and monitored. We have in place various risk management policies, which primarily relate to foreign exchange, interest rate and liquidity risks.
In particular, to manage foreign exchange rate risk, we have adopted a hedging policy. Hedging activities are mainly executed at the corporate level, based on the information provided by the reporting system and utilizing instruments and policies conforming to IFRS. Hedging is undertaken to ensure protection in case an entity has transactions in currencies other than the one in which it primarily does business, also taking account of budgeted future revenues and costs. Despite hedging operations, sudden movements in exchange rates or erroneous estimates may result in a negative impact, although limited, on our results.
Information on foreign currency exchange rate risk
We are exposed to risk resulting from fluctuations in foreign currency exchange rates, which can affect our earnings and equity. In particular:
| where a Group company incurs costs in a currency different from that of its revenues, any change in foreign currency exchange rates can affect the operating results of that company. |
| The main foreign currency to which we are exposed is the U.S. Dollar for sales in the United States and other markets where the U.S. Dollar is the reference currency, against Euro, Mexican Pesos and Renminbi. Other significant exposures included the exchange rate between the Euro and the following currencies: Renminbi, Japanese Yen, Danish Krone, British Pound and Swiss Franc. Only U.S. Dollar exposure, taken individually, exceeded 10% of the Groups total foreign currency exchange rate exposure for commercial activity in 2020. It is our policy to use derivative financial instruments (primarily forward currency contracts, currency swaps, currency options and collar options) to hedge against exposures. |
82
| Several subsidiaries are located in countries that are outside the Eurozone, in particular the United States, China, Japan, Mexico, Denmark, Brazil and Switzerland. As our reporting currency is the Euro, the income statements of those companies are translated into Euros using the average exchange rate for the period and, even if revenues and margins are unchanged in local currency, changes in exchange rates can impact the amount of revenues, costs and profit as restated in Euros. Similarly, intercompany financing may lead to foreign exchange rate impact due to different functional currencies. |
| The assets and liabilities of consolidated companies that report in a currency other than the Euro may vary from period to period as a result of changes in exchange rates. The effects of these changes are recognized directly in equity as a component of other comprehensive income/(loss) under gains/(losses) from currency translation differences. |
We monitor our main exposures with regard to translation exchange risk, whereby fluctuations in the exchange rates of a number of currencies against the consolidation currency may impact the consolidated financial statement values, although there was no specific hedging in this respect at December 31, 2019.
Exchange differences arising from the settlement of monetary items are recognized in the consolidated income statement within the net financial income/(expenses) line item.
The impact of foreign currency exchange rate differences recorded within financial income/(expenses) for the year ended December 31, 2020, except for those arising from financial instruments measured at fair value, amounted to net losses of 0.4 million (compared to 0.6 million in 2019).
There have been no substantial changes in 2020 in the nature or structure of exposure to foreign currency exchange rate risk or in the Groups hedging policies.
We actively hedge against economic-transactional risk; more specifically, forward and swap contracts, plain vanilla and collar options are used to manage the exposures. Such instruments are not currently designated as cash flow hedges and contracts are entered for a period consistent with the underlying transactions, generally ranging from three to twelve months.
The following is a list of contracts as of December 31, 2020:
( millions) |
0 to 6 months |
6 to 9 months |
9 to 12 months |
Total | Carrying amount |
Line item in the statement of | ||||||||||||||||||
Notional amount |
Forward | 19.554 | 19.55 | (12 | ) | current financial liabilities | ||||||||||||||||||
Average forward rate (EUR/DKK) |
7.447 | | ||||||||||||||||||||||
Notional amount |
Forward | 6.246 | 6.25 | 19 | other current financial assets | |||||||||||||||||||
Average forward rate (EUR/USD) |
1.230 | | ||||||||||||||||||||||
Notional amount |
Forward | 1.203 | 1.20 | (3 | ) | current financial liabilities | ||||||||||||||||||
Average forward rate (EUR/CHF) |
1.082 | |||||||||||||||||||||||
Notional amount |
Forward | 1.008 | 1.01 | (0 | ) | current financial liabilities | ||||||||||||||||||
Average forward rate (EUR/JP1) |
126.55 | |||||||||||||||||||||||
|
|
|
|
|||||||||||||||||||||
Total |
28.01 | 4 | ||||||||||||||||||||||
|
|
|
|
83
The following is a list of contracts as of December 31, 2019:
( millions) |
0 to 6 months |
6 to 9 months |
9 to 12 months |
Total | Carrying amount |
Line item in the statement of | ||||||||||||||||||
Notional amount |
Forward | 2.67 | 7.121 | 11.465 | 21.25 | 308 | other current financial assets | |||||||||||||||||
Average forward rate (EUR/USD) |
1.119 | 1.125 | 1.131 | |||||||||||||||||||||
Notional amount |
Option | 3.561 | 3.561 | 3.561 | 10.68 | 109 | other current financial assets | |||||||||||||||||
Average forward rate (EUR/USD) |
1.16 | 1.17 | 1.16 | |||||||||||||||||||||
Notional amount |
Forward | 11.912 | 11.91 | (6 | ) | current financial liabilities | ||||||||||||||||||
Average forward rate (EUR/DKK) |
7.460 | |||||||||||||||||||||||
Notional amount |
Forward | 1.198 | 1.198 | (4 | ) | current financial liabilities | ||||||||||||||||||
Average forward rate (EUR/CHF) |
1.085 | |||||||||||||||||||||||
Notional amount |
Forward | 1.046 | 1.046 | 5 | other current financial assets | |||||||||||||||||||
Average forward rate (EUR/JP1) |
121.62 | |||||||||||||||||||||||
Notional amount |
Forward | 189 | 189 | 0 | other current financial assets | |||||||||||||||||||
Average forward rate (EUR/CNY) |
7.901 | |||||||||||||||||||||||
|
|
|
|
|||||||||||||||||||||
Total |
46.28 | 41 | ||||||||||||||||||||||
|
|
|
|
Information on interest rate risk
This risk stems from variable rate loans, for which sudden or significant interest rate fluctuations may have a negative impact on economic results. The monitoring of this risk is carried out at the corporate level and utilizes similar structures as those employed for the management of currency risks. We have hedges in place against interest rate risk, covering nearly all the loans contracted. Due to these operations, we have established a substantially fixed rate at improved conditions compared to the previous loans.
Our most significant floating rate financial assets at December 31, 2020 are cash and cash equivalents and certain financial current investments.
The financial liabilities composition and the impact of the hedging instrument on the statement of financial position as at December 31, 2020 and December 31, 2019 are as follows:
As of December 31, 2020
( millions) |
Interest Rate Swap |
Fixed Interest |
Floating Interest |
Amortized Cost Effect |
Total | Mark to Market IRS Derivatives |
||||||||||||||||||
Bank loans |
229.8 | 12.8 | 44.4 | (0.7 | ) | 286.3 | (4.4 | ) | ||||||||||||||||
Bank overdrafts |
0.5 | | 0.5 | |||||||||||||||||||||
Financial payables for share acquisition |
7.9 | | 7.9 | |||||||||||||||||||||
Financial liabilities with related parties |
| 1.0 | | | 1.0 | |||||||||||||||||||
Notes |
| 50.0 | | (0.4 | ) | 49.6 | ||||||||||||||||||
|
|
|
|
|
|
|
|
|
|
|
|
|||||||||||||
Total |
229.8 | 63.8 | 52.8 | (1.1 | ) | 345.3 | (4.4 | ) | ||||||||||||||||
|
|
|
|
|
|
|
|
|
|
|
|
|||||||||||||
Percentage on Total |
67 | % | 18 | % | 15 | % |
84
As of December 31, 2019
( millions) |
Interest Rate Swap |
Fixed Interest |
Floating Interest |
Amortized Cost Effect |
Total | Mark to Market IRS Derivatives |
||||||||||||||||||
Bank loans |
270.7 | 13.1 | 63.7 | (1.1 | ) | 346.4 | (3.7 | ) | ||||||||||||||||
Bank overdrafts |
2.1 | | 2.1 | |||||||||||||||||||||
Financial payables for share acquisition |
6.7 | | 6.7 | |||||||||||||||||||||
Financial liabilities with related parties |
| 1.0 | | | 1.0 | |||||||||||||||||||
|
|
|
|
|
|
|
|
|
|
|
|
|||||||||||||
Total |
270.7 | 14.1 | 72.5 | (1.1 | ) | 356.2 | (3.7 | ) | ||||||||||||||||
|
|
|
|
|
|
|
|
|
|
|
|
|||||||||||||
Percentage on Total |
76 | % | 4 | % | 20 | % |
The risk arising from the net investment in foreign subsidiaries is monitored; no active hedging is currently being performed. With regard to commodity risk, we enter into fixed-price contracts for certain utilities.
Set out below is the impact of hedging on equity in cash flow hedge reserve:
2020 | ||||
( millions) | ||||
As at January 1 |
2.8 | |||
Interest Rate Swap |
0.7 | |||
Tax effect |
(0.2 | ) | ||
|
|
|||
As at December 31 |
3.3 | |||
|
|
The following table presents an analysis of sensitivity to a change in (i) interest rates on the portion of loans and borrowings affected, and (ii) exchange rates for the currencies we are majorly exposed to. With all other variables held constant, our marginality is affected as follows:
As at December 31, 2020
Interest rate sensitivity
Increase/decrease |
Effect on profit | |||||
+20 BP |
-20 BP | (21) | 11 | |||
+50 BP |
-50 BP | (111) | 26 | |||
+100 BP |
-100 BP | (406) | 53 |
Exchange rate sensitivity
Increase/decrease in % points |
Effect on EBITDA, millions |
|||||||||||||||
Euro |
1% | -1% | (0.9 | ) | 0.9 | |||||||||||
U.S. dollar |
3% | -3% | (2.5 | ) | 2.7 | |||||||||||
5% | -5% | (4.1 | ) | 4.6 | ||||||||||||
Euro |
1% | -1% | 0.1 | (0.1 | ) | |||||||||||
Mexican Pesos |
3% | -3% | 0.4 | (0.4 | ) | |||||||||||
5% | -5% | 0.6 | (0.7 | ) |
85
As at December 31, 2019
Interest rate sensitivity
Increase/decrease |
Effect on profit | |||||
+20 BP |
-20 BP | (19) | 19 | |||
+50 BP |
-50 BP | (195) | 46 | |||
+100 BP |
-100 BP | (588) | 93 |
Exchange rate sensitivity
Increase/decrease in % points |
Effect on EBITDA, millions |
|||||||||||||||
Euro |
1% | -1% | (0.6 | ) | 0.6 | |||||||||||
U.S. dollar |
3% | -3% | (1.8 | ) | 1.9 | |||||||||||
5% | -5% | (2.9 | ) | 3.2 | ||||||||||||
Euro |
1% | -1% | 0.1 | (0.1 | ) | |||||||||||
Mexican Pesos |
3% | -3% | 0.4 | (0.4 | ) | |||||||||||
5% | -5% | 0.7 | (0.7 | ) |
Liquidity risk
Liquidity risk arises if we are unable to obtain the funds needed to carry out our operations under economic conditions. The main determinant of our liquidity position is the cash generated by or used in operating and investing activities.
From an operating point of view, we manage liquidity risk by monitoring cash flows and keeping an adequate level of funds at our disposal. The main funding operations and investments in cash and marketable securities of the Group are centrally managed or supervised by the treasury department with the aim of ensuring effective and efficient management of our liquidity. We undertake medium and long-term loans to fund medium and long-term operations. We undertake a series of activities centrally supervised with the purpose of optimizing the management of funds and reducing liquidity risk, such as:
| centralizing liquidity management; |
| maintaining a conservative level of available liquidity; |
| diversifying sources of funding of medium and long-term financing; |
| obtaining adequate credit lines; |
| monitoring future liquidity requirements on the basis of budget forecast and cash flow planning; |
| monitoring covenants on indebtedness. |
Intercompany financing is conducted at arms length terms and normally involves the holding company. These measures currently sufficiently guarantee, under normal conditions and in the absence of extraordinary events, the degree of flexibility required by movements of working capital, investing activities and cash flows in general.
We believe that our total available liquidity (defined as cash and cash equivalents plus undrawn committed credit lines and marketable securities), in addition to funds that will be generated from operating activities, will enable us to satisfy the requirements of our investing activities and working capital needs and ensure an appropriate level of operating and strategic flexibility. We, therefore, believe there is no significant risk of a lack of liquidity.
86
Credit risk
Credit risk is the risk of economic loss arising from the failure to collect a receivable. Credit risk encompasses the direct risk of default and the risk of a deterioration of the creditworthiness of the counterparty. The maximum credit risk to which we are theoretically exposed is represented by the carrying amounts of the financial assets stated in the consolidated statement of financial position sheet.
Where customers fail to meet payment deadlines, our financial position may deteriorate. Socio-political events (or country risks) and the general economic performance of individual countries or geographical regions may also assume significance in this respect. The credit risk is however mitigated by consolidated commercial relations with well capitalized multinational pharmaceutical and biologics companies and our guidelines created for the selection and evaluation of the client portfolio, which may require, where possible and appropriate, further guarantees from customers. In 2020, our days sales outstanding decreased by 16.6 to 70.5, compared to 2019.
Trade receivables as of December 31, 2020 amounting to 135.5 million (compared to 135.4 million as of December 31, 2019) are shown net of the allowance for doubtful accounts amounting to 7.7 million (compared to 7.4 million as of December 31, 2019).
Critical Accounting Policies and Significant Judgments and Estimates
The Consolidated Financial Statements are prepared in accordance with IFRS which require Managements use of estimates and assumptions that may affect the carrying amount of assets, liabilities, income and expenses in the financial statements, as well as the disclosures in the notes concerning contingent assets and liabilities at the balance sheet date. Uncertainty about these assumptions and estimates could result in outcome that require material adjustments to the carrying amount of assets or liabilities affected in future periods.
Estimates are based on historical experience and other factors. The resulting accounting estimates could differ from the related actual results. Estimates are periodically reviewed and the effects of each change are reflected in the consolidated statement of profit or loss or in the consolidated statement of comprehensive income in the period in which the change occurs.
Revenue Recognition
We operate in several jurisdictions and assesses whether contracts with customers provide it with the right to consideration for the performance fulfilled based on legal assessment of applicable contracts and other source of enforceable rights and obligations (i.e., local regulations). With regard to revenue from contracts with customers for contract work and contract assets and liabilities, application of the cost-to-cost method requires a prior estimate of the entire lifetime costs of individual projects, updating them at each balance sheet date. This entails assumptions that can be affected by multiple factors, such as the time over which some projects are developed, their high level of technology and innovative content, the possible presence of price variations and revisions, and machinery performance guarantees, including an estimate of contractual risks, where applicable. These facts and circumstances make it difficult to estimate the cost to complete projects and, consequently, to estimate the value of contract work in progress at the balance sheet date. The Group estimates variable considerations to be included in the transaction price for the sale of products with rights of return and volume rebates. The Group forecasts sales returns using the historical return data to project expected return percentages. These percentages are applied to determine the expected value of the variable consideration.
Recoverable amount of goodwill
The impairment test on goodwill is carried out by comparing the carrying amount of cash-generating units and their recoverable amount. The recoverable amount of a cash-generating unit is the higher of fair value, less
87
costs to sell, and its value in use. This complex valuation process entails the use of methods such as the discounted cash flow method which uses assumptions to estimate cash flows. The recoverable amount depends significantly on the discount rate used in the discounted cash flow model as well as the expected future cash flows and the growth rate used for the extrapolation.
Development costs
The amortization of development costs requires management to estimate the lifecycle of related products. Any changes in such assumptions would impact the amortization charge recorded and the carrying amount of capitalized development costs. The periodic amortization charge is derived after determining the expected lifecycle of the related product. Increasing an assets expected lifecycle or its residual value would result in a reduced amortization charge in the consolidated income statement. The useful lives of our development costs are determined by management at the time of capitalization and reviewed annually for appropriateness and recoverability.
Employee benefit liabilities
Employee benefits, especially the provision for employee severance indemnities and other long-term incentives, are calculated using actuarial assumptions; changes in such assumptions could have a material impact on such liabilities.
Leases
We cannot readily determine the interest rate implicit in the lease, therefore, the incremental borrowing rate (IBR) to measure lease liabilities is used. The IBR is the rate of interest that we would have to pay to borrow over a similar term, and with a similar security, the funds necessary to obtain an asset of a similar value to the right-of-use asset in a similar economic environment. The IBR therefore reflects what the Group would have to pay, which requires estimation when no observable rates are available (such as for subsidiaries that do not enter into financing transactions) or when they need to be adjusted to reflect the terms and conditions of the lease (for example, when leases are not in the subsidiarys functional currency). We estimate the IBR using observable inputs (such as market interest rates) when available and are required to make certain entity-specific estimates (such as the subsidiarys stand-alone credit rating). We also determine the lease term as the non-cancellable term of the lease, together with any periods covered by an option to extend the lease if it is reasonably certain to be exercised, or any periods covered by an option to terminate the lease, if it is reasonably certain not to be exercised. The Group applies judgment in evaluating whether it is reasonably certain whether or not to exercise the option to renew or terminate the lease. That is, we consider all relevant factors that create an economic incentive for us to exercise either the renewal or termination.
Provision for expected credit losses of trade receivables and contract assets
We use a simplified approach in calculating estimated credit losses (ECLs) for trade receivables and contract assets, initially based on the Groups historical observed default rates. At every reporting date, the historical observed default rates are updated and changes in the forward-looking estimates are analyzed. The assessment of the correlation between historical observed default rates, forecast economic conditions and ECLs is a significant estimate. The amount of ECLs is sensitive to changes in circumstances and of forecast economic conditions. Our historical credit loss experience and forecast of economic conditions may also not be representative of the customers actual default risk in the future.
Income tax expense (current and deferred)
The consolidated Group is subject to various taxes in multiple jurisdictions. The determination of tax liabilities requires the use of assumptions with respect to transactions whose fiscal consequences are not yet
88
certain at the end of the reporting period. Calculation of taxes on a global scale requires the use of estimates and assumptions based on the information available at the balance sheet date. The deferred tax asset realization is dependent upon the generation of future taxable income during the periods in which those temporary differences become deductible and the tax loss carry forwards are utilized. Estimating future taxable income requires estimates about matters that are inherently uncertain and requires significant management judgment, and different estimates can have a significant impact on the outcome of the analysis.
89
Overview
We are a leading global provider of drug containment, drug delivery and diagnostic solutions to the pharmaceutical, biotechnology and life sciences industries. We deliver an integrated, end-to-end portfolio of products, processes and services that address customer needs across the entire drug life cycle at each of the development, clinical and commercial stages. Our core capabilities in scientific research and development, our commitment to technical innovation and our engineering excellence are central to our ability to offer value added solutions to our clients.
We have secured a leadership position within the drug development and delivery value chain through our investment in research and development and the expansion of our global footprint and capabilities. Over our 70-year history, we have earned a leading reputation for high quality and reliability that has enabled us to become a partner of choice for more than 700 companies globally, including 41 of the top 50 pharmaceutical companies (which comprise all of the top 15), and eight of the top ten in-vitro diagnostic companies, as measured by 2020 revenue, according to data collected by Global Data. We also serve 15 of the top 20 biotechnology companies by market capitalization in the NASDAQ Biotechnology Index and over 100 biotechnology customers in total.
Our priority is to provide flexible solutions that preserve the integrity of pharmaceutical products and enable our customers to deliver safe and effective treatments to patients while reducing time to market, total cost of ownership (i.e., logistics, drug product waste, storage and personnel costs) and supply chain risk. We achieve this by developing our products in close collaboration with our customers, leveraging our scientific research capabilities, technical expertise and engineering and manufacturing excellence to meet their quality requirements.
Our solutions are highly integrated with the development, production and commercialization processes of our customers. In addition to manufacturing drug containment and delivery solutions, we provide a full set of services across all stages of drug development, from pre-clinical to clinical and commercialization. We also engineer machinery and equipment for the production of drug containment and delivery systems that can be integrated into both our customers and our own manufacturing processes. Our involvement at each stage of a drugs life cycle, together with the breadth of our offering, enables us to serve as a one-stop-shop for our customers, which we believe represents a significant competitive advantage. The chart below illustrates our presence across the pharmaceutical value chain.
We operate across the healthcare industry and serve some of its fastest growing segments, including biologics, biosimilars, vaccines and molecular diagnostics. As a result of how closely integrated we are in the drug production and delivery supply chain, we are well-positioned to benefit from secular trends within our target industries, such as increases in demand resulting from pharmaceutical innovation, acceleration and expansion of vaccination programs, growth of biologics/biosimilars, self-administration of medicines, aging demographics and increasing quality standards and regulation.
90
We estimate that our total addressable market, based on our current offering, exceeds $11 billion, in terms of revenue generated by all market participants in 2020, and consists of biopharmaceutical injectables and in-vitro diagnostic products. Within each of these markets, we operate in some of the fastest growing segments, including pre-fillable syringes, drug delivery systems, molecular diagnostics and assembly equipment. We believe there are opportunities to further expand our addressable markets, including by targeting (i) complementary containment solutions, (ii) additional delivery systems, (iii) complementary engineering solutions, and (iv) aftersales support and services.
We operate our business in two segments:
| Biopharmaceutical and Diagnostic Solutions, which includes all the products, processes and services developed and provided for the containment and delivery of pharmaceutical and biotechnology drugs and reagents, as well as the production of diagnostic consumables; and |
| Engineering, which includes all of the equipment and technologies developed and provided to support the end-to-end pharmaceutical, biotechnology and diagnostic manufacturing processes (assembly, visual inspection, packaging and serialization and glass converting). |
In 2020, we generated approximately 85% of total sales from our Biopharmaceutical and Diagnostic Solutions segment and approximately 15% from our Engineering segment. The figure below provides a breakdown of our segments, as well as the business lines included within each segment.
We refer to premium products in the Biopharmaceutical and Diagnostic Solutions segment as our high-value solutions. High-value solutions are wholly owned, internally developed products, processes and services for which we hold intellectual property rights or have strong proprietary know-how, and that are characterized by particular complexity and high performance. Our high-value solutions deliver significant benefits to customers in terms of time-to-market and reduced total cost of ownership. Among our key high-value solutions is our EZ-Fill® line of ready-to-fill injectable products, which can be customized to clients needs. For additional information on EZ-Fill® see BusinessBusiness SegmentsBiopharmaceutical and Diagnostic SolutionsContainer Closure Systems (CCS).
We have nine production plants for manufacturing and assembling pharmaceutical and healthcare products across Europe (Italy, Germany and Slovakia) and the rest of the world (Brazil, China, Mexico and the United
91
States), five plants for the production of machinery and equipment (Italy and Denmark), two sites for analytical services (Italy and the United States) and two commercial offices (Japan and the United States). Our manufacturing facilities in Mexico (serving the U.S. market), China and Brazil are greenfield operations established by us. Our manufacturing facilities in Slovakia, Denmark, Germany and the United States were acquired in strategic transactions over the past 15 years. Our global footprint, together with our proprietary, highly standardized manufacturing systems and processes, allow us to provide quality consistent products and services to our customers in more than 70 countries.
Since the outbreak of COVID-19, we have increased production capacity to support our customers efforts to provide a rapid response to COVID-19. In this context we have been providing: (i) glass vials and syringes to approximately 90% of the currently marketed vaccine programs, according to our estimates based on public information (WHO, EMA, FDA); (ii) diagnostic solutions for the detection and diagnosis of COVID-19; (iii) glass forming lines, which are being installed worldwide, to facilitate the distribution of glass bulks and sterile vials and syringes; and (iv) visual inspection systems. COVID-19 has generated increased demand for our products and services, further enabling us to accelerate our growth strategy.
History
In 1949, Giovanni Stevanato founded Soffieria Stella, a specialty glass manufacturer, in Venice. Soffieria Stella, the precursor to Stevanato Group, operated until 1959, when Stevanato Group was established in Piombino Dese (Padua). Over the last 70 years, we have evolved from an Italian glassware manufacturer to a leading global provider of integrated solutions for the healthcare industry. Our growth has been driven by the internal development of new containment and delivery solutions as well as strategic acquisitions, enabling us to broaden our offering, our technical know-how and our international footprint.
We began our international expansion in 2005, with the acquisition of Medical Glass, a Slovakia based primary packaging manufacturing company. Subsequently, in 2007 and 2013, we acquired an Italian company, Optrel, and a Danish company, Innoscan. Both specialize in the production of inspection machines. These acquisitions marked our entry into the technology and equipment manufacturing business. In 2016, we pursued further expansion of our offering through the acquisition of: (i) Balda, a company specialized in developing and manufacturing plastic diagnostic consumables, drug delivery systems and medical components; (ii) SVM, a company specialized in the production of high-technology machines and systems for assembly, packaging and serialization of pharmaceutical products; and (iii) Medirio, a start-up developing patents and other intellectual property for the wearable injectors business.
92
We currently market our products, processes and services under the following brands: (i) SG Ompi, for primary containment solutions; (ii) SG Spami, for glass converting solutions; (iii) SG Lab, for analytical services; (iv) SG Balda, for diagnostic and drug delivery solutions; (v) SG Optrel and SG Innoscan, for visual inspection solutions; and (vi) SG SVM, for assembly, packaging and serialization. In the coming years, we plan to consolidate our offering under a single SG brand.
In parallel with our acquisition strategy, we regularly review our operations in the context of our organic growth plan. As a result of these ongoing assessments, we have expanded our offering through new departments, new laboratories, new offices and new plants. In 2019, we opened a new building in Piombino Dese (Italy) to increase our syringes production capacity and since 2008, we have opened three greenfield sites in (i) Monterrey, Mexico in 2008; (ii) Zhangjiagang, China in 2012; and (iii) Sete Lagoas, Brazil in 2017.
Our Industry and Growing End Market
We are a key partner to leading companies in the pharmaceutical, biotechnology and life sciences industries, serving as one of the preeminent providers of drug containment, drug delivery and diagnostic solutions to these end markets.
We estimate that our total addressable market, based on our current portfolio of products and services comprising container closure systems, drug delivery systems, IVD solutions, and engineering, exceeds $11 billion in terms of 2020 revenue.
Container closure systems and drug delivery systems represent mission-critical components of the pharmaceutical and biotechnology value chain for injectable drugs, which are produced for the treatment of a wide range of diseases from diabetes to cancer and other chronic conditions. Due to our competitive standing, we believe that we are well positioned to capitalize on several major demographic and technological trends generating growth in the global healthcare markets, including:
| an aging population globally; |
| increasing incidence of chronic diseases (e.g. diabetes); |
| continued innovation in biologic based therapies which are administered by injection; |
| expanded access to advanced healthcare in developing countries; |
| broader demand for vaccine programs; |
| increasing propensity of biotechnology companies to outsource non-core competencies; and |
| growth in self-injection systems where the primary container (i.e., glass containers) is integrated into the delivery device. |
We categorize our addressable market by direct markets and end markets. Our direct markets comprise various products and product categories in which we directly participate, such as container closure systems. Our end markets include the broader sectors from which we see demand for our products and services, such as vaccines and biologics.
93
Direct Markets
We serve the following direct markets:
Container Closure Systems (CCS)
The CCS market includes the markets for pre-fillable syringes (PFS), vials, cartridges and ampoules. Based on data collected by IQVIA, we estimate the total addressable market of CCS solutions to be approximately $2.8 billion as of 2020, expected to grow at a Compounded Annual Growth Rate (CAGR) of approximately 6% to 7% through 2024. Growth in the CCS market is driven by the increasing number of new drug launches by biotechnology innovators and international vaccine programs, both of which are expected to generate continued demand for pre-fillable syringes and cartridges. Customers in this market increasingly seek out ready-to-use products which include pre-sterilized offerings and ready-to-use packaging (PFS, vials, ampoules and cartridges) that provide higher flexibility, lower total cost of ownership and reduced time to market. In addition to these underlying drivers, the impact of COVID-19 and international vaccination programs are expected to produce further volume growth in pre-fillable syringes and vials. We have significant exposure to the highest-growth segments of the CCS market, with pre-fillable syringe and vial sub-segments estimated to grow at a CAGR of 8% to 9% and 7% to 8%, respectively.
Drug Delivery Systems (DDS)
Our addressable market in DDS, including both Contract Manufacturing Organizations and Contract Development and Manufacturing Organizations, consists of pen-injectors, dry powder inhalers, auto injectors, and non-insulin wearable devices. Based on data collected by IQVIA and Roots Analysis, we estimate the total addressable market for DDS, including proprietary and contract development manufacturing services, to be approximately $1.3 billion as of 2020, expected to grow at a CAGR of approximately 5% to 7% through 2024. Growth in the DDS market is also driven by increased demand for pen-injectors and dry powder inhalers for large, established drug classes such as insulin, as well generics and biosimilars. The increasing prevalence of diabetes and asthma, as well as expanded access to treatments for these conditions support continued growth in these markets.
In-Vitro Diagnostic (IVD) Solutions
The IVD solutions market consists of diagnostic devices and consumables for point-of-lab and point-of-care use. Based on data collected by Alira Health, we estimate the total addressable market for IVD solutions to be approximately $6.2 billion as of 2020, expected to grow at a CAGR of approximately 5% to 6% through 2024. Our IVD solutions are mainly utilized in molecular diagnostics, immunoassays and clinical chemistry development and manufacturing. Molecular diagnostics growth is primarily driven by technology advancements, with increasing need for sensitivity and specificity in testing. Immunoassay growth is driven by increasing impact of infectious disease and oncology testing. Finally, clinical chemistry consists of testing conducted by established large market participants. Both growing and established companies increasingly utilize cost-efficient manufacturing partners with expertise in design and manufacturing. We increasingly target the market for molecular diagnostics within IVD solutions, which we estimate to be growing faster than the broader market for IVD solutions at a CAGR of approximately 9% to 11% through 2024, based on Alira Health Analysis.
94
Pharmaceutical & IVD Engineering
Our pharmaceutical and IVD engineering addressable market consists of assembly, visual inspection, packaging and serialization and glass converting machines. According to Alira Health and Markets and Markets Research Pvt Ltd. analysis, the total addressable market of pharmaceutical and IVD engineering was approximately $0.9 billion as of 2020, expected to grow at a CAGR of approximately 4% to 5% through 2024. This market requires critical engineering know-how developed over numerous years as well as regulatory approvals to market machinery. We expect increased regulatory scrutiny, trends toward more complex manufacturing systems, and the increase in digitalization and automation of manufacturing to continue driving growth in this segment. The market is expected to experience continued growth as the industry shifts towards enhanced service offerings and aftersales support. Consequently, aftersales services, including spare parts provisioning, machinery upgrades, periodic maintenance and warranty extensions, represent a critical portion of our growth derived from this segment. Within the pharmaceutical and IVD engineering market, we are increasingly targeting the market for assembly equipment, which we estimate to be growing at a CAGR of approximately 5% to 6% through 2024, based on Alira Health analysis.
Key End Markets
The key end markets that we serve include biopharmaceutical injectables, which represent the majority of our business, as well as the rapidly growing in-vitro diagnostic sector.
Biopharmaceutical Injectables
The biopharmaceutical injectables end market comprises multiple distinct injectable drug categories such as biologics, vaccines, generics and insulin. According to data collected by IQVIA, the market for biopharmaceutical injectables is expected to grow at a CAGR of approximately 5% to 7% through 2024, outpacing growth in topical and oral routes of administration.
We increasingly serve some of the fastest growing segments within biopharmaceutical injectables, such as:
| Biologics: a segment which, based on data collected by IQVIA, is expected to grow at a CAGR of approximately 7% and includes (i) antibodies and protein based therapies, the largest sub-segment of biologics, which is expected to grow at a CAGR of approximately 6% through 2024, based on data collected by IQVIA, driven by continued innovation, multiple product launches in niche and specialty markets and high unmet need; (ii) biosimilars, a smaller sub-segment which, based on IQVIA and Grand View Research data, is expected to grow at a CAGR of more than 10% through 2024; and (iii) cell and gene therapies, one of the fastest growing end markets in the pharmaceutical and biotechnology sectors, which is expected to grow at a CAGR of more than 30% through 2024, according to data collected by IQVIA, driven by continued innovation and funding; and |
| Vaccines: the global response to the COVID-19 pandemic has rapidly produced an international effort and broader focus around epidemic preparedness that is expected to drive growth in the vaccine injectables market. According to IQVIA, the injectable vaccines market is estimated to grow at a CAGR of approximately 11% through 2024. |
95
We also serve more mature and established markets such as:
| Generics: which according to data collected by IQVIA, is expected to grow at a CAGR of approximately 2%; |
| Insulin: where we continue to observe steady growth in insulin injectables, driven by rising incidence and prevalence of diabetes. Diabetes prevalence is expected to grow at a rate exceeding global population growth, driven by aging demographics and economies shifting from low-to-middle income status. According to IQVIA, the market for insulin based treatments is estimated to grow at a CAGR of approximately 2% through 2024; and |
| Other / Other Injectables: includes other injectable such as heparin and water for injection, as well as inhalation devices. |
In-Vitro Diagnostic
In-vitro diagnostic is an important and growing end-market where we participate with a focus on molecular diagnostics, point-of-care diagnostics and, increasingly, infectious diseases and oncology. With an increasing number of diseases to which molecular diagnostic technology and rapid advances in genomics can be applied, the molecular diagnostics end market is expected to continue to experience high growth. Additionally, the impact of COVID-19 has highlighted the growing importance of advanced diagnostics capabilities, contributing to further growth in this market.
Based on Alira Health and Evaluate MedTech market data, within the in-vitro diagnostic end market is expected to grow at a CAGR of approximately 5% to 7% through 2024, molecular diagnostics showing a higher growth rate of approximately 10%.
Our Competitive Strengths
We have secured a leadership position as a critical solutions provider in the drug development and delivery value chain. Our integrated offering and track record of operational excellence has made us a partner of choice to the pharmaceutical, biotechnology and life sciences industries. We benefit from several competitive advantages that we believe will allow us to continue to deliver for customers and remain at the forefront of the markets in which we operate. The following are our key competitive strengths:
Leading global provider of mission-critical containment, delivery and diagnostic solutions for the pharmaceutical, biotechnology and life sciences industries
We are a recognized leader in providing mission-critical containment, delivery and diagnostic solutions to the pharmaceutical, biotechnology and life sciences industries. We operate on a global scale, offering our
96
products, processes and services in more than 70 countries. We serve a large and diversified customer base, including many of the worlds largest pharmaceutical, biotechnology and diagnostics companies, contract manufacturers and producers of glass packaging. Our customer base comprises more than 700 companies globally, including 41 of the top 50 pharmaceutical companies (which comprise all of the top 15), and eight of the top ten in-vitro diagnostic companies, as measured by 2020 revenue according to data collected by Global Data. We also serve 15 of the top 20 biotechnology companies by market capitalization in the NASDAQ Biotechnology Index and over 100 biotechnology customers in total.
As a partner of choice to the pharmaceutical and biotechnology industries, our solutions have been widely adopted, giving us a leading position in several high growth segments of the pharmaceutical and biotechnology injectables market, including in biologics, biosimilars and vaccines. Within each of these markets, we operate in some of the fastest growing segments, where, based on available market data, we believe we are a global top three player by revenues, including number two in pre-fillable syringes, number one in pre-sterilized EZ-Fill® vials and number one in pen cartridges.
Integrated end-to-end platform spans the drug lifecycle, from design and development through commercialization
We offer solutions to our clients at each stage of the drug development process, from research and development, through clinical trials and commercialization. Our fully integrated, end-to-end value proposition allows us to reduce lead time, total cost of ownership (i.e., logistics, drug product waste, storage and personnel costs) and supply chain risk for our customers, while improving the reliability and safety of drug products.
The breadth of our integrated capabilities differentiates us from our competitors as we believe we are the only player in the industry to be active in both the drug containment, delivery and diagnostic solutions, as well as the engineering segments. The extensive scope of solutions that we offer makes us an attractive partner to both small, emerging businesses, which may look to outsource a portion of their manufacturing process, as well as to mature, commercial stage drug development organizations, that require complex engineering solutions that can be integrated into their own production processes. By partnering with customers in the early development phase, we are in a prime position to play a key role as they add products to their pipelines and seek more advanced technical solutions. Our ability to seamlessly integrate our drug containment and delivery solutions with our engineering capabilities allows us to deliver significant value to our customers over time.
A common operating model in all our manufacturing facilities to uphold one consistent quality standard worldwide
Our manufacturing approach is based on the relentless pursuit of maximum efficiency and highest quality. Our manufacturing methods and processes are standardized as we utilize the same technology and adopt a common quality control approach across all of our production facilities. This allows us to provide consistent products, processes and services, both in terms of quality and time to market, to all of our customers from each of our manufacturing locations worldwide. It also gives us the flexibility, where needed, to distribute and balance production across our facilities (provided the facilities are validated by our customers), reducing waste and maximizing our efficiency as a group. Many of our customers access our products and services through a number of our facilities globally.
As a result of our commitment to manufacturing excellence and the breadth of our footprint, our customers view us as a functional extension of their operations. We are subject to rigorous audits by certification bodies and our customers, who perform more than 100 audits a year (other than 2020 which was affected by COVID-19 restrictions) on our manufacturing facilities. Further, given our reputation for reliability and our ability to establish new manufacturing facilities with the same standards as our existing ones anywhere in the world, our customers often coordinate with us to support their geographic expansion strategy by building out greenfield manufacturing facilities. This, in turn, provides us access to customers and allows us to further secure our long-term relationships with them.
97
Highly collaborative approach resulting in deeper strategic partnerships with clients and leading to high customer retention
We approach every customer relationship with the goal of partnering and adding value over a long time horizon, leveraging our technical expertise and our ability to collect analytical data to fully understand our customers objectives, needs and limitations. Drug containment and delivery solutions in particular are often borne out of years of collective effort with customers to develop the optimal manner of containing and delivering a drug product to patients. The customized solutions we provide vary depending on the characteristics and chemical composition of the pharmaceutical products, logistical needs (for example, ease of transport and shelf-life), patient community to which the drug product is primarily addressed (including, potentially, its geographic location) and specific regulatory requirements. The containment and delivery solutions that we provide are an integral part of the drug product itself and are included as part of the regulatory filings required to approve drug product marketing and commercialization. Providing high-quality products with specificity, sensitivity and consistency, coupled with extensive product validation data are fundamental drivers of customer loyalty. The quality and dependability of our drug containment and delivery solutions are critical to obtaining commercialization and marketing approval from regulatory agencies. As a result, it is often the case that drug product containment and delivery arrangements cannot be changed without amending the regulatory filing with the relevant agency. High switching costs and significant time delays are meaningful deterrents to a change in suppliers, which reinforces customer loyalty and strengthens customer retention. Over the past 10 years we have recorded a customer retention rate of approximately 97%.
Extensive scientific and engineering capabilities enable continuous innovation of proprietary products and processes
During our 70 year history, we have differentiated Stevanato Group by making significant ongoing investments in research and development to build our scientific, technical and engineering capabilities. We believe that customers rely on us because of our technical expertise, as well as our ability to design the best possible processes to meet their needs and the specifications required to effectively contain and deliver their drugs. As the needs of our clients evolve, we drive innovation within our proprietary products and processes to develop specialized or customized solutions. As a result of our investments in internal engineering capabilities, we own the most critical processes behind the products we manufacture and are able to respond faster to customer needs for new or customized products. Our engineering capabilities also allow us to scale up our production rapidly, where required, thereby reducing lead time for commercialization of drugs. Our research and development team comprises more than 100 highly skilled and specialized employees operating in our Italian (Piombino Dese and Milan), German (Bad Oeynhausen) and U.S. (Boston) facilities. We have an active pipeline of more than 50 ongoing R&D projects across all of our business segments. Our targeted investment in innovative products and technologies allows us to capture incremental pipeline opportunities and drive attractive growth, while delivering on our firm-wide commitment to provide the highest quality to customers.
Experienced board and executive leadership team with proven track record of excellence
We are led by an experienced and highly-motivated board of directors and executive leadership team with a proven track record of operational excellence. Our leadership team has consistently achieved results by responding to market developments and by capitalizing on opportunities for organic and inorganic growth. While our founding family continues to support our success and future growth as they have done since inception, we have, over the last several years, added to our board and executive team a number of professionals with decades of experience in the drug containment, delivery and diagnostics industries from all over the world. We believe that this has contributed greatly to our strategy building and execution capabilities by allowing us to gain a broader and more nuanced understanding of the market in which we operate, strengthening our ability to anticipate market trends and stay ahead of our competitors. Our strong corporate culture allows us to continuously expand these perspectives by adding diverse talent with deep knowledge and broad experience to our team.
98
Our Growth Strategy
We believe that the breadth and quality of our products and services offering, our technical understanding of the drug-material interface, our innovative engineering and manufacturing excellence position us well to serve our global pharmaceutical, biotechnology and life sciences customers. We focus on our customer needs and the market trends described in the Our Industry and Growing End Market section and tailor our growth strategy to such needs and trends.
Our growth strategy currently focuses on the following areas:
Expand our global market position in primary containment systems
We are determined to pursue attractive, organic growth trends in our core primary container business by investing in additional capacity to meet the growing demands of the expanding pharmaceutical, biotechnology and vaccine markets and continue to transition our customers to high-value solutions. We rely on a unique set of proprietary manufacturing processes to drive product innovations in our primary container business that benefit our customers. For example, EZ-Fill® containers enable our customers to reduce time to market, lower their overall cost of ownership and reduce supply chain risk By expanding our development capabilities and manufacturing capacity in North America, Europe and Asia to better serve our customers in our key end markets and support high-value solutions growth, we believe we will be able to continue developing our offering, particularly in biologics, to generate above-market growth and capture market share across our business segments. Our planned expansion also offers our customer base faster response time and supply chain redundancy, reducing risk for just in time manufacturing.
Leverage leadership in primary containment to build market position in drug delivery systems
We see a significant opportunity in the fast-paced evolution of drug delivery systems, especially in connection with biologic based therapies administered by injection. We believe that we can leverage this favorable trend in the drug delivery systems market by investing in further strengthening the integration of our drug containment and delivery capabilities in an effort to have the most compelling value proposition for our customers. In particular, we believe that by increasing the integration of our offering we can attract business from emerging biotechnology customers who have an increasing inclination to outsource the non-core phases of their development and manufacturing processes. We intend to strengthen our design and development capabilities to secure high-value contract development and manufacturing programs for drug delivery devices, also leveraging our positive track-record in the space and our ability to develop proprietary systems.
Accelerate market penetration in life sciences systems
Through focused marketing and business development activities, we intend to accelerate our market penetration in high-value, fast-growing life sciences segments, such as molecular and point-of-care diagnostics. With the increasing tendency of life sciences customers to outsource innovative design, development and assembly of specialized in-vitro diagnostic solutions, we believe that we can leverage our integrated capabilities and our ongoing efforts in design and development of such solutions to secure high-value projects from inception, therefore entering the market at an even earlier stage and capitalizing on new opportunities.
Increase our investments in research & development to address unmet market needs
Through continued investment in our R&D programs, we see opportunities to drive revenue and margin growth through processes that improve the quality and sustainability of our existing products. These investments are targeted at maintaining the stability, potency and purity of our customers products prior to administration. New therapies for diabetes, cancer and auto-immune diseases are based on large, complex molecules that are extremely sensitive to their storage environment. In many cases, our customers finished product formulations
99
are viscous and require drug delivery devices for administration to patients. Our products, such as EZ Fill®, reduce our customers drug containment risks, such as the ones mentioned above. We also see growing interest within our customer base in systems that detect tamper evidence, anti-counterfeiting, inventory track and trace capability, and in the case of devices, smart systems that allow patient data capture.
Easy-to-use, accurate, reliable self-injection systems for complex pharmaceutical and biotechnology products represent a particularly attractive market opportunity. We have built a portfolio of devices for this market that can be used off the shelf or customized to the specific needs of the customer.
We also see a growing market need for innovative containment and delivery systems for advanced cell and gene therapies. Effective solutions for these products will require innovative materials and coatings, system design and stability and compatibility testing, all of which are areas of strength for our development teams.
Build on our expertise in manufacturing, assembly and inspection systems for primary containers and complex, multi-component systems
Our market leading expertise in the design and manufacturing of glass converting systems for drug containment offers the opportunity to grow in complex, multi-component systems. Working closely with our customers, we can offer custom designed systems complete with vision inspection technology to assure the highest quality products. The enhanced scalability and flexibility of our assembly and packaging solutions are well suited to match emerging biotechnology customers requirements such as smaller production batches with higher variability in dosage formats. We see future opportunities to apply these solutions to manufacturing multi-component devices for in vitro diagnostics, including point-of-care and self-injection devices for pharmaceutical and biotechnology customers.
Leverage our scientific and engineering capabilities across the drug development timeline
We have created an integrated, end-to-end, flexible portfolio of products, processes and services in order to collaborate closely with our customers from the preclinical phase through Phase III testing, regulatory filing and eventual commercialization. We believe that our ability to assist from the early stages of preclinical development is important in pursuing new customers because entering a new relationship at any later stage of the drug development cycle would require significant additional expenditure.
Such close collaboration presents us with an opportunity to leverage our scientific and engineering capabilities to strengthen and expand our business relationships. By assisting customers through their production processes, we gain the visibility and knowledge that, combined with our skills and capabilities, allow us to anticipate their emerging needs and intercept new demands. We address these needs by continuing to expand our product offering and making new solutions available. Through close collaboration with our customers, we gain invaluable insight into system requirements and industry trends and challenges, which we re-deploy for our future development projects, or to secure new business. For instance, we intend to pursue new opportunities driven by the trend of biotechnology companies toward outsourcing non-core activities of their business.
Leverage our global geographical presence as a platform to increase our penetration in the North American and Asia Pacific regions
The North American and APAC regions represent significant growth opportunities for our company. Both markets have well established research and manufacturing capabilities for biologic therapies covering both innovator and biosimilar products. We have a small but rapidly growing position in both regions, where we believe we can accelerate our recent growth by further expanding our manufacturing footprint. By providing locally sourced products, we can deliver supply chain security, just in time delivery, and reliable sourcing in terms of surge capacity to both existing and new customers. For example, our new plant in Indiana (U.S.) will represent a strategic location for us in proximity to key emerging biopharma players, enabling us to access an
100
attractive biotech and vaccine market. We believe that we are well-positioned to expand our footprint and market share in the North American and Asia Pacific regions. In an effort to grant access to treatments and vaccines to a higher portion of their population and, therefore, improve their quality of life, APAC countries are showing a consistently growing demand for biologics and cell and gene therapy solutions, as well as strong inclination towards investment in biosimilars. We believe that our global footprint will allow us to take advantage of these favorable growth trends. We intend to further invest in the North American and APAC regions to increase our market penetration in these region across the business segments in which we operate. Likewise, our new plant in Zhangjiagang (China) will grant us access to a growing vaccine market. Our efforts and intention to commit to the North American region have also been displayed by our appointment of a senior manager responsible for overseeing and implementing our commercial penetration strategy in this key geographical area.
Selectively pursue acquisitions and technology partnerships to augment and expand our product and service portfolio
We have a proven track record of successfully identifying, completing and integrating newly acquired complementary businesses and technologies. Our extensive knowledge of the competitive landscape and deep understanding of the evolving needs of our customers and end markets enable us to identify actionable opportunities to expand our portfolio. We employ a disciplined process to evaluate the strategic fit and financial prospects of acquisitions using a well-established set of criteria.
Business Segments
Our business operations are organized into two reporting segments: (i) Biopharmaceutical and Diagnostic Solutions, which includes all the products and services developed and provided for containment and delivery of pharmaceutical and biotechnology drugs and reagents, as well as the production of diagnostic consumables, and (ii) Engineering, which includes all the equipment and technologies developed and provided to support the end-to-end pharmaceutical, biotechnology and life sciences manufacturing processes (visual inspection, assembly, packaging and serialization and glass converting). In 2020, we generated approximately 85% of total sales from our Biopharmaceutical and Diagnostic Solutions segment and approximately 15% from our Engineering segment.
Biopharmaceutical and Diagnostic Solutions
Through our Biopharmaceutical and Diagnostic Solutions segment, we offer a wide range of development and manufacturing solutions to our pharmaceutical, biotechnology and life sciences customers. This segment comprises container closure systems (CCS), in-vitro diagnostic (IVD) solutions and drug delivery systems (DDS). We also provide analytical services and regulatory support exclusively to our customers, as ancillary services to the supply of containment solutions.
The Biopharmaceutical and Diagnostics Solutions segment includes our high-value solutions. These solutions are wholly owned, internally developed products, processes and services for which we hold intellectual property rights and have proprietary know-how and are characterized by particular complexity and high performance. Our high-value solutions represent a cross-section of our portfolio, including drug containment solutions such as NEXA®, LDP, ALBA® and a significant proportion of our EZ-Fill® line, as well as other drug delivery devices, molecular diagnostic solutions and analytical services.
Due to the technical complexity of our high-value solutions, and the significant value these generate for our customers, we enjoy premium pricing on these products, services and processes. Over time we have expanded our offering of high-value solutions, enabling us to drive significant growth from this category. Over the last five years of sales our high-value solutions have more than doubled to 23.3% of our total revenue as at March 31, 2021.
101
By developing high-value solutions using our proprietary intellectual property, we are able to create exclusive products, processes and services that can be used across different clients. For example, our high-value drug containment solutions, such as ALBA® and NEXA®, are particularly well-suited to address the needs of customers in the biologics end market, as they:
| reduce drug product waste in the pharmaceutical process by increasing the mechanical resistance of the containers; |
| maintain the integrity of drugs through reduced presence of extractables, leachables and visible / sub-visible particles in the containers; |
| minimize the interaction between the container and the drug; and |
| optimize the administration of biologics to patients, particularly with systems for the administration of viscous biologics products. |
The strong relationships we have developed with our customers and our ability to work alongside them across each stage of the drug development process, from pre-clinical to clinical stage and commercialization, allow us to understand their specific needs at an early stage of the drug development and production process and provide appropriate solutions for such needs. Our strong relationships, our ability to provide a full set of solutions across the drug development process, and our expertise in developing and assembling machinery and equipment for the production of drug containment and delivery systems make us a partner of choice for our customers.
Container Closure Systems (CCS)
CCS are mission-critical components in the production of pharmaceutical and biotechnology products. Our container closure systems are complex and rely on multiple sophisticated industrial processes to form, treat, inspect and package these products. We believe that the breadth and variety of our CCS offering represents one of our key competitive advantages. Our portfolio of CCS products includes:
| Pre-fillable Syringes (PFS): a wide range of sterile ready-to-fill (EZ-Fill®) syringes, available in a range of sizes from 0.5 ml to 5 ml with staked needle, Luer cone or Luer lock adapter. We also offer bulk syringes, which are available with or without staked needle; |
| Cartridges: a diversified offering of cartridges with bypass and multi-bypass systems suitable for both liquid and powder formulations, for the pharmaceutical, biotechnology and dental sectors. Cartridges are offered both in ready-to-fill (EZ-Fill®) and bulk options; |
| Vials: a broad range of vials, differentiated by size and capacity as well as ready-to-fill (EZ-Fill®) and bulk options. Our vials can be fully tailored to meet the different needs of pharmaceutical and biotechnology customers, including special formats such as micro-vials; and |
| Ampoules: a wide spectrum of ampoules and bulks. |
102
Our CCS portfolio comprises several innovation-driven high-value solutions. Our most innovative CCS solutions, some of which include integrated safety systems, are:
| EZ-Fill®: EZ-Fill® solutions are ready-to-fill products that are provided to our customers after having already been washed, depyrogenated and sterilized in-house. We believe our EZ-Fill® solution positions us ahead of many of our direct competitors, as it allows us to provide maximum value to our pharmaceutical and biotechnology customers by: (i) reducing their capital investments in washing and sterilization equipment; (ii) being flexible and processable across different containers (i.e., syringes, vials, cartridges) on the same filling line; (iii) guaranteeing no glass-to-glass contact between different containers, (iv) delivering fewer breakages in the filling process of our pharmaceutical and biotechnology customers; and (v) being completely compatible with existing filling lines, in order to minimize disruption for customers. As the developers of EZ-Fill® systems, which we first started producing in 2007, we believe that our manufacturing technologies are the industry standard for ready-to-fill vials and cartridges, with more than 250 fill & finish lines installed using EZ-fill® packaging technology over the last 12 years; |
| Alba®: an innovative CCS solution for pre-fillable syringes, cartridges and vials targeting protein-based drugs (biologics) and enabling a drastic reduction of silicon oil particle leaks and delamination issues, which we launched in 2019; and |
| Nexa®: an innovative CCS solution for pre-fillable syringes, cartridges and vials providing high mechanical resistance and a superior cosmetic quality. |
In-Vitro Diagnostics (IVD) solutions
Within the life sciences industry, we specialize in the development and manufacturing of customized diagnostic laboratory consumables (Point-of-Lab), as well as diagnostic consumables for use outside of laboratories (Point-of-Care) and IVD systems. These products are used in laboratories, hospitals, primary care facilities and in-home care settings on a worldwide scale.
The life sciences sector is complex as it requires constant cooperation with each customer for the development of the specific products they need. Whereas in the production of CCS we independently develop the shape and size of each container in accordance with customers instructions, the production of IVD solutions requires development of specific molds based on each customers requirements and specifications, which are then used for stamping of the final product. The development of these molds is a lengthy process that requires close cooperation with the customer and results in the customer retaining ownership of the mold(s). We intend to develop this business into an integrated platform covering all parts of the process, from product development to delivery of the final product, packaged and sterilized as needed.
103
Drug Delivery Systems (DDS)
Our DDS offering includes the following four product categories:
(i) | Pen Injectors: easy-to-use, safe devices containing a cartridge inside, which are mainly used for diabetes insulin treatments and which utilize a proprietary solution (Alina®) which we produce on the basis of an exclusive license from Haselmeier which we obtained in 2019; |
(ii) | Dry Powder Inhalers (DPI): breath-coordinated powder inhalers (mono or multidose), mainly used for asthma or other chronic obstructive pulmonary disease, which utilize a proprietary solution (ICOcap) which we produce on the basis of an exclusive license from Iconovo; |
(iii) | Auto-injectors: high-end easy-to-use devices (automatic injectors containing either cartridges or PFS) enabling biologics or emergency drug injection (MaverickTM); and |
(iv) | Wearable Injectors: wearable devices enabling on-body drug delivery through self-injection, for example for slow release injectable drugs. We own a proprietary solution (EZ-be Pod®) targeting high-end treatments such as pain management and oncology. |
We also provide contract development and manufacturing services for customer-owned drug delivery devices, including design, manufacturing, industrialization, component manufacturing and high-precision injector molding and assembly.
Analytical Services and Regulatory Support
We have two analytical testing facilities in Piombino Dese, Italy and Boston, Massachusetts focused on investigating the physical and chemical properties of primary packaging materials and components. By studying the interaction between container closure systems and drug products we provide valuable data to customers toward the definition of the optimal drug containment or delivery solution. This allows us to engage with our clients earlier in the development phase of their drugs and position ourselves well to become a supplier for their containment solution and potentially their drug delivery systems and related process equipment.
The containment and delivery solution that we provide is an integral part of the drug product itself and it is included as part of the regulatory filings required before commercialization. We also assist our customers in this phase of their drug product development by providing the support required to obtain the relevant regulatory authorizations.
Our key analytical services, supported by our regulatory know-how, include:
| Chemical Analysis: chemical characterization of the container to detect and address the risk of chemical interaction with drugs. We can also assist in detecting and quantifying extractables and leachables; |
104
| Surface Characterization: characterization of the physical and chemical properties of the containers surface to evaluate the performance and the reaction with the drug product; |
| Container Performance and Interaction: diverse range of investigative fields from material to chemical, physical and mechanical; |
| Drug Delivery System Testing: tests to ensure device compatibility, functionality and ease of use; and |
| Tailored Services: customized testing based on the specific need of each client. |
Engineering
Our engineering segment produces machinery for both in-house use and sale to customers. In our Piombino Dese (Italy), Bologna (Italy), Brabrand (Denmark) and Silkeborg (Denmark) plants, we produce equipment and machinery for all phases of the glass production process, as well as for the assembly of plastic products. We drive continuous technological advancements so that our equipment can consistently meet our clients exact specification requirements. Our engineering services span all phases of the machinery production process from development and design, including the development of software and artificial intelligence models, to construction, assembly and testing. With approximately 60 specialists and technicians located worldwide, we provide after sales support to our customers with interactive tools and technical expertise, to ensure performance of their production sites.
Our engineering products include:
| Assembly Equipment: we produce modular assembly equipment for flexible and scalable solutions. Our assembly equipment is highly automated and includes extensive in-line controls around product safety and functionality. Our platforms are available for prototyping, small batches and high volume production for pen injectors, auto-injectors, wearable injectors and inhalers; |
| Visual Inspection Equipment: we provide inspection solutions for ampoules, vials, cartridges, syringes or bottles, filled with clear or opaque liquids, emulsions, viscous gels, lyophilized products and other difficult-to-inspect solutions. Our diversified portfolio of products, which includes manual, semi-automatic and automatic equipment, also featuring artificial intelligence, allows us to deliver flexible inspection solutions at any stage of the product life-cycle, from lab development to high volume production; |
| Secondary Packaging and Serialization Equipment: our portfolio includes a broad range of modular solutions which can be configured and customized, in a compact footprint, for cartoning, labelling, case packing and palletizing, thereby ensuring traceability through serialization. We provide secondary packaging lines that adapt to both small batches and high production volumes for multiple different product formats, including glass primary containers and drug delivery devices. We focus on robotics, quick format change and gentle handling to ensure production reliability and efficiency; and |
105
| Glass Converting Equipment: we produce fully automated, high-speed, precision glass forming lines which provide accurate processing of ampoules, vials, cartridges and syringes. To cover all steps of production, we also manufacture glass tube loaders, after forming lines and annealing ovens. |
We also provide professional project management services, supporting our customers in designing their plant layout for the production of bulk and ready-to-use pharmaceutical and biotechnology primary packaging. As a result of the experience gained designing our greenfield plants in Italy, China, Mexico and Brazil, our offering includes support and consultancy around: (i) plant design, (forming lines, clean room areas and laboratory layout); (ii) plant construction (production flow, piping and instrumentation diagrams); and (iii) plant engineering (preliminary plant studies).
Customers
We serve a large and diversified customer base of more than 700 companies worldwide, including many of the worlds largest pharmaceutical and biotechnology companies, life sciences companies, drug product and fill and finish contract manufacturers.
Our customer base includes 41 of the top 50 pharmaceutical companies (comprising all of the top 15) and eight of the top ten in-vitro diagnostic companies, as measured by 2020 revenue, according to data collected by Global Data. We also serve 15 of the top 20 biotechnology companies by market capitalization in the NASDAQ Biotechnology Index and over 100 biotechnology customers in total.
Drug containment and delivery solutions are an essential element in our customers manufacturing processes but generally represent a small fraction of the total cost of producing drugs. We therefore believe our customers choose our products, processes and services based on quality, reliability, innovation, speed to market and consistency rather than on costs.
We seek to maintain high levels of engagement with our customer base in order to deepen our relationships over time. Our deep, tenured relationships with our customers are supported by multi-year contracts which often contain cost pass-through provisions and have resulted in large recurring revenue streams. We engage with our customers through a variety of touchpoints, including direct visits, third-party and proprietary educational events, webinars, digital and social media communication channels designed to gauge consumer satisfaction with our products, technologies and services.
Our ten largest customers accounted for 40.6% of our consolidated revenue in 2020, and no single customer accounted for more than 10.0% of our sales.
106
Customer Categories
We believe that quality, breadth of services and innovation are the main factors enabling us to deliver significant value to our customers making us a partner of choice for them. Our main customer categories include:
Pharmaceutical and Biotechnology Companies
Our pharmaceutical and biotechnology customers include large, international companies, as well as smaller regionally focused companies and manufacturers. We provide a diverse range of products, processes and services to these customers, both within our Biopharmaceutical and Diagnostic Solutions segment and our Engineering segment. Over time, we have invested in developing innovative products, services and solutions to serve pharmaceutical and biotechnology customers, which has enabled us to form long lasting relationships underpinned by the reliability and quality of our offering, processes and services. The validation process for suppliers of pharmaceutical and biotechnology solutions, both with regard to drug containment and delivery systems and engineering, requires rigorous evaluation of multiple quality and compliance criteria and can sometimes last several years. For this reason, we believe that we are well-positioned to enjoy durable long-lasting relationships with our customers, as we are deeply embedded in their production processes.
Life Sciences Companies
Our main life sciences customers are in-vitro diagnostic companies. We provide life sciences companies with contract development and manufacturing services for the plastic consumables used in their diagnostic tests and containment solutions for their reagents as well as machinery for the production, assembly and visual inspection of such products.
Drug Product / Fill & Finish Contract Manufacturers
We provide our solutions to drug product / fill & finish contract manufacturers. We provide these customers with glass and plastic containers as well as engineering solutions for the assembly, visual inspection, secondary packaging and serialization of their products.
Customer Service
We have a customer service team that works in parallel with the sales, supply chain, operations, technical and quality teams at our plants to collect feedback at every stage of our production process. We coordinate our customer service function centrally from our headquarters in Italy to ensure that our global team of customer service professionals applies consistent processes and procedures to guarantee quality and service levels.
Customer Contractual Arrangements
We have different contractual arrangements for different business segments. In our Biopharmaceutical and Diagnostic Solutions segment, our relationships with our customers are governed typically by master supply agreements the terms of which apply to each purchase order or product schedule through which customers place their request for the supply of our products. These are normally multi-year contracts which often contain cost pass-through provisions and have resulted in large recurring revenue streams. We negotiate different master supply agreements with each customer and, although similar, there are no standardized terms across agreements.
Sales in our Engineering segment relate to individual machinery and contracts and are therefore negotiated on an ad hoc basis. Pursuant to these equipment sale agreements, the intellectual property rights developed during the production of the relevant equipment and services remain our exclusive property save for cases of co-development with our customers.
107
Backlog
As of March 31, 2021, our total backlog was 665.1 million compared to 606.7 million as of December 31, 2020 and 303.8 million as of December 31, 2019. This increase in backlog was mainly due to a general increase in demand for our products as a result of the COVID-19 pandemic and the improvements to our manufacturing processes, which by reducing the time to market of our customers products, have given us a competitive advantage. Another contributing factor for the increase in our backlog has been an increase in lead time for the supply of critical components like our products in the market.
In our Biopharmaceutical and Diagnostic Solution segment we generally operate under long-term supply and/or framework agreements. Our backlog represents, as of a point in time, estimated future revenues from work not yet completed under specific purchase orders.
In our Engineering segment we generally have one-off agreements and our backlog represents, as of a point in time, estimated future revenues from work not yet completed under those agreements.
To the extent projects are delayed, the timing of our revenue could be affected. If a customer cancels an order, we may be reimbursed for the costs and often for the missing profit we have incurred. For orders that are placed inside a contractual firm period, we generally have a contractual right to payment in the event of cancellation. Fluctuations in our reported backlog levels also result from the timing and order pattern of our customers who often seek to manage their level of inventory on hand. Because of customer ordering patterns, our backlog reported for certain periods may fluctuate and may not be indicative of future results.
Competition
We compete across a broad spectrum of products, processes and services for integrated containment and delivery solutions as well as engineering solutions. The breadth of our integrated capabilities differentiates us from our competitors as we believe we are the only player to be active in both the drug containment and delivery systems and engineering segments. We maintain constructive relationships with our competitors and in some cases we acquire production inputs for our primary packaging from them. Similarly, we sell our equipment and machinery and license certain intellectual property rights to competitors for use in their production processes.
Given the breadth of our offering, we have different competitors for different products, and in particular we consider the main competitors in each segment to be:
| Container Closure Systems: Schott Pharmaceutical Systems (bulk and ready to use vials and cartridges), Becton Dickinson (pre-fillable syringes), Nipro and Gerresheimer AG (bulk vials and cartridges); |
| Drug Delivery Systems: SHL, Ypsomed, West Pharma and Becton Dickinson; |
| Contract Development and Manufacturing: Jabil Packaging Solutions, Flex, Phillips Medisize and West Pharma; and |
| Engineering: Syntegon, Korber, ATS and Mikron. |
Marketing
We market and sell our products both directly and, to a lesser extent, through a limited number of third-party partners globally.
Our salesforce is organized both vertically, by geography (Americas, EMEA and APAC) and key accounts, and horizontally, by business activity (technical pre-sales, product managers, aftersales and business development). Our sales team, of approximately 140 employees, works closely together in each area and region to ensure a coordinated approach.
We typically establish and maintain long-standing, direct relationships with all our customers and our salesforce proactively engages with our current and prospective customers to continuously share information and
108
evaluate their needs, so that we may tailor our solutions in real time. Additionally, we host a series of events such as our Innovation Day and Pharmapack Symposium to provide a forum for collaboration and exchange of ideas with our customers. We work with and learn from our customers, and we develop products around their needs and to address their demands.
Manufacturing, Facilities and Supply Chain Overview
Our Approach to Manufacturing
Our manufacturing approach is based on the relentless pursuit of maximum efficiency and highest quality. We implement top of the line hardware and software solutions to deliver consistent quality standards, in an attempt to minimize human impact in the production chain. Our manufacturing methods and processes, which are standardized in all of our production facilities, allow us to provide consistent products, processes and services, both in terms of quality and time to market, worldwide. Our pro-active, forensic approach to manufacturing together with our careful oversight allow us to mitigate the risk of quality issues to customers, thereby reducing additional costs for them and us. At all stages of our manufacturing process we strive to preserve the integrity of medicines and protect the safety of patients.
Our ultimate goal is to achieve zero quality issues by delivering products and services that never fall short of client specifications, and by operating a quality control system capable of preventing a sub-standard product from ever being delivered to our customers.
RAFT (Right At First Time) execution, respect for deadlines and flawless processes enable us to achieve very high customer satisfaction, while fostering loyalty and enhancing our reputation. Moreover, the combination of our scientific skills and engineering capabilities, which makes us a unique player in the market, enables us to minimize waste and maximizing efficiency.
Digitalization along the manufacturing chain paves the way to make processes faster and more efficient and reduce defective products. Continuing technological innovation allows us to improve process robustness and increase output. By integrating different production steps like injection molding and assembly, we have successfully eliminated intermediate stocks, thereby realizing significant cost savings.
Our glass manufacturing process consists of four main steps:
(i) | Forming: the glass tubes are cut into sections to form the primary packaging. Each glass tube is diverted into forming machines and shaped through a system of flames, blown air and toolings to create the primary packaging; |
(ii) | Treatment: to ensure the solidity of the freshly formed glass products, they undergo a heat treatment and are cooled in a controlled way inside a tunnel furnace known as an annealing lehr. Various treatments to achieve surface protection, water-repulsion or enhanced anti-friction are available to increase the products resistance; |
(iii) | Inspection: each item is checked using various inspection techniques depending on the customer and the product. Quality controls during the production process are strict and range from visual inspection, measurement systems and other laboratory tests. Such strict quality controls are required for us to meet our customers requirements in terms of dimensional precision, mechanical resistance, functional features, visual aspect (cosmetic defects below specification thresholds) and chemical stability. Our inspection techniques include visual, mechanical, video and light beam technology; and |
(iv) | Packaging: as they leave the production line, the products enter into a clean room (ISO 8 environment) and are packaged. The products are then automatically placed on pallets and labelled to ensure traceability. Our advanced traceability systems allow us to identify defective products and recall them should that become necessary. |
109
The EZ-Fill® process for syringes, vials and cartridges includes barrel washing with water for injection (for cartridges and syringes there are also inner body siliconization and closure assembly, while only for syringes needle assembly and needle siliconization with silicone oil), packaging into tub, nest or tray (tray only for vials) and final sterilization. The packaging is performed through a phase of automatic nesting, tub insertion and Steribag sealing, performed in an ISO 5 environment (alternatively, for vials, trays could also be used). The in-process and quality controls for batch release are performed through specific control plans.
Our plastic manufacturing process consists of five main steps:
(i) | Injection Molding: this is one of the core competencies of SG Balda and thus of our production in Germany and the U.S. At this phase, we set up the relevant mold, prepare the injection molding machine and dry and/or condition the plastic granulate, before proceeding with the production of the relevant plastic parts on the basis of pre-defined production specifications. The entire range of different plastic products is processed on the basis of validated processes. Molds allow the production of up to 128 parts in a single cycle, which can last between 4 and 30 seconds; |
(ii) | Assembly: injection molded components can be assembled among themselves or with rubber, glass, metal or electronic components. Assembly processes could be carried out manually, but are almost entirely automatized; |
(iii) | In-line Inspection: based on a risk analysis, all process steps in the value chain are validated and appropriate quality control measures are established before production starts in the industrialization phase. In the case of fully automated assembly or packaging, these test steps are integrated into the automation process. Here, optical, tactile and electrical tests are carried out; |
(iv) | Quality control: this is an essential part of the production process. We carry out inspections in the form of in-process controls and/or after completion controls. Different procedures such as mechanical tests (forces, torques), dimensional tests (dimensions), optical tests, etc., are carried out to ensure that only products that meet the required specifications are delivered; and |
(v) | Packaging: the final process step is the packaging of the product into primary, secondary or tertiary packaging. Foils, blisters or printed cardboard are used for this purpose. Instruction manuals in different languages are enclosed. |
Our engineering manufacturing process consists of nine main steps:
(i) | Development: at this phase, intended product use is defined by the subject-matter expert, product risks are assessed through a failure mode and effect analysis (FMEA) and documented in accordance with relevant function specifications; |
(ii) | Design: design of the equipment based on the FMEA is reported in a specific format, including a traceability matrix that ties back to the user requirements specifications; |
(iii) | Production Base: prepare necessary documentation and release specific bill of materials; |
(iv) | Assembly: relevant equipment is then assembled, the relevant software installed and all connections are checked and tested based on ad hoc checklists; |
(v) | Running-in: the equipment is completed and test plans are prepared; |
(vi) | Factory Acceptance Test: systematic verification with predefined test based on FMEA risk assessment for the specific design. Testing covers all relevant customer requirements; |
(vii) | Commissioning: the equipment is transported to customers facility and installed based on pre-agreed requirements and specifications set out in ad hoc checklists; |
(viii) | Site Acceptance Test: systematic on-site verification according to pre-defined protocol and reporting to customer; and |
(ix) | Closing: project evaluation and monitoring to ensure continuous improvements. |
110
Facilities Overview
Below is a full list of our production facilities divided by business segment.
Biopharmaceutical and Diagnostic Solutions
| ||
Location
|
Product(s)
| |
Piombino Dese, Italy
|
Primary Packaging (Vials, Cartridges, EZ-Fill®)
| |
Latina, Italy
|
Primary Packaging (Cartridges)
| |
Bratislava, Slovakia
|
Primary Packaging (Vials, Ampoules)
| |
Monterrey, Mexico
|
Primary Packaging (Vials, Cartridges, Ampoules)
| |
Zhangjiagang, China
|
Primary Packaging (Vials, Cartridges)
| |
Sete Lagoas, Brazil
|
Primary Packaging (Vials, Cartridges, Ampoules)
| |
Bad Oeynhausen, Germany
|
Medical Devices and components for Biopharma and Diagnostics
| |
Ontario, California, U.S.
|
Medical Devices and components for Biopharma and Diagnostics
| |
Oceanside, California, U.S.
|
Components for medical devices, aviation and consumer applications
|
Engineering
| ||
Location
|
Product(s)
| |
Piombino Dese and Bologna, Italy |
Glass Converting equipment and lines Assembly and Packaging equipment and lines Visual Inspection Equipment
| |
Aarhus, Denmark
|
Visual Inspection Equipment
| |
Silkeborg, Denmark |
Assembly equipment and lines Packaging equipment and lines
|
New Indiana and China facilities
We plan to use part of the proceeds of the offering to establish new greenfield plants for EZ-Fill® products, with strong focus on biologics and vaccines, in Indiana (U.S.) and Zhangjiagang (China) (focusing also on engineering). We are considering the construction of a plant in the State of Indiana involving a capital investment of up to $145.0 million for a manufacturing facility of up to 370,000 square-foot and the creation of more than 230 new full-time positions. As part of the potential expansion of Stevanato Group in Indiana, the Indiana Economic Development Corporation offered the Company up to $2.9 million in conditional tax credits and up to $500,000 in conditional training grants based on the Companys job creation plans. These tax credits are performance-based, meaning the company is eligible to claim incentives once Hoosiers are hired and trained. The City of Fishers, where we are considering basing the plant, will consider additional incentives of up to $1.2 million. We currently expect to confirm our decision and break ground on our new plant later this year and to complete the construction in 2023.
111
Supply Chain
We maintain positive relationships with suppliers across our business. The types of consumables we require differ by product as follows:
| Primary Packaging: our primary packaging production requires the supply of adequate glass tubes, as well as plastic and rubber components. We currently have access to adequate supplies of glass tubes to meet our production needs through agreements with four suppliers: Schott, NEG, Nipro and Corning. We also have access to adequate supply of plastic and rubber components. |
| Plastic Consumables and Parts: we currently have access to adequate supplies of plastic to meet our production needs. In Germany, most of plastic agreements are driven by the final customers, while in the United States we have a reliable supplier list, and we procure material on a single order approach. Our plastic consumables and parts business also requires the supply of molds for the production of the relevant plastic parts. |
| Equipment: for our engineering business we need supply of machinery components which we assemble to produce our different engineering products. We meet our production needs with an enlarged supplier base, that allows us to have multiple sources and minimize risks. |
For some of the materials we use in our production cycles, including glass tubes and DuPont synthetic fiber Tyvek®, we have a limited number of (or a single-source) suppliers worldwide, and selecting new suppliers would be a lengthy and time consuming process. Despite significant supply chain pressure during 2020 due to COVID-19 related bottlenecks; we were able to avoid any major supply disruptions by expanding the number of suppliers we typically work with.
Supply Agreements with Schott and NEG
Schott and NEG accounted for a significant percentage of our glass tube supply in 2020.
In 2017 we entered into a Master Supply Agreement with Schott for the supply of glass tubes which was replaced by a new Master Supply Agreement dated November 21, 2019 and effective as of January 1, 2020. Under the agreement, we are required to purchase minimum quantities. Under the Schott Master Supply Agreement we must notify Schott in October every year of the desired quantity to be purchased the following year. If the required quantity exceeds the minimum quantity imposed on Stevanato under the agreement, Schott approval is required. The agreement also provides for certain price adjustment mechanics based on manufacturing costs. The agreement expires on December 31, 2024 and contains customary termination provisions, allowing for termination by a party upon a material violations of the agreement or change of control by the other party.
On October 24, 2019, we entered into a Supply and Purchase Agreement with NEG for the supply of glass tubes which became effective on January 1, 2020. The agreement has a term of three years at the end of which the parties may negotiate the terms of the renewal. Under the agreement, we are required to purchase minimum quantities and NEG is required to supply minimum quantities. The agreement contains customary termination provisions, allowing for termination upon the other partys default not cured within 30 days and bankruptcy, dissolution, suspension or other similar event.
Quality control
Providing high-quality products with specificity, sensitivity and consistency, coupled with extensive product validation data are fundamental drivers of customer loyalty. Customers in our target markets are particularly sensitive to products failing to meet specifications shown on data sheets. Our success depends on our customers confidence in our ability to provide reliable, consistently high-quality products, which includes our ability to provide validated data to support our customers use of our products. In this respect, we believe that our ability to provide consistent quality standards in each of our production facilities, due to our standardized production processes, allow us to win our customers trust and reliance.
112
Biopharmaceutical and Diagnostic Solutions
All of our facilities use efficient quality control and quality assurance procedures comparable to those used in the pharmaceutical and biotechnology industries at each stage of the manufacturing process. We are certified according to applicable ISO standards. We are subject to rigorous audits by certification bodies and our customers, who perform more than 100 audits a year (other than 2020 which was affected by COVID-19 restrictions) on our manufacturing facilities. Our control procedures in our glass manufacturing facilities focus on physical and chemical characteristics, dimensional aspects and product appearance and are carried out on each of: (i) the glass tubes and raw materials; (ii) the various process phases of production; and (iii) the finished products. Along the production line and before packaging each product undergoes an automatic inspection for cosmetic defects. Defective pieces are discarded. Inspection is carried out with highly sophisticated electronic devices using specific defect detection algorithms. At the end of the production line, products are checked using statistical control procedures to test their quality for specific cosmetic, chemical, physical and dimensional parameters. Each of our plastic manufacturing facilities also follows similar quality control procedures, albeit specific to plastic production. The control procedures include dimensional and functional tests, focused on the mechanic and cosmetic features of the products. In particular, checks are carried out on each of: (i) the raw materials; (ii) dyestuff, additives and components; (iii) the various process phases; (iv) semi-finished products; and (v) finished products.
Engineering
Our quality control systems and related activities are designed to ensure that our manufacturing processes, as well as those of our pharmaceutical customers and the contract manufacturing companies we rely on comply with Good Automated Manufacturing Practice (GAMP) standards based on the GAMP guidelines issued by the International Society for Pharmaceutical Engineering (ISPE). Each individual piece of machinery / equipment is developed and manufactured as a project, and ad hoc project management tools are utilized to manage every stage and minimize risk.
Our quality activities follow a Stage Gate Model which includes the following ten stages: (i) quotation: based on customers needs (URSuser requirements specifications); (ii) start-up: intended product use is defined by the subject-matter expert (SME), product risks are assessed through a failure mode and effect analysis (FMEA) and documented in accordance with relevant function specifications; (iii) design: design of the equipment based on the FMEA is reported in a specific format, including a traceability matrix that ties back to the user requirements specifications; (iv) production base: prepare necessary documentation and release specific bill of materials, whose accuracy is assessed based on ad hoc checklists; (v) assembly: all components are sourced from approved suppliers and subsequently checked ahead of distribution to the assembly line. The relevant equipment is then assembled, the relevant software installed and all connections are checked and tested based on ad hoc checklists; (vi) running-in: the equipment is completed and test plans are prepared; (vii) FAT: systematic verification with predefined test based on FMEA risk assessment for the specific design. Testing covers all relevant customers requirements; (viii) commissioning: the equipment is transported to customers facility and installed based on pre-agreed requirements and specifications set out in ad hoc checklists; (ix) SAT: systematic on-site verification according to pre-defined protocol and reporting to customer; and (x) closing: project evaluation and monitoring to ensure continuing improvements.
Logistics
Our products are delivered to our customers using various third-party freight, haulage transportation and warehousing providers. Each manufacturing facility has its own logistics team that is responsible for managing product storage and delivery accounts.
Shareholder Agreement with SVM Holding ApS
In 2016 we purchased, through our wholly owned subsidiary Stevanato Group International a.s., 65% of the issued share capital of SVM Automatik A/S. In connection with the transaction, Stevanato Group International
113
a.s. and the seller, SVM Holding ApS, entered into a shareholders agreement to govern the co-operation between them in the period of joint ownership of the company. The board of the company is comprised of five members, three of which are appointed by Stevanato Group. Material decisions require the favorable vote of at least one of the directors appointed by the minority shareholder. Pursuant to the shareholders agreement, Stevanato Group International a.s. has a call option and SVM Holding ApS has a put option on the remaining 35% of the issued share capital of SVM Automatik A/S, respectively.
Intellectual Property and Information Technology
Intellectual Property
Our products, both in the Biopharmaceutical and Diagnostic Solutions and in the Engineering segments, are highly sophisticated and based on the development of specific know-how, processes and procedures. We actively protect our intellectual property rights and know-how through patents, trademarks and trade secrets. The technology behind our core products and processes is protected by 48 patent families, the most important ones being those devoted to the protection of the EZ-fill® solutions, the pre-sterilized drug containment solutions for aseptic manufacturing.
Our most distinctive brands are also protected via registered trademarks, the most important being: (i) SG-toothed wheel logo, (ii) EZ-fill®, (iii) ALBA® (relating to advanced drug containment solutions for optimized drug-containment interaction), (iv) EZ-be Pod® (relating to wearable injectors), (v) Alina® (relating to pen injector devices), and (vi) NEXA® (relating to superior drug containment solutions for mechanical resistance and cosmetic quality).
Information Technology
We have implemented, and maintain, various IT policies to protect the Groups information and IT infrastructure. In 2017, we began our digital transformation to facilitate the Groups growth in a globally competitive market. Our goal is to further improve, expand, and develop our digital ecosystem through 2021 and 2022. To date, we have:
| migrated all users to the cloud-based Microsoft Office 365, which includes advanced threat protection and data loss prevention functionalities; |
| begun integrating all Groups business divisions into the cloud-based enterprise resource planning system, with the aim of completing such integration by the first quarter of 2022; and |
| launched a data factory data intelligence solution based on Microsoft Synapse technology, providing business intelligence data. |
Through 2021 and 2022, we intend to implement:
| a secure digital work platform; |
| a fully integrated enterprise resource planning system for the whole Group; |
| cloud-based IT infrastructure through Microsoft Azure and Amazon Web Services; and |
| cutting edge digital and intelligence solutions. |
Our IT infrastructure is hosted by Telecom Italia in a data center in Padua and is backed-up in Bologna. The Padua and Bologna data centers are connected to Amazon Web Services and Microsoft Azure cloud networks, based in Frankfurt and Dublin respectively. Our Group companies are connected to the data centers through multiprotocol label switching networks.
114
We have also implemented a cybersecurity improvement program to strengthen our existing IT security, foster greater cyber resilience of our IT systems, and improve our business continuity and disaster recovery procedures. As part of our cybersecurity improvement program, we have:
| begun the process of documenting in writing our IT security processes and procedures; |
| implemented Palo Alto Networks Prima Cloud security platform to secure our cloud environments; and |
| reviewed our procedures in relation to quality and compliance requirements. |
We will continue to further strengthen our cybersecurity program in 2022. We are not aware of any material cybersecurity incident over the past years, nonetheless we are also evaluating cybersecurity insurance options. For a description of the cybersecurity risks we may be facing see Risk Factors Risks Relating to our Business and Industry Cyber security risks and the failure to maintain the confidentiality, integrity and availability of our computer hardware, software and internet applications and related tools and functions, could result in damage to our reputation, data integrity and/or subject us to costs, fines or lawsuits under data privacy or other laws or contractual requirements.
Research and Development
Research and development investment is a fundamental component of our growth and continued success. Our research and development team comprises more than 100 highly skilled and specialized employees operating in Italy, Germany and the United States of America.
The goal of our research and development effort is twofold: (i) to facilitate the transition from hospital to home care; and (ii) enabling biologics to reach the patient safely by meeting the most critical quality and performance requirements.
We pursue these goals by investing in both the Biopharmaceutical and Diagnostic Solutions segment (with the exception of in-vitro diagnostic products in relation to which we do not conduct research) and the Engineering segment. In 2020, for instance, we invested 17.4 million in research and development, a portion of which toward setting up a new laboratory in Boston, MA.
Our Biopharmaceutical and Diagnostic Solutions research mainly focuses on DDS patient-centricity, sustainability and digitalization and improvement of CCS production processes and coating systems. In this segment we conduct our development activities both autonomously and, to the extent our customers require specialized or customized products, in close cooperation with them. We are most frequently asked to produce specialized or customized products by our pharmaceutical and biotechnology clients (in both glass and plastic).
In particular, in the area of containment solutions, the development of new products will be targeted at maintaining the stability, potency and purity of our customers products prior to administration. New therapies for diabetes, cancer treatment and auto immune diseases are based on large, complex bio molecules that are extremely sensitive to their storage environment. In the area of drug delivery systems, we will be targeting the development of easy-to-use, accurate, reliable self-injection systems for complex pharmaceutical and biotechnology products. We have developed a portfolio of devices for this market that can be used off-the-shelf or customized to the specific needs of the customer.
We will continue developing new drug delivery systems based on three pillars: patient centricity, sustainability and digitalization, core capabilities to meet our customers need for connected health devices. We apply a rigorous stage&gate development process, which de-risks our development projects and reduces total development costs. Development timelines for new drug delivery devices typically fall into the range of four to five years to reach the start of initial production. We cooperate with third parties on joint development projects. Pursuant to the relevant joint development agreements with these third parties, we either own, or are entitled to co-ownership of or license rights to, the intellectual property rights developed in connection with these programs.
115
Our main focus in Engineering is on maximizing our machine performance while reducing total cost of ownership. Further, we are broadening our portfolio of products, processes and services with the aim of creating a stable platform able to minimize planned and avoid unplanned downtime, and developing and integrating artificial intelligence into our machinery.
In certain research areas, including chemical-physical and morphological characterization of glass surfaces and interactions with drugs, we cooperate with Universities such as Ca Foscari University (Venice, Italy), Federico II University (Naples, Italy), the National University of Ireland Mynooth (Ireland) and the University of Trento (Italy). Pursuant to the relevant cooperation agreements with these Universities, we either own, or are entitled to co-ownership of, the intellectual property rights developed in connection with these programs.
Employees
As of March 31, 2021, we employed 4,344 employees, mostly within our production sites. The following table provides a breakdown of employees across the various main departments.
Department |
Total Headcount as of March 31, 2021 |
|||
Direct Labor |
2,751 | |||
Industrial / Manufacturing Overhead |
1,041 | |||
G&ACorporate Functions |
162 | |||
Sales & Marketing |
141 | |||
Research & Development |
109 | |||
G&AAccounting Finance Control |
74 | |||
Human Resources |
63 | |||
CEO Office |
3 |
Our success largely depends on the skills and experience of our management, including our Executive Chairman, Chief Executive Officer and our senior leadership.
Our excellence in manufacturing processes derives in part from our employees mastering specific techniques and know-how. Certain roles, such as engineers, designers, quality controllers, can also require lengthy training due to the highly technical and diversified nature of the processes used in our production.
A substantial majority of our employees are covered by collective bargaining or similar agreements, which require periodic renegotiation. We believe we have strong relationships with our employees. We have not experienced any material work stoppages or strikes at any of our manufacturing facilities in recent years. We take a constructive approach to relationships with trade unions and works councils.
Insurance
We maintain product liability, property and other insurance coverage to the extent we believe necessary to operate our business. We believe that our liability insurance is sufficient to meet our needs in light of expected possible future litigation and claims. We monitor regularly our risk profile and adjust coverage accordingly.
Legal Proceedings
We are involved, from time to time, in various litigation and administrative and other legal proceedings, including potential regulatory actions, incidental or related to our business, including commercial contract and tortious liability claims, among others (collectively, Legal Proceedings). While we cannot predict any final
116
outcomes relating thereto, management believes that the outcome of current Legal Proceedings will not have a material effect upon our business, financial condition, results of operations, cash flows, as well as the trading price of our securities.
However, managements assessment of our Legal Proceedings is ongoing, and could change in light of the discovery of additional facts with respect to Legal Proceedings pending against us, not presently known to us, or determinations by judges, arbitrators, juries or other finders of fact or deciders of law which are not in accord with managements evaluation of the probable liability or outcome of such Legal Proceedings. From time to time, we are in discussions with regulators, including discussions initiated by us, about actual or potential violations of law in order to remediate or mitigate associated legal or compliance risks. As the outcomes of such proceedings are unpredictable, the results of any such proceedings may materially affect our reputation, our business, financial condition, results of operations, cash flows or the trading price of our securities.
Under Italian Law, directors and officers (in their capacity as employers) have a duty of care towards their employees and are therefore responsible for their health and safety. Breaches of this duty of care can result from any non-compliance or accident occurred within the facility, regardless of an actual act or omission of such directors, as they are strictly liable in light of their role (posizione di garanzia). Some of our directors are currently subject to criminal proceedings in connection with their roles as employers, either for the Stevanato Group or for one of its subsidiaries, and in particular:
| Sergio Stevanato is currently a defendant in two criminal proceedings: (i) before the Court of Padua (Italy) in respect of harm suffered by a former employee of Ompi S.r.l., one of our subsidiaries, allegedly as a result of being exposed to asbestos present in our facilities in the 1970s. The proceedings started in October 2018 and relate to facts that allegedly occurred between 1967 and 1987, when Mr. Stevanato was an officer of Ompi S.r.l. between 1973 and 1979. The employee contracted pleural mesothelioma, allegedly as a result of his exposure to asbestos, which was present in the panels used to protect employees from heat (use of asbestos was not prohibited at the time). The employee died in 2020, and the charges against Mr. Stevanato are expected to change to manslaughter; and (ii) before the Court of Latina (Italy) in respect of an injury suffered by another employee of Ompi S.r.l. to his finger in 2014. The proceedings started in 2014 and are still in first degree court. If no final decision is rendered before the end of 2021, the proceedings will become time barred and charges will be dismissed. Similarly, if a decision is rendered by the end of 2021 and appealed, it is likely that the proceedings will become time barred before a final decision is rendered by reason of Italian criminal procedure rules. |
| Franco Stevanato is currently a defendant in a criminal proceedings before the court of Padua (Italy) in respect of harm suffered by an employee of Nuova Ompi S.r.l., one of our subsidiaries, as a result of a collision between forklifts, as a result of which an employee suffered a leg fracture. The proceedings started in May 2019 and relate to facts allegedly occurred when Mr. Stevanato was the Responsible for Health and Safety matters of Nuova Ompi S.r.l. Mr. Stevanato was found guilty in a summary judgment, which he appealed. Full trial has started and the next hearing is scheduled for January 2022. |
| Fabiano Nicoletti is currently a defendant in a criminal proceedings before the court of Padua (Italy) in respect of harm suffered by an employee of Nuova Ompi S.r.l. The employee held on to a production machine, on which a piece of broken glass had been left, to break an accidental fall. The proceedings started in spring 2018 and are currently pending, next hearing is scheduled for September 2021. |
Regulations
The following paragraphs provide a brief description of the primary Italian, European and international laws and regulations that govern our activities. References and discussions to laws, regulations, directives and treatises and other regulatory acts are entirely qualified by the full texts of laws, regulations, directives and treatises, other administrative and regulatory acts themselves.
117
Health and safety
At all of our locations, we are subject to national laws, regulations and practices concerning employee health and safety. While each site is responsible for monitoring compliance with local regulations, we have a health and safety network that operates across all of our manufacturing facilities in order to share and promote best practices. Each of our manufacturing facilities is regularly audited and any corrective action required to maintain our global standards is implemented. To date, we have not been subject to any significant fines, penalties or other liabilities under laws and regulations relating to employee health and safety. However, there can be no assurance that we will not be subject to fines, penalties or other liabilities in the future or that changes in such laws and regulations, or interpretations thereof, will not have an adverse impact on our operations.
Product safety regulation
The use, manufacture and importing of chemicals is highly regulated in the European Union. On June 1, 2007, Regulation 1907/2006 concerning registration, evaluation, authorization and restriction of chemicals (REACH) entered into force. Our products and the raw materials we use in our production processes are subject to various regulations related to product and chemical safety, including the REACH regulation in the European Economic Area. REACH requires that certain substances imported or manufactured within the European Economic Area be registered with the European Chemicals Agency and evaluated for safety. The registration process requires producers to generate and submit data on the environmental and health impacts of substances and, in some cases, obtain authorization for their use within the European Union. Among other things, REACH can result in the imposition of use or marketing restrictions, and may require the phase-out or substitution of certain more dangerous chemicals with suitable alternatives. The European Union is continually adopting additional requirements related to product or substance safety. Although REACH compliance is primarily the responsibility of our suppliers or the producers of chemical raw materials, we are also affected by REACH as a downstream user of REACH-regulated substances. It is possible that the registration process or use restrictions imposed by REACH could increase our costs, affect our raw material supplies or require us to substitute certain materials with alternatives. We utilize a database system that allows us to track and monitor our suppliers and the REACH-compliance status of raw materials used at each of our facilities. We biannually review official databases to ensure that our suppliers have made the required registrations and are in material compliance with REACH, and check that they have efforts underway to prepare for and comply with any additional requirements or upcoming deadlines. We believe that we have the capability to adjust our products and supplies as needed in accordance with any future requirements of REACH.
Environmental
Our operations are subject to a number of European, national and local environmental laws and regulations relating to the protection of the environment and natural resources. These include laws and regulations relating, inter alia, to air and noise emissions and the impact made on air quality through gas and particle emissions, and recycling and packaging waste reduction and prevention. Compliance with these laws and regulations is monitored by local and national authorities and competent agencies and non-compliance with these laws can result in administrative orders, substantial fines and criminal penalties, temporary or permanent plant closures and criminal convictions. Our current and past operations, including our historical waste disposal sites, could also expose us to liability to third parties for property damage, personal injury and clean-up obligations. We believe that our manufacturing facilities currently comply, in all material respects, with the applicable material environmental regulations at each of our locations, and as of the date hereof, we are not aware of any environmental issues requiring investigation or remediation on our behalf. However, there can be no assurance that changes in such laws and regulations, or interpretations thereof, will not require us to incur significant costs, which could have an adverse impact on our operations.
118
Directors and Executive Officers
The following table sets forth information regarding the directors and executive officers of the Company.
Directors and Executive Officers |
Age | Position/Title | ||||
Sergio Stevanato |
78 | DirectorEmeritus Chairman | ||||
Franco Stevanato |
47 | DirectorExecutive Chairman | ||||
Marco Stevanato |
48 | DirectorVice-Chairman | ||||
Fabiano Nicoletti |
77 | Director | ||||
Alvise Spinazzi |
48 | Director | ||||
Fabrizio Bonanni |
74 | Director | ||||
Fabio Buttignon |
61 | Director | ||||
Madhavan Balachandran |
70 | Director | ||||
Donald Eugene Morel Jr. |
63 | Director | ||||
William Federici |
62 | Director | ||||
Paola Vezzaro |
53 | Director | ||||
Franco Moro |
58 | Director, Chief Executive Officer and Chief Operating Officer | ||||
Marco Dal Lago |
49 | Chief Financial Officer | ||||
Mauro Stocchi |
55 | Chief Business Officer | ||||
Paolo Patri |
51 | Chief Technology Officer |
We intend to require all directors be subject to annual re-election.
Sergio Stevanato. Son of Giovanni Stevanato, founder of the Stevanato Group, Sergio Stevanato has been actively involved in the family business since high-school. He graduated in law from the University of Ferrara in 1969, to then take the leadership of the company. He has spent his whole career in the family business of which he is currently the Emeritus Chairman. In 2007 he was awarded by the President of the Italian Republic the honorary recognition of Knight of Labor (Cavaliere del Lavoro) for his achievements as an entrepreneur.
Franco Stevanato. Son of Sergio Stevanato, Franco Stevanato graduated in Political Science from the University of Trieste in 1998 and attended an Advanced Management Program at the Kellogg School of Management in 2015. During his university years, he gained professional experience in the sales department of Saint Gobain in France. Upon completing his studies, he joined the family business, initially taking up a role in sales. Over the years, he has been the key figure and driving force behind the internationalization of the Company and its continuing development from product diversification via strategic acquisitions and in house innovations to enhanced managerial processes and structural improvements. He also contributed to improving the Stevanato Groups corporate governance by building an effective infrastructure to support decision making and promoting a skills-based board that benefits from specialist expertise and meaningful perspective. He has been CEO of the Group from 2010 to 2020. From 2021, he is the Executive Chairman of the Board.
Marco Stevanato. Son of Sergio Stevanato, Marco Stevanato graduated in Business Administration from the University of Trieste in 1998. After graduation, he gained experience in Germany, Belgium and the United States in the Finance & Controlling department of a German multinational company to then join the family business in 1999. In 2006 he was appointed Vice President of the Stevanato Group and has led the internationalization projects and development of the plants in Monterrey (Mexico), Zhangjiagang (China) and Sete Lagoas (Brazil). He also serves as Chief Executive Officer of SFEM ITALIA S.r.l., the Family Office that manages the investments of the Stevanato family, not related to the industrial group.
Fabiano Nicoletti. Born in Venice in 1943, Fabiano Nicoletti graduated in Solid State Physics from the University of Padua in 1972. He gained more than forty years of experience at Stazione Sperimentale del Vetro
119
(the Italian State Glass Research Institute) in Venice. For a long time, he collaborated in several international committees and working groups and he was one of the founders (and President) of the European Society of Glass Science and Technology (ESG) of which he is Honorary President, the President of USTV (Union Scientifique et Technologique du Verre), as well as the President of the ICG (International Commission on Glass). Both in 1983 and 1993, he was awarded by the President of the Italian Republic the honorary recognitions of Cavaliere Ordine al Merito della Repubblica and of Ufficiale Ordine al Merito della Repubblica, respectively. He has been a member of the board of directors of Stevanato Group since 2003.
Alvise Spinazzi. Graduated in Law from the University of Padua in 1997, he obtained an LL.M. in International Business and Trade Law from Fordham University School of Law in New York. He qualified as a lawyer in New York in 2000 and in Italy in 2001. Before founding with other partners the law firm SAT Studio Legale in Padua in 2007, he practiced in the New York office of the international law firm Simpson Thacher & Bartlett and in the Milan office of Italian law firm Chiomenti. He has been a member of the board of directors of Stevanato Group since 2011.
Fabrizio Bonanni. Holding a doctorate in chemistry, summa cum laude, mention of honor, from the University of Florence, Italy, Mr. Bonanni carried out postdoctoral work in physiological chemistry at the Massachusetts Institute of Technology. He is an alumnus of the Institute for International Management, Northwestern University, J.L. Kellogg Graduate School of Management and of the Executive Program in Manufacturing, Harvard University, Graduate School of Business Administration. He spent 25 years at Baxter International in Italy, Belgium and the U.S. reaching the positions of corporate vice president Quality System and CVP Regulatory and Clinical Affairs. From 1999 to 2013, he served in senior executive roles at Amgen, including senior vice president, Quality and Compliance and corporate compliance officer, senior vice president, Manufacturing and executive vice president, Operations. Currently, he is a member of the board of INCOG BioPharma Services, a director of UCLAs Technology Development Corporation and serves on the Advisory Board of InCube Labs of San Jose, California. His past board memberships include XBiotech, where he chaired the Audit Committee, Menarini Biotech, and Theranos, where he chaired the Compliance and Quality Committee. He has been a member of the board of directors of Stevanato Group since 2013.
Fabio Buttignon. Graduated in Economics and Business Administration from the University Ca Foscari of Venice in 1983. He carried out research activities in Finance and Strategy at the University of California, Los Angeles. He was research fellow, assistant professor and associate professor of Business Administration at the University Ca Foscari of Venice. Mr. Buttignon is currently full professor of Corporate Finance at the University of Padua, Department of Economics and Management. Qualified as Dottore Commercialista and Revisore dei Conti (CPA and Statutory Auditor), he is founder and managing partner of Buttignon Zotti Milan & Co., a financial advisory boutique specialized in corporate finance and accounting services. He has been a member of the board of directors of Stevanato Group since 2014.
Madhavan Balachandran. Holding a Master of Science degree in Chemical Engineering from The State University of New York at Buffalo and an MBA from East Carolina University, Mr. Balachandran is Chief Operating Officer of Nutcracker Therapeutics, a developer of mRNA therapeutics, a position he has held since September 2020. He previously served as Chief Executive Officer of ADRx, Inc., a pre-clinical stage biotechnology company, since August 2019. Prior to that, he was Executive Vice President, Operations of Amgen Inc. from August 2012 until July 2016 and retired as an Executive Vice President in January 2017, having served in various management positions since joining the company in 1997. Prior to his tenure at Amgen, Mr. Balachandran held leadership positions at Copley Pharmaceuticals, now a part of Teva Pharmaceuticals Industries Ltd. and Burroughs Welcome Company, a predecessor before mergers of GlaxoSmithKline plc. He currently serves as a director in Catalent Inc. and uniQure NV. He has been a member of the board of directors of Stevanato Group since 2018.
Donald Eugene Morel Jr. Holding BS degree in Metallurgical Engineering from Lafayette, an MS in Materials Science and a Ph.D. in Materials Science and Veterinary Medicine from Cornell University, Dr. Morel
120
also completed the Executive Program at Darden School of BusinessUniversity of Virginia. After gaining experience in a broad range of space related research programs focused on advanced satellite systems, Mr. Morel joined West Pharmaceutical Services, Inc., where he served as Chairman from April 2003 and Chief Executive Officer from April 2002 until his retirement in June of 2015. Dr. Morel has authored or co-authored over thirty scientific publications and was elected a fellow of the American Institute for Medical & Biologic Engineering. he currently serves as a member of the board of directors in Catalent Inc. and Integra Life Sciences Holdings. He has been a member of the board of directors of Stevanato Group since 2018.
William Federici. Holding a BA in Economics from Rutgers University, Livingston College and an MBA in Professional Accounting from Rutgers University, he is a member of the American Institute of Certified Public Accountants. Mr. Federici has been a member of the board of directors of Zynerba Pharmaceuticals, Inc., a Specialty Pharmaceutical, U.S. public company, where he has served as Audit Committee Board Chair since 2015. Mr. Federici joined West Pharmaceutical Services, Inc., a NYSE traded U.S. public company, in 2003 as Chief Financial Officer after more than 20 years experience in public accounting primarily serving the Pharmaceutical Industry. He retired from West Pharmaceutical Services, Inc. in 2018. He has been appointed as member of the board of directors of Stevanato Group in May 2021.
Paola Vezzaro. Graduated, summa cum laude, in Business Administration from the University Commerciale Luigi Bocconi in Milan in 1993 and, subsequently, graduated in Political Science and Sociology from the University of Milan. She also obtained a Master in Human Resources from Cattolica University in Milan. Mrs. Vezzaro has an extensive experience in the HR fields, having served as HR director in many primary companies. She joined Engie in 2011, where she has held several HR high-profile international positions. Since July 2019, she has been serving as Chief Human Resources and Health & Safety Officer North, South and Eastern Europe for Engie. She has been appointed as member of the board of directors of Stevanato Group in May 2021.
Franco Moro. Graduated in Chemical Engineering from the University of Padua in 1987, he obtained an MBA from SDA Bocconi in Milan. Mr. Moro has gained significant experience managing global manufacturing companies for over 30 years. He has worked as plant director of FISFabbrica Italiana Sintetici and then of Cambrex Profarmaco Milano, before taking over as Chief Executive Officer of FISFabbrica Italiana Sintetici from 2010 to 2018. Mr. Moro joined Stevanato Group in 2019 and after serving as Chief Operating Officer for 2 years, was appointed as Chief Executive Officer in February 2021. He has been appointed as member of the board of directors of Stevanato Group since February 2021.
Marco Dal Lago. Graduated from Ca Foscari University of Venice in 1997 with a degree in Business Administration. Mr. Dal Lago joined Stevanato Group in January 2020, after about 25 years of experience in the fields of controlling, finance, administration, compliance and risk management, working in multinational industrial companies and coordinating multi-year planning and mergers & acquisitions processes. Mr. Dal Lago is currently Chief Financial Officer at Stevanato Group, with responsibility for the organization, supervision and guarantee of Group administration, finance and controlling activities.
Mauro Stocchi. Graduated from Ca Foscari University of Venice in 1991 and holds a Masters of Business Administration from SDA Bocconi in Milan. Mr. Stocchi commenced his career in De Longhi S.p.A. followed by a 10-year period within the Siemens Group. He joined Stevanato Group in 2004 and in 2008, Mr. Stocchi was appointed CFO of the Group while retaining responsibility over business development activities. From 2010, he covered the position of Corporate General Manager with direct responsibility for all corporate functions. He also served as General Manager of the Pharmaceutical System Division and is currently Chief Business Officer of the Group with responsibilities of strategic business development, sales, product management, marketing and communication and drug delivery systems business.
Paolo Patri. Graduated from the University of Milan in 1995 with a degree in Chemistry. Mr. Patri has over 20 years of experience in the pharmaceutical industry, both in production and in the development of pharmaceuticals and biotech, gaining a significant track record of achieving global regulatory approvals for both
121
large, small molecules and combination medicinal product through standard and accelerated programs. Mr. Patri held various positions at different international organizations, including Cambrex Profarmaco, Janseen-Cilag a Johnson & Johnson company, Chiesi Farmaceutici and Dompé Farmaceutici. In Chiesi Farmaceutici he held from 2008 to 2017 the role of Global Head of CMC (Chemistry, Manufacturing and Controls). In Dompé Farmaceutici, he held the role of Chief Manufacturing Officer. Mr. Patri joined Stevanato Group in October 2018 and has since assumed the role of Chief Technology Officer, overseeing the management of the research and development department, as well as investments, projects and other activities supporting the Group vision.
Corporate Governance Practice and Foreign Private Issuer Status
As a foreign private issuer, as defined by the SEC, we will be permitted to follow home country corporate governance practices instead of certain corporate governance practices required by NYSE applicable to U.S. domestic issuers.
If we cease to be a foreign private issuer under the NYSE rules and the Exchange Act, as applicable, we will take all action necessary to comply with applicable NYSE corporate governance rules.
Because we are a foreign private issuer, our directors and senior management are not subject to short-swing profit and insider trading reporting obligations under Section 16 of the Exchange Act. They will, however, be subject to the obligations to report changes in share ownership under Section 13 of the Exchange Act and related SEC rules.
The provisions of the Italian Civil Code regulating companies that are listed on a regulated market (società che fanno ricorso al mercato di capitale di rischio) apply to the Company. As described in more detail below, these rules differ in a number of ways from those applicable to U.S. domestic companies under NYSE listing standards, as set forth in the NYSE Listed Company Manual.
Board of Directors
The Italian Civil Code provides for three alternative corporate governance systems: (i) the traditional model (comprising a board of directors and a board of statutory auditors), (ii) the two-tier board system (comprising a management board and a supervisory board) or (iii) the one-tier board system (comprising a board of directors and an audit committee).
In May 2021, we adopted the one-tier corporate governance system, which provides for a Board of Directors and an Audit Committee. The board of directors is appointed by the shareholders meeting and the Audit Committee is, in turn, appointed by the board of directors from among its members (as appointed by the shareholders meeting).
The board of directors is generally responsible for managing the affairs of the company. The Board may therefore undertake all transactions considered necessary, useful or appropriate in achieving the companys corporate purpose except only for such actions as are reserved to the ordinary or extraordinary shareholders meeting by applicable law or the articles of association.
Within the limits prescribed by Italian Law, the Board may delegate its general powers to an executive committee and/or managing director to handle the day-to-day management consistent with the guidelines set by the board of directors. The Chairman of the board of directors, any deputy chairman as well as any managing director are authorized to represent and bind the company in their capacity as legal representatives. The board of directors and any managing director may also delegate the power to carry out certain acts within the scope of their respective authority.
Our board of directors consists of 12 directors (including the members of the Audit Committee).
122
Foreign Private Issuer Status
As a foreign private issuer whose shares will be listed on the NYSE, we will have the option to follow certain Italian corporate governance practices rather than those of NYSE, except to the extent that such laws would be contrary to U.S. securities laws and provided that we disclose the practices we are not following and describe the home country practices we are following. We intend to rely on this foreign private issuer exemption with respect to the following NYSE Corporate Governance Standards:
| Section 303A of the NYSE Listed Company Manual, which requires that a majority of the board be independent (although all of the members of the audit committee must be independent under the Exchange Act); |
| Section 303A.05 of the NYSE Listed Company Manual, which requires boards to have a compensation committee consisting entirely of independent directors; and |
| Section 303A.03 of the NYSE Listed Company Manual, which requires an issuer to have regularly scheduled meetings at which only independent directors attend |
Except as stated above, we intend to comply with the rules generally applicable to U.S. domestic companies listed on NYSE. We may in the future decide to use other foreign private issuer exemptions with respect to some or all of the other NYSE listing requirements. Following our home country governance practices, as opposed to the requirements that would otherwise apply to a company listed on NYSE, may provide less protection than is accorded to investors under NYSE listing requirements applicable to domestic issuers. For more information, see Risk FactorsRisks Relating to our Initial Public Offering and Ownership of our SharesAs we are a foreign private issuer and intend to follow certain home country corporate governance practices, our shareholders may not have the same protections afforded to shareholders of companies that are subject to all NYSE corporate governance requirements.
Committees of the Board of Directors
On May 28, 2021, we established an Audit Committee while on June 16, 2021, we established a Compensation Committee, a Nomination and Corporate Governance Committee, a ESG Committee and a Business and Strategy Committee. Each of these committees are governed by a charter that is consistent with applicable Italian Law and SEC and NYSE corporate governance rules, and which is available on the Investors section of our website at https://www.stevanatogroup.com/en/. The information contained on, or that can be accessed through, our website does not form part of this prospectus.
Audit Committee
Our Audit Committee consists, of William Federici, Fabio Buttignon and Fabrizio Bonanni. Mr. Federici serves as the chairman of the Audit Committee. Our board determined that all members of our Audit Committee meet the requirements for financial literacy under the applicable rules and regulations of the SEC and the NYSE corporate governance rules. Our board determined that Mr. Buttignon is an audit committee financial expert as defined by the SEC rules and has the requisite financial experience as defined by the NYSE corporate governance rules. Further, Mr. Buttignon is a certified accountant and, in such capacity, is enrolled with the Italian Registry of Statutory Auditors.
Our board determined that each member of our Audit Committee is independent as such term is defined under Italian Law, it being understood that a director cannot qualify as independent (and, therefore, cannot be an audit committee member) if any of the following applies: (i) being interdict, incapacitated, bankrupt, or convicted of an offence that implies the interdiction, even temporary, from public offices, or the inability to exercise managerial offices; (ii) being the spouse, relatives and relatives-in-law within the fourth degree of directors of the company, the directors themselves, the spouse, relatives and relatives-in-law within the fourth degree of directors of the companies controlled by the concerned company, of the companies that control it and of those subject to
123
common control; and (iii) being linked to the company or to the companies controlled by it or to the companies that control it or to those subject to common control by an employment relationship or by an ongoing relationship of consultancy or paid work, or by other relationships of a financial nature that compromise their independence.
Our Audit Committee is compliant with applicable rules and regulations of the SEC and NYSE corporate governance rules as well as Italian Law requirements with respect to its composition, expertise requisites and functioning.
The Audit Committee is responsible for, among other things, assisting the board in the oversight of:
| the accounting and financial reporting practices of the Company as well as the integrity of the financial statements; |
| the adequacy of the Companys organizational structure, internal control system, and administrative and accounting systems; |
| the Companys risk assessment and risk management processes to ensure such processes are effective; |
| supervise compliance with legal and regulatory requirements including as required by the rules and regulations of the SEC, by preparing the report of the Audit Committee to be included in the Companys annual proxy statement; |
| the independence and qualifications of the Companys registered public accounting firm. |
The Audit Committee meets regularly and in a manner that the Audit Committee may deem fit and, at least once every ninety calendar days. Periodically, the Audit Committee also meets with our independent auditor and members of our management.
Compensation Committee
Although not required under Italian law, on June 16, 2021, we established a compensation committee. This committee consists of Madhavan Balachandran (as chairman), Donald Eugene Morel Jr. and Paola Vezzaro.
The Compensation Committee is responsible for, among other things:
| analyzing, discussing and making recommendations to the board of directors on remuneration policies for directors and senior management and review their appropriateness; |
| within the terms of the agreed policy and in consultation with the board chairman determining the total individual remuneration package of each executive director; |
| assessing, reviewing and recommending for approval by the board, the CEOs annual remuneration package and performance objectives based on the evaluation of the CEOs performance; |
| reviewing and approving any significant changes to the overall compensation program and incentive plans. |
Pursuant to Italian Law, the shareholders meeting determines the base compensation of the members of the board of directors. After consultation with the Audit Committee, the board of directors may determine the compensation of executive officers, including the CEO. If the articles of association so provide, the shareholders meeting may determine an aggregate amount for the remuneration of all directors, including executive officers.
Nomination and Corporate Governance Committee
Although not required under Italian law, on June 16, 2021, we established a nomination and corporate governance committee. This committee consists of Franco Stevanato (as chairman), Madhavan Balachandran, Donald Eugene Morel Jr. and Fabrizio Bonanni.
124
The Nomination and Corporate Governance Committee is responsible for, among other things:
| reviewing the structure, size and composition (including the skills, knowledge, experience and diversity) of the board of directors; |
| identifying and appointing independent board of directors candidates to fill independent Board vacancies as and when these arise; |
| keeping under review the leadership needs of the organization, both executive and non-executive, with a view to ensuring the continuing ability of the organization to compete effectively in the marketplace; |
| constantly reviewing corporate governance rules and practices and ensuring that corporate governance codes that apply to the Company are observed; |
| formulating succession plans. |
If, during the term of their office, one or more directors resign, the other directors must replace them by a resolution approved by the Audit Committee, provided that the majority of the board still comprises directors appointed by the companys shareholders. The coopted directors remain in office until the next shareholders meeting. If at any time more than half of the members of the board of directors appointed by the shareholders meeting resign, the remaining members of the board of directors (or the audit committee if all the members of the board of directors have resigned or ceased to be directors) must promptly call an ordinary shareholders meeting to appoint the new directors and until such time as the new directors are appointed, the resigning directors remain in office.
Business & Strategy Committee
On June 16, 2021, we established a Business and Strategy Committee. This committee consists of Donald Eugene Morel Jr. (as chairman), Sergio Stevanato, Franco Stevanato, Marco Stevanato, Madhavan Balachandran, Fabrizio Bonanni, Franco Moro and William Federici.
The Business and Strategy Committee is responsible for, among other things:
| periodically reviewing and making recommendations on medium and long-term strategies and strategic plans to be pursued; |
| reviewing the annual business plan, budget and capital structure of the Group before onward submission to the Board for approval; |
| meeting with management periodically to monitor the Companys progress against its strategic goals and to discuss, review and recommend to the Board any such matters or issues which relate to the strategic planning of the Group; |
| ensuring the board of directors is regularly appraised of the Companys progress with respect to implementation of any approved strategy. |
ESG Committee
On June 16, 2021, we established a ESG Committee. Our ESG Committee consists of Fabiano Nicoletti (as chairman), Paola Vezzaro and William Federici.
The ESG Committee is responsible for, among other things:
| assisting the Company in setting ESG strategies, including by reviewing, challenging and overseeing the content of and approach to strategy concerning ESG matters; |
| supervising compliance of ESG disclosure and ensuring a sustainability strategy is considered by the Board as part of the overall business strategy of the Group; |
125
| bringing to the attention of the board of directors emerging ESG matters and reviewing, challenging and approving annual sustainability KPIs and related targets in line with the agreed sustainability strategy; |
| putting systems in place to monitor ESG Matters and reviewing compliance with material regulation and legislation on ESG/sustainability issues, and any public ESG/sustainability-related commitments voluntarily subscribed to by the Group. |
Code of Ethics
Our Code of Business Conduct and Ethics, which will become effective upon completion of this offering, is a code of ethics within the meaning of Item 406(b) of Regulation S-K of the Exchange Act and covers a broad range of matters including the handling of conflicts of interest, compliance issues and other corporate policies such as equal opportunity and non-discrimination standards.
Duties of Directors and Conflict of Interests
Under Italian law, the primary duty of directors is to carry out all activities as are necessary for the achievement of the corporate purpose in accordance with applicable law and the articles of association.
In particular, directors have a general duty to act with care, without self-interest and on a well-informed basis.
The applicable standard of conduct is determined, on a case-by-case basis, taking into account the characteristics of the corporation, the specific tasks and responsibilities conferred to the single directors, and the personal skills of the latter.
In addition, directors have numerous specific duties and obligations, such as, inter alia:keeping the corporations books, records and other databases (including the shareholders register) in such a manner that the corporations rights and obligations may be ascertained from the interested parties at all times;preparing the corporations annual accounts according with the applicable accounting principles and filing them with the Companies Register on time;registering the corporation with the Companies Register and keeping the registered information up to date;convening annually or when necessary or required by the shareholders the general meetings of the corporation; andmonitoring the own funds and financial position of the corporation and initiate the actions or procedures contemplated by the law in case of (i) losses entailing the reduction of the own funds of the corporation below the threshold of two thirds of the share capital or (ii) income, asset or financial unbalances having certain characteristics
The board of directors may delegate certain powers to one or more managing directors (amministratori delegati), determine the nature and scope of the powers delegated to each director and revoke such delegation at any time. The managing directors must report to the board of directors and the audit committee at least every 180 days on the companys business and the main transactions carried out by the company or by its subsidiaries.
Directors having any interest in a proposed transaction must disclose such interest to the board of directors and to the audit committee, even if such interest is not (or is deemed not to be) in conflict with the interest of the company in the same transaction. The interested director is not required to abstain from voting on the resolution approving the transaction, but the resolution must state explicitly the reasons for, and the benefit to the company of, the approved transaction. In the event that these provisions are not complied with, or that the transaction would not have been approved but for the vote of the interested director, the resolution may be challenged by a director or by the audit committee if the approved transaction is (or is likely to be) prejudicial to the company. If the director carrying an interest in the transaction is the CEO and the transaction falls within his/her competence, he/she will in any case have to abstain from carrying out the transaction on behalf of the Company and will defer authority to the board of directors.
126
Terms of Directors and Officers
The board of directors is elected by the ordinary shareholders meeting of the Company, for the period established at the time of election but in any event for no more than three fiscal years. A director may be reappointed for successive terms.
The board of directorsmay also appoint one or more general managers (direttori generali), who must report directly to the board of directors and confer powers for single acts or categories of acts to employees of the company or third-party representatives.
Under Italian law and pursuant to our articles of association, directors may be removed from office at any time by the shareholders meeting. A director that is removed without cause may have a claim for damages against the Company. Directors may resign at any time by written notice to the board of directors and to the chairman of the audit committee. The board of directors, subject to the approval of the audit committee, must appoint substitute directors to fill vacancies arising from removals or resignations to serve until the next ordinary shareholders meeting.
If at any time more than half of the members of the board of directors appointed by the shareholders meeting of the Company resign, the remaining members of the board of directors (or the audit committee if all the members of the board of directors have resigned or ceased to be directors) must promptly call an ordinary shareholders meeting to appoint the new directors and until such time as the new directors are appointed, the resigning directors remain in office.
Key management and Board Member Compensation
The aggregate compensation for members of our board of directors (including pension expense and long-term benefits) was 2,178,000 for the year ended December 31, 2020.
The aggregate compensation for members of our key management personnel (excluding Chairman and Chief Executive Officer) was 3,206,000 for the year ended December 31, 2020. The compensation for each of our key management personnel consists of the following elements: base salary, bonus based on revenue and KPI-based bonus, employment-related taxes and share-based payments.
Stock Grant Plan
On March 4, 2021, we approved by means of resolution of the ordinary shareholders meeting, a restricted stock grant plan (the Stock Grant Plan) with a duration of six years, running from January 1, 2021 until December 31, 2026, which is governed by its own regulation (the Regulation). The total amount of ordinary shares available for granting under the Stock Grant Plan will constitute 0.5% of the issued share capital as of January 1, 2021.
The Stock Grant Plan provides for (i) the right of the beneficiaries to be granted a certain number of ordinary shares of the Company, free of any charges; and (ii) the right of the beneficiaries to be granted a further number of ordinary shares of the Company, in the event that certain over-performances with respect to the Company financial targets have been met.
Both the shares granted as described sub (i) above and those granted as described sub (ii) above, are subject to the lock-up period and the call option right of the Company, described below.
Eligibility, Awards, and Administration
Those eligible to participate in the Stock Grant Plan are (i) any employees of either the Company, or any of its subsidiaries, and/or (ii) any self-employed individuals who work for either the Company, or any of its subsidiaries, who have been identified from time to time by the board of directors of the Company as holding a strategic role in either the company, or any of its subsidiaries.
127
The granting of the ordinary shares to the beneficiaries is subject to each of them meeting, by the date of the offer of shares, the following requirements:
(a) | being in a permanent employment relationship with, or being in a self-employment relationship in favor of the Company, or any of its subsidiaries; and |
(b) | the non-commencement of the notice period due to resignation, dismissal for just cause or termination of the self-employment relationship. |
Our board of directors is entrusted with managing the Stock Grant Plan. In particular, in compliance with the Regulation, our board of directors has the power, inter alia, to identify the beneficiaries of the Stock Grant Plan among those employees or self-employed individuals who have taken on a strategic role within the Companys group, and to determine the number of ordinary shares to be granted to the beneficiaries.
Vesting and Holding
The Stock Grant Plan provides for three two-year vesting periods: one from January 1, 2021 to December 31, 2022, one from January 1, 2023 to December 31, 2024, and one from January 1, 2025 to December 31, 2026. At the beginning of each of the vesting periods, the Company will grant, free of any charges, to the beneficiaries (except for the tax charges financed by the Company), a certain amount of its ordinary shares, which shall be indicated in the relevant grant letters addressed to the beneficiaries.
Lock-up Period
The Stock Grant Plan provides for three one-year lock-up periods, starting at the end of each of the three respective vesting periods.
Until the expiry of the relevant lock-up periods, the beneficiaries, or any of their heirs in case of the beneficiaries death, may not transfer the ordinary shares they have been granted in the prior vesting period to individuals and/or entities other than the Company. Furthermore, until the end of each lock-up period, each beneficiary must keep the shares free from any options or pre-emption rights or any other restriction or limitation, contractual or otherwise, except for those restrictions or limitations arising from the Companys articles of association and/or the Stock Grant Plan.
Call Option
Pursuant to the Regulation, each of the beneficiaries enters into a separate call option agreement with the Company, by means of which each of them undertakes, irrevocably, to sell to the Company, all or part of the ordinary shares they have been granted, in the event that the Company decides to exercise its call option right.
The Company is entitled to exercise its call option right subject to the occurrence of at least one of the following events:
(a) | following the date on which the beneficiary has been granted the ordinary shares and within the relevant vesting period, (i) either the beneficiarys permanent employment relationship with, or the self-employment relationship in favor of, the Company or any of its subsidiaries has ceased because of death, resignation or dismissal for just cause or for any other justified reason, or (ii) the notice period for resignation, dismissal for just cause or justified reason or termination of the self-employment relationship is expiringunless a new employment relationship of any kind or renewal of the previous one with the Company or any of its subsidiaries is envisaged; |
(b) | at the end of the relevant biennial vesting period, the Company has not reached, in whole or in part, either the cumulative revenues targets and/or the cumulative EBITDA targets, the evaluation of which shall be carried out on the basis of the data emerging from the consolidated financial statements for the relevant two years ending on December 31 of each year of duration of the Stock Grant Plan. |
128
With respect to the events sub (a) above, the Company shall be entitled to exercise its call option right on all the ordinary shares with which the concerned beneficiary has been granted; while, with respect to the events sub (b), the Company shall be entitled to exercise its call option right on a percentage of the ordinary shares with which the concerned beneficiary has been granted, which depends on the extent to which the cumulative financial turnover has departed from the Companys financial targets.
Claw-back
Within two years from the end of the lock-up period, the Company shall be entitled to request from the beneficiaries the restitution, in whole or in part, of either the granted ordinary shares and/or the further amount of granted ordinary shares, in the event that the degree of achievement of the targets set forth in the business plan of the Company related to a vesting period, has been calculated on the basis of data that subsequently turned out to be erroneous and the differences between this data used and the adjusted data are such as to have caused the non-exercise of the call option right by the company. In the event that the ordinary shares have already been sold by the beneficiaries to third-parties, the Company will have the right to request the restitution of the sale value of the ordinary shares to such beneficiaries.
Certain Transactions
Our board of directors and/or our shareholders meeting, should it be required or appropriate in connection with extraordinary transactions, events or special circumstances concerning the Company, or any of its subsidiaries, has the right to revoke the Stock Grant Plan or suspend its execution by means of a thirty-day prior written notice to be sent to the Stock Grant Plans beneficiaries.
In case of revocation or suspension of the Stock Grant Plan, the Company shall grant each of the beneficiaries with a different kind of incentive, unless, after the conclusion of the concerned extraordinary transaction, event or special circumstance, our board of directors and/or our shareholders meeting will issue a new incentive plan in the event of revocation of the Stock Grant Plan, or the reactivation of the latter in the event of its suspension, in both cases in such a way as to ensure that the granted incentives shall be substantially equivalent to those that would have been due to each beneficiary pursuant to the Stock Grant Plan.
129
PRINCIPAL AND SELLING SHAREHOLDER
Except as specifically noted, the following table sets forth information with respect to the beneficial ownership of our shares as of the date of this prospectus (i) prior to the completion of this offering and (ii) as adjusted to reflect the sale of our ordinary shares in this offering for:
| our directors and executive officers individually and as a group; |
| each person, or group of affiliated persons, known to us to own beneficially more than 5% of our total ordinary shares; and |
| the Selling Shareholder. |
The calculations in the table below are based on 272,427,240 shares on an as-converted basis outstanding before this offering (including 1,084,725 ordinary shares and 271,342,515 Class A shares, 30,840,555 of which held in treasury), and 294,827,240 shares outstanding immediately after the completion of this offering (including 33,084,725 ordinary shares and 261,742,515 Class A shares, 30,840,555 of which held in treasury), assuming the underwriters do not exercise their over-allotment option.
The percentage of shares beneficially owned before the offering is computed on the basis of 272,427,240 of our shares before this offering. The percentage of shares beneficially owned after the offering is based on the number of our shares to be outstanding after this offering, including the 9,600,000 of our ordinary shares that the Selling Shareholder is selling in this offering, and assumes no exercise of the option to purchase additional ordinary shares from us or the Selling Shareholder. Shares that a person has the right to acquire within 60 days of the date of the offering are deemed outstanding for purposes of computing the percentage ownership of the person holding such rights, but are not deemed outstanding for purposes of computing the percentage ownership of any other person, except with respect to the percentage ownership of all executive officers and board members as a group. Unless otherwise indicated below, the address for each beneficial owner listed is Via Molinella, no. 17, Padua, Piombino Dese, Italy.
Shares Beneficially Owned Prior to This Offering |
Shares Being Sold in This Offering |
Shares Beneficially Owned After This Offering |
||||||||||||||||||||||||||||||
Excluding Exercise of Option to Purchase Additional Ordinary Shares |
Including Exercise of Option to Purchase Additional Ordinary Shares |
|||||||||||||||||||||||||||||||
Number | % | Number | % | Number | % | Number | % | |||||||||||||||||||||||||
Directors and Executive Officers: |
||||||||||||||||||||||||||||||||
Sergio Stevanato |
| | | | | | | | ||||||||||||||||||||||||
Franco Stevanato |
| | | | | | | | ||||||||||||||||||||||||
Marco Stevanato |
| | | | | | | | ||||||||||||||||||||||||
Fabiano Nicoletti |
| | | | | | | | ||||||||||||||||||||||||
Alvise Spinazzi |
| | | | | | | | ||||||||||||||||||||||||
Fabrizio Bonanni(1) |
146,633 | * | | | 146,633 | * | 146,633 | * | ||||||||||||||||||||||||
Fabio Buttignon |
| | | | | | | | ||||||||||||||||||||||||
Madhavan Balachandran |
58,103 | * | | | 58,103 | * | 58,103 | * | ||||||||||||||||||||||||
Donald Jr Eugene Morel |
26,069 | * | | | 26,069 | * | 26,069 | * | ||||||||||||||||||||||||
William Federici |
15,636 | * | | | 15,636 | * | 15,636 | * | ||||||||||||||||||||||||
Paola Vezzaro |
| | | | | | | | ||||||||||||||||||||||||
Franco Moro(2) |
81,720 | * | | | 81,720 | * | 81,720 | * | ||||||||||||||||||||||||
Marco Dal Lago(2) |
61,290 | * | | | 61,290 | * | 61,290 | * | ||||||||||||||||||||||||
Mauro Stocchi(2) |
585,660 | * | | | 585,660 | * | 585,660 | * | ||||||||||||||||||||||||
Paolo Patri(2) |
61,290 | * | | | 61,290 | * | 61,290 | * |
130
Shares Beneficially Owned Prior to This Offering |
Shares Being Sold in This Offering |
Shares Beneficially Owned After This Offering | ||||||||||||||||||||||||||||||
Excluding Exercise of Option to Purchase Additional Ordinary Shares |
Including Exercise of Option to Purchase Additional Ordinary Shares |
|||||||||||||||||||||||||||||||
Number | % | Number | % | Number | % | Number | % | |||||||||||||||||||||||||
All Directors and Executive Officers as a Group (15 persons) |
1,036,401 | * | | | 1,036,401 | * | 1,036,401 | * | ||||||||||||||||||||||||
5% or Greater Shareholders: |
||||||||||||||||||||||||||||||||
Stevanato Holding S.r.l.(3) |
240,501,960 | 88.28 | % | 9,600,000 | 3.52 | % | 230,901,960 | 78.32 | % | 229,461,960 | 76.95 | % |
* | Less than 1% of our total shares on an as-converrted basis outstanding as of the date of this prospectus. |
(1) | Mr. Bonanni holds 10,433 ordinary shares directly and 136,200 ordinary shares through a fiduciary company, Hera Societa Fiduciara e di Revisione S.p.A. |
(2) | Ordinary shares hares held through Hera Societa Fiduciaria e di Revisione S.p.A. |
(3) | These are Class A shares. Sergio Stevanato currently holds a voting interest of approximately 68% in Stevanato Holding, while Franco Stevanato and Marco Stevanato hold a voting interest of approximately 16% each in Stevanato Holding. Notwithstanding this, under Stevanato Holdings articles of association, (i) the sale of the Stevanato Group shares held by Stevanato Holding or of any rights attaching to them, as well as the creation of encumbrances on such shares or on the rights attaching to them, and (ii) any transaction concerning Stevanato Group as a result of which Stevanato Holding would cease to hold the majority of the voting rights in the ordinary shareholders meeting of Stevanato Group, require the unanimous vote of the board of directors of Stevanato Holding, which is composed of Sergio Stevanato, Franco Stevanato and Marco Stevanato. According to the current articles of association of Stevanato Holding, all decisions concerning the exercise of the voting rights of the Stevanato Group shares held by Stevanato Holding (other than in the cases set forth in point (ii) above) require approval by a majority of the board of directors of Stevanato Holding, including always the favorable vote of Sergio Stevanato. Accordingly, none of Sergio Stevanato, Franco Stevanato and Marco Stevanato may be deemed to individually control, or to hold the beneficial ownership of, Stevanato Holding and, indirectly, the Stevanato Group shareholding held by Stevanato Holding. Stevanato Holdings address is via N. Tommaseo, no. 69/D, Padua, Italy. |
HISTORY OF SECURITIES ISSUANCES
Before this offering, our authorized share capital was 20,002,000.00 divided into 272,427,240 shares without par value, including 1,084,725 ordinary shares and 271,342,515 Class A shares. Over the past three years, our share capital has remained unchanged, while the number of shares has changed as follows:
- on March 4, 2021 from 20,002 to 100,010,000; and
- on July 1, 2021 from 100,010,000 to 272,427,240.
In connection with the split that occurred on July 1, 2021, all of the ordinary shares held by the Selling Shareholder and those held in treasury were converted into Class A shares.
131
CERTAIN RELATIONSHIPS AND RELATED PARTY TRANSACTIONS
In connection with this offering, our Board will adopt a written statement of policy for the evaluation of and the approval, disapproval and monitoring of transactions involving us and related persons. For the purposes of the policy, related persons will include our executive officers, directors, director nominees, and shareholders owning five percent or more of our outstanding shares, and each of their respective immediate family members.
The policy will cover any transaction, arrangement or relationship, or any series of similar transactions, arrangements or relationships, in which we, or any of our parent or subsidiary companies, were or are to be a participant, and which are unusual in their nature or conditions, involving goods, services or tangible or intangible assets.
Pursuant to this policy, our management will present to our Audit Committee each proposed related person transaction, including all relevant facts and circumstances relating thereto. Our Audit Committee will then:
| review the relevant facts and circumstances of each related person transaction, including the financial terms of such transaction, the benefits and perceived benefit (or lack thereof) to the Group, the availability of other sources for comparable products or services, if the transaction is on terms no less favorable to us than those that could be obtained in arms-length dealings with an unrelated third party or employees generally and the extent of the related persons interest in the transaction; and |
| take into account the impact on the independence of any independent director and the actual or apparent conflicts of interest. |
All related person transactions may only be consummated if our Audit Committee has approved or ratified such transaction in accordance with the guidelines set forth in the policy. Certain types of transactions have been pre-approved by our Audit Committee under the policy. These pre-approved transactions include:
| the purchase of our products and resolution of warranty claims relating to our products on an arms-length basis in the ordinary course of business on terms and conditions generally available to other similarly situated customers; |
| transactions where the rates or charges involved in the transactions are determined by competitive bids; |
| transactions in the ordinary course of business where the interest of the related person arises solely from the ownership of a class of equity securities in our Company where all holders of such class of equity securities will receive the same benefit on a pro rata basis; |
| certain employment and compensation arrangements; and |
| transactions in the ordinary course of business where the related persons interest arises only from: (i) his or her position as a director of another entity that is party to the transaction; (ii) an equity interest of less than 10% in another entity that is party to the transaction; or (iii) a limited partnership interest of less than 10%, subject to certain limitations. |
No director may participate in the approval of a related person transaction for which he or she, or his or her immediate family members, is a related person. In the event that an insufficient number of members of the Audit Committee are disinterested with regard to a specific transaction to achieve a quorum, such transaction will be considered by the members of the Board that are disinterested with regard to such transaction.
Within this section, we have calculated the U.S. dollar amounts using the historical exchange rate as of the date of each transaction. Other than compensation arrangements described in Management elsewhere in this prospectus, since January 1, 2018, we have engaged in the following material transactions with our executive officers, directors or holders of more than 5% of our share capital, including their affiliates, which we refer to as our related parties. Stevanato Holding S.r.l. is currently our largest shareholder. Stevanato Holding S.r.l. is also
132
expected to be the Selling Shareholder participating in this offering. Following this offering, assuming no exercise of the underwriters option to purchase additional ordinary shares from Stevanato Holding S.r.l., Stevanato Holding S.r.l. will own 230,901,960 of our Class A shares, which will represent approximately 78.32% of our shares outstanding immediately after this offering. For more information, see Principal and Selling Shareholder.
Loan in Connection with Stock Option Plan
On December 16, 2017 the Company disbursed a loan of 1,069,042.13 to Mr. Fabrizio Bonanni to facilitate the acquisition of ordinary shares under the then existing stock option plan that have been terminated on March 4, 2021. Mr. Fabrizio Bonanni is a member of the board of Stevanato Group. Such loan has been fully reimbursed and terminated on March 10, 2021.
Loan in Connection with Stock Option Plan
On December 16, 2017 the Company disbursed a loan of 2,239,013.35 to Mr. Mauro Stocchi to facilitate the acquisition of ordinary shares under the existing stock option plan. Mr. Mauro Stocchi is Chief Business Officer of Stevanato Group. Such loan have been fully reimbursed and terminated on June 14, 2021 concurrently with the termination of the existing stock option plan.
Sale of Residential Flat in Mexico
On August 19, 2019, Mr. Marco Stevanato purchased a residential flat located in Punto Central (Mexico) from Ompi N.A. for an aggregate amount of 411,978.50. Mr. Marco Stevanato is a beneficial owner of Ompi N.A.
Payment of Service Fees and Rentals
During the years ended December 31, 2018, 2019, and 2020, Ompi of Japan disbursed 313,014.10, 499,136.15, and 349,690.67, respectively, to Winckler & Co., Ltd. in connection with the rental of offices and warehouses and the supply of corporate services. Winckler & Co., Ltd. holds a 49% stake in Ompi of Japan. Although all lease agreements are in force through 2021, the parties to them have been negotiating the insertion of potential fee adjustments in said lease agreements.
Payment of Consultancy Fees
We have an ongoing professional relationship with Studio Legale SAT, pursuant to which Studio Legale SAT provides legal services to the Company from time to time. In connection with these services, we paid 243,414.88, 294,137.18, and 535,902.44, during the years ended December 31, 2018, 2019 and 2020 respectively, to Studio Legale SAT. Mr. Alvise Spinazzi, member of the board of Stevanato Group, is a Partner of Studio Legale SAT.
Payment of Consultancy Fees
On June 7, 2017, we entered into a consulting agreement with MJB Consultants LLC, pursuant to which we agreed to pay MJB Consultants LLC a fee for consulting and legal services provided to us and our subsidiaries. Pursuant to this agreement, we paid 158,902.42, 149,833.27, and 142,412.77, respectively, for the years ended December 31, 2018, 2019 and 2020. Mr. Madhavan Balachandran, member of the board of Stevanato Group, is the beneficial owner of MJB Consultants LLC.
Payment of Consultancy Fees
We have a consulting relationship with Progenitor Capital Partners LLC, pursuant to which we pay Progenitor Capital Partners LLC a fee for consulting and legal services provided to us and our subsidiaries. Pursuant to this relationship, we paid 173,716.81, 89,130.78, and 84,215.60 respectively, for the years ended
133
December 31, 2018, 2019 and 2020. Mr. Don Morel, member of the board of Stevanato Group, is a beneficial owner of Progenitor Capital Partners LLC.
Industrial Rent
In the years 2018, 2019, and 2020, SVM Automatik (a subsidiary of Stevanato Group) disbursed 383,875.38, 390,876.36, and 399,330.37 respectively, to E & FKH Ejendomme ApS in connection with the rental of the plant where SVM Automatik operates. The beneficial owners of E & FKH Ejendomme ApS are family members of the minority shareholders of SVM Automatik, the company from which in 2016 we acquired our stake in SVM Automatik.
Container Closure Systems Revenues
In the years 2018, 2019 and 2020, the Group sold Container Closure Systems to SwissFillon AG, a Swiss filling company start-up, for a total amount of 143,325.00, 167,620.79, and 790,409.69 respectively. Stevanato Group S.p.A. holds a 27% stake in SwissFillon AG.
Payments in connection with Rent
For each of 2019 and 2020, the Company recognized costs for 19,000 to SFEM Italia S.r.l. in connection with certain rental installments. SFEM Italia S.r.l. is controlled by Sergio Stevanato, Franco Stevanato and Marco Stevanato, each members of the Stevanato family.
Donations to Stevanato Foundation
In the years 2018, 2019 and 2020, we made aggregate donations to the Stevanato Foundation of 110,000.00, 130,000.00 and 155,000.00, respectively. The Stevanato Foundation is a charitable organization entirely owned by the Stevanato Family. The Stevanato Foundation exclusively pursues aims of social solidarity, philanthropy and charity, operating in the fields of social and socio-medical assistance, education and training, as well as cultural and educational activities and scientific research. A key function of the Stevanato Foundation is operating in support of the health, education, and maintenance of children and young people who are in strenuous conditions due to health, financial or other reasons.
Share-based Awards to Directors and Executive Management
We have granted share-based awards to certain of our directors and executive management. For more information regarding the warrants granted to our executive management and directors see the section herein entitled ManagementStock Grant Plan.
Indemnification Agreements
On or before the time of effectiveness of this registration statement, an indemnification agreement with our directors and executive officers will be entered into. The indemnification agreement requires us to indemnify our directors and executive officers to the fullest extent permitted by law, save for a limited number of instances, including when (i) officers and directors acts or omissions constituted willful misconduct or gross negligence, (ii) officers and directors did not act in good faith, for a purpose which they reasonably believed to be in, or not opposed to, the best interests of the Company and (iii) officers and directors are held liable towards the Company.
Insofar as indemnification of liabilities arising under the Securities Act may be permitted to executive officers and board members or persons controlling us pursuant to the foregoing provisions, we have been informed that, in the opinion of the SEC, such indemnification is against public policy as expressed in the Securities Act and is therefore unenforceable.
134
The following is a summary of certain information concerning our shares and certain provisions of our articles of association that will be effective upon completion of the offering and of Italian law insofar as they relate to our ordinary shares. It may not contain all of the information that may be relevant to an investor in deciding whether to invest in the ordinary shares. This summary is qualified in its entirety by reference to our articles of association and applicable Italian law. Prospective investors are urged to read the complete form of our articles of association which have been filed with the SEC as an exhibit to our registration statement of which this prospectus is a part.
We are a joint stock company (società per azioni) incorporated in the Republic of Italy and our corporate affairs are governed by our articles of association, certain provisions of the Italian Civil Code, which we refer to as the Civil Code below, and the laws of the Republic of Italy.
Before this offering, our authorized share capital was Euro 20,002,000.00 divided into 272,427,240 shares without par value, broken down as follows: (a) 1,084,725 are ordinary shares; and (b) 271,342,515 Class A shares (the ordinary shares together with the Class A shares, the shares). All of our issued and outstanding shares are fully paid. Immediately upon the completion of this offering, there will be 294,827,240 shares outstanding, assuming the underwriters do not exercise the over-allotment option.
Our Articles of Association
The following are summaries of material provisions of our articles of association, insofar as they relate to the material terms of our shares.
Objects of Our Company.
Our corporate purpose consists of:
i. | the holding and management of shareholdings and interests of any kind, both directly and indirectly, in other companies and entities, including consortia, whether governed by Italian or foreign law, whatever their purpose and object; in particular, the Company holds and manages shareholdings in companies operating in the sectors of design, production and marketing of containers, packaging systems, drug delivery systems, automatic assembly systems and other goods and services mainly (but not exclusively) for the pharmaceutical industry and other related or similar sectors; |
ii. | the provision of administrative, financial, commercial and managerial services for the management and the strategic, technical and/or financial coordination of the companies and entities in which the Company holds shareholdings and interests (or otherwise provided in the interest of such companies), including, but not limited to: coordination of operational strategies, investment programs and development plans; coordination of financial policies and centralized treasury operations and the granting of loans; promotional and research activities; the use of technological assets, the name and intellectual property rights; the administration and management of personnel, both for operational and disciplinary purposes; |
iii. | the research, creation, holding and licensing, registration, deposit, management, purchase, and transfer of any type of right relating to intellectual property rights in general, patents for industrial invention and for ornamental or utility model, trademarks and know-how; |
iv. | the creation, development, registration, acquisition, management, licensing, and sale of intellectual property rights, patents, trademarks, designs, and know-how; |
v. | the sale, purchase, possession and enjoyment of securities and other financial instruments, rights in rem and/or options on the same, whether issued and/or traded in Italy or abroad; and |
135
vi. | the purchase, construction, sale, exchange and management on ones own account of civil industrial, rustic and urban real estate assets. |
The activities referred to in points (i) and (ii) above shall not be carried out vis-à-vis the public. In particular, all activities concerning trusts, collection of savings, exercise of credit, placement on the market of financial instruments are excluded, together with all other activities Italian law reserves for specific entities.
Applicable provisions
Upon listing of the ordinary shares on the NYSE, the Company will be subject to the provisions of the Italian Civil Code applicable to companies that are listed on a regulated market (società che fanno ricorso al mercato del capitale di rischio).
Form, Transfer of Shares and Voting Rights.
The share capital of the Company is equal to Euro 20,002,000.00 and is divided into 272,427,240 shares, broken down as follows: (a) 1,084,725 ordinary shares; and (b) no. 271,342,515 Class A shares. Only the ordinary shares will be traded.
The share capital can also be increased by means of contributions in kind (including receivables) and by issuing different classes of shares, in compliance with the applicable provisions of law and of the articles of association.
The extraordinary shareholders meeting may grant the board of directors, pursuant to article 2443 of the Italian Civil Code, the power to increase the Companys share capital, on one or more occasions, up to a certain amount and for a maximum period of five years from the date of the relevant resolution, as well as the power to issue convertible bonds, up to a certain amount and for a maximum period of five years from the date of the relevant resolution.
The shareholders pre-emption right on the newly issued ordinary shares may be excluded, pursuant to article 2441, paragraph 4, second sentence, of the Italian Civil Code, within the limit of 10 percent of the pre-existing share capital, provided that the issue price is equal to the market value of the ordinary shares and this is confirmed by a specific report by a statutory auditing firm or auditor.
The Company may also issue bonds and equity, as well as non-interest-bearing financial instruments, convertible or non-convertible into shares, warrants and other financial instruments in compliance with the applicable provisions of law and of the articles of association. The shares are not issued in form of share certificates, pursuant to article 2346, paragraph 1 of the Italian Civil Code, and are not subject to the dematerialization regime (regime di dematerializzazione) pursuant to article 83-bis et seq. of the Italian Financial Act (Testo Unico della Finanza). The exercise of shareholders rights is subject to the provisions of article 2355, paragraph 1, of the Italian Civil Code, unless otherwise provided in the articles of association.
The Company keeps the shareholders register (libro soci), in paper form or electronically, in accordance with the provisions of article 2215-bis of the Italian Civil Code and with the laws and regulations in force (the Shareholders Register).
The ordinary shares shall be transferred on the basis of the documentation or of the IT techniques customarily used by NYSE operators, in accordance with the U.S. laws and regulations and with the NYSE listing rules.
The board of directors shall be entitled to establish and maintain, by appointing a third-party company authorized to provide transfer agency services in relation to financial instruments traded on the NYSE and
136
supervised by the competent U.S. Authorities (the Transfer Agent & Registrar), a paper and/or electronic register, in compliance with U.S. regulations (the US Register), in which the parties that hold direct ownership of ordinary shares and the related share transfers are recorded, with a subsequent corresponding entry in the Shareholders Register (the Registered Shareholders). As long as the U.S. Register is established, as a result of the trading of ordinary shares on the NYSE and only with respect to such shares, the registration of transfers in the U.S. Register constitutes a prerequisite for the regularity and validity of the subsequent corresponding entries in the Shareholders Register, without prejudice to the legal nature and relevance of the latter pursuant to Italian law.
The board of directors is entitled to establish procedures, by appointing a third-party providers or otherwise, for the identification of the persons who - as a consequence of the registration in the U.S. Register pursuant to applicable regulations of a single depository entity of the ordinary shares (the Holder of Record), as designated by the company responsible for the centralized management - hold indirect ownership of the ordinary shares (the Beneficial Owners) and are therefore entitled to indirectly exercise the corporate rights pertaining to them.
Only with respect to the ordinary shares:
i. | all persons registered as legal owners of the ordinary shares in both the U.S. Register and the Shareholders Register, are entitled on their own right, by virtue of such registration, to exercise all corporate rights in the manner provided for by applicable law and the articles of association; |
ii. | all Beneficial Owners may exercise all corporate rights, including attendance and voting at shareholders meetings, (a) collectively, through the Holder of Record recorded in both the U.S. Register and the Shareholders Register or a person specifically appointed by such Holder of Record, or (b) individually, either through the Holder of Record or a person specifically appointed by such Holder of Record, or on its own subject to appropriate authorization and/or delegation by the Holder of Record, in compliance with all applicable statutory and regulatory provisions. |
It is understood that the exercise of corporate rights by the Beneficial Owners, in the name of the Holder of Record, both collectively and individually, does not entail any obligation to update the U.S. Register and the Shareholders Register.
Ordinary shares are registered, indivisible, freely transferable and give their holders equal rights. In particular, each ordinary share grants the right to one vote at the ordinary and extraordinary shareholders meetings of the Company and the other administrative rights pertaining to shareholders pursuant to the law and the articles of association.
The Class A shares have the same characteristics and grant the shareholders the same rights as the ordinary shares, except that:
i. | each Class A share entitles the holder to three votes pursuant to article 2351, paragraph 4, of the Italian Civil Code at the Companys ordinary and extraordinary shareholders meetings; |
ii. | the Class A shares are automatically converted (without the need for a resolution by the special meeting of the shareholders holding Class A shares or by the shareholders meeting) into ordinary shares, at a ratio of one ordinary share for each Class A share, in the event of transfer to parties other than Mr. Sergio Stevanato and his heirs (collectively, the Stevanato Family), or other than companies or other entities controlled, including jointly, directly or indirectly, by one or more members of the Stevanato Family, or by trusts (or, alternatively, by the relevant trustees) set up by members of the Stevanato Family, provided that the relevant beneficiaries are (or may be) one or more members of the Stevanato Family; where control means the situation provided for in article 2359, paragraphs 1 and 2, of the Italian Civil Code; |
137
iii. | the Class A shares are convertible into ordinary shares, at a ratio of one ordinary share for each Class A share, in whole or in part and even in several tranches, at the simple request of each holder, to be submitted by means of a communication sent by registered letter, e-mail or any other means capable of providing proof of receipt to the chairman of the board of directors of the Company, with a copy to the chairman of the management control committee. |
Under no circumstances may ordinary shares be converted into Class A shares.
The Company may issue Class A shares only in the event of: (a) capital increase by means of new cash contributions without exclusion or limitation of pre-emption rights; (b) capital increases without new contributions pursuant to article 2442 of the Italian Civil Code; and (c) mergers or spin-offs, in any event in combination with ordinary shares.
In the event of a share capital increase without exclusion of pre-emptive rights to be carried out through the issue of ordinary shares only, the right to subscribe to the newly issued ordinary shares shall be granted pro-rata to all shareholders in proportion to the number of shares (whether ordinary shares or Class A shares) held by each of them at the time of execution of the share capital increase.
In the event of a share capital increase by way of issuance of ordinary shares and Class A shares: (a) the percentage of newly issued ordinary shares and Class A shares shall reflect the same proportion between ordinary shares and Class A shares as that current at the date of the relevant resolution; and (b) the newly issued ordinary shares and Class A shares shall be offered for subscription to the individual shareholders pro-rata to the number of ordinary shares and Class A shares held by each of them at the time of execution of the capital increase, it being understood that if any Class A shares remain unsubscribed by holders of Class A shares at the end of the subscription period, pursuant to article 2441, paragraph 2, of the Italian Civil Code, such Class A shares may be subscribed as ordinary shares by parties other than the holders of Class A shares.
In the event the Company takes part in a merger or demerger transaction, the holders of Class A shares will be entitled to receive, in exchange for or in addition to the Class A shares held by them, shares having the same characteristics as the Class A shares, so far as legally permitted, unless otherwise resolved by a special meeting of the shareholders holding the Class A shares.
Dividends
Payment of any annual dividends by the Company may be made out of its distributable profits and reserves for each relevant year by resolution of the shareholders meeting.
The payment of annual dividends is proposed by the board of directors and is subject to the approval by the shareholders at the annual general meeting. Before dividends are paid out, an amount equal to five percent of net distributable profits shall be allocated to the Companys legal reserve until such reserve is equal to at least one fifth of the nominal value of the Companys issued share capital.
If the Companys own funds are reduced to an amount lower than the Companys share capital as a result of losses, dividends may not be paid until the share capital is reconstituted or reduced by the same amount as the existing own funds. If the conditions provided for by article 2433-bis of the Italian Civil Code are met, the board of directors may authorize, during the course of the financial year, the distribution of interim dividends, subject to certain limitations. The payment of dividends or interim dividends and other distributions to the shareholders shall be made within the terms and in the manner determined by the shareholders meeting or the board of directors that took the relevant resolution.
The board of directors shall determine the relevant date for identifying the Beneficial Owners entitled to receive payment of dividends, other distributions or assignments of rights to the shares held by the Holder of Record. Such date may be set at the same time as, before, or after, the date on which the dividend payment, distribution or assignment is resolved by the ordinary shareholders meeting or the board of directors.
138
Shareholders Meetings
Shareholders are entitled to attend and vote at shareholders meetings, provided that they are registered on the U.S. Register and the Shareholders Register as of the end (on New Yorks time zone) of the 25th business day prior to each shareholders meeting or, in case such day is not a trading day, on the preceding day (the Record Date). Shareholders remain entitled to intervene and vote at the shareholders meetings even if they have transferred their shares after the Record Date. Moreover, the shareholders who are registered as such on the U.S. Register and the Shareholders Register after the Record Date but before the general meetings date are deemed not to have attended or voted in favor of the resolutions passed by such meetings for the purposes of challenging the resolutions or exercising the right of withdrawal pursuant to articles 2377 and 2437 of the Italian Civil Code, respectively. It is understood that the Beneficial Owners who were such as of the Record Date and have obtained registration in both the US Register and the Shareholders Register between the Record Date and the date of the Shareholders Meeting, will be able to challenge the resolutions and exercise the right to withdraw pursuant to articles 2377 and 2437 of the Italian Civil Code, only by proving that they were Beneficial Owners of the shares at the time of the adoption of the relevant resolutions and did not vote in favor of such resolutions.
The shareholders meeting is convened by the board of directors, and may be held in a place other than the registered office, in Italy, in other countries of the European Union, in the United Kingdom or in the United States of America.
The board of directors shall call the shareholders meeting without delay when it is requested to do so by a number of shareholders representing at least five per cent of the share capital of the Company pursuant to article 2367 of the Italian Civil Code.
The shareholders meeting, whether ordinary or extraordinary, shall be held on first call and, if necessary, on second call, as well as on subsequent calls, unless the board of directors establishes in the Notice of Call (as defined below) that the shareholders meeting shall be held in a single call.
Ordinary and extraordinary shareholders meetings must be convened by means of a notice to be published, in the manner specified below, at least 40 days prior to the date of the meeting, if the meeting is convened to elect the members of the board of directors (the Notice of Call).
The Notice of Call shall be published:
i. | in English and Italian, on the Companys website; |
ii. | in Italian language, in the daily newspaper Il Sole 24 Ore or, in case of discontinuation of the publication or objective impediment, first in the daily newspaper Corriere della Sera, or, failing that, in the Official Journal of the Italian Republic. |
The Notice of Call shall contain:
i. | the venue of the meeting; |
ii. | the date and time of the meetings convocation; |
iii. | the agenda; |
iv. | any other information required by the applicable law; |
v. | evidence of the publication on the Companys website of the documentation required by the applicable laws and regulations; |
vi. | the address of the Companys website; and |
vii. | the indication of the Record Date for the meeting. |
139
The shareholders meeting is chaired by the Chairman of the board of directors or, in case of absence or impediment, in order, by a vice-chairman, by a managing director, if appointed, or, in case of absence or impediment of the latter, by another person appointed by the shareholders meeting by majority vote of those present.
The chairman of the shareholders meeting is assisted by a secretary, who may or may not be a shareholder, appointed by the shareholders meeting itself upon proposal of the chairman with the majority vote of those present. In extraordinary shareholders meetings and, in any case, when the chairman deems it appropriate, the secretary may be a notary.
The chairman of the shareholders meeting ascertains the identity and the right to intervene of those attending the meeting, verifies that the shareholders meeting has been duly constituted, regulates its proceedings, establishes the voting procedures in accordance with applicable law and ascertains the results of voting.
Minutes of the shareholders meeting must be drawn up in accordance with applicable law, signed by the chairman of the meeting and by the secretary or notary, and subsequently copied in the book of the meetings and resolutions of the shareholders meeting.
Ordinary Shareholders Meeting
The ordinary shareholders meeting may resolve upon all matters reserved to it by applicable law and by the articles of association.
The ordinary shareholders meeting is validly constituted and approves resolutions in first, second and any subsequent calls or, if so established in the Notice of Call, in a single call, with the quorums required by applicable law. For the purpose of calculating the applicable quorums, the number of votes pertaining to the shares and not the number of shares is taken into account.
In first call, the ordinary shareholders meeting is duly held with the presence of shareholders representing the majority of the overall votes relating to the shares issued by the Company, and approves resolutions with the absolute majority (maggioranza assoluta) of the overall votes relating to the shares held by the shareholders attending the meeting.
In second call, in subsequent calls or in a single call, the ordinary shareholders meeting is duly held regardless of the number of votes represented by the shareholders attending the meeting, and approves resolutions with the absolute majority (maggioranza assoluta) of the overall votes relating to the shares held by the shareholders attending the meeting.
The following table summarizes the quorums required to (a) have the ordinary shareholders meeting validly held and (b) resolve upon the concerned matter.
Ordinary shareholders meeting | ||||
Quorum necessary to |
Quorum to approve resolutions | |||
First call | 50%+1 of the overall votes relating to the shares issued by the Company | 50%+1 of the overall votes relating to the shares held by the shareholders who attend the meeting | ||
Second call | N/A | 50%+1 of the overall votes relating to the shares held by the shareholders who attend the meeting | ||
Subsequent calls | N/A | 50%+1 of the overall votes relating to the shares held by the shareholders who attend the meeting | ||
Single call | N/A | 50%+1 of the overall votes relating to the shares held by the shareholders who attend the meeting |
140
Extraordinary Shareholders Meeting
The extraordinary shareholders meeting shall resolve upon amendments to the articles of association, the appointment, replacement and powers of the liquidators and other matters reserved to it by applicable law.
The extraordinary shareholders meeting is validly constituted and approve resolutions in first, second and any subsequent calls or, if so established in the Notice of Call, in a single call, with the quorums required by applicable law. For the purpose of calculating the quorums, the number of votes pertaining to the shares and not the number of shares is taken into account.
By virtue of the above, in first call, the extraordinary shareholders meeting is duly held with the presence of shareholders representing the majority of the overall votes relating to the shares issued by the Company, and approve resolutions with the favorable vote of at least two thirds of the overall votes relating to the shares held by the shareholders attending the meeting.
In second call, the extraordinary shareholders meeting is duly held with the presence of shareholders representing more than one third of the overall number of votes relating to the shares issued by the Company and approve resolutions upon with the favorable vote of at least two thirds of the overall votes relating to the shares held by the shareholders attending the meeting.
In subsequent calls, the extraordinary shareholders meeting is duly held with the presence of shareholders representing more than one fifth of the overall number of votes relating to the shares issued by the Company and approve resolutions with the favorable vote of at least two thirds of the overall votes relating to the shares held by the shareholders attending the meeting.
In a single call, the extraordinary shareholders meeting is duly held with the presence of shareholders representing one fifth of the overall number of votes relating to the shares issued by the Company and approve resolutions with the favorable vote of at least two thirds of the overall votes relating to the shares held by the shareholders attending the meeting.
The following table summarizes the majorities (quorum) required to (a) validly hold the ordinary shareholders meeting and (b) approve resolutions.
Extraordinary shareholders meeting | ||||
Quorum necessary to validly hold the meeting |
Quorum to approve resolutions | |||
First call | 50%+1 of the overall votes relating to the shares issued by the Company | Two thirds of the overall votes relating to the shares held by the shareholders who attend the meeting | ||
Second call | More than one third of the overall votes relating to the shares issued by the Company | Two thirds of the overall votes relating to the shares held by the shareholders who attend the meeting | ||
Subsequent calls | One fifth of the overall votes relating to the shares issued by the Company | Two thirds of the overall votes relating to the shares held by the shareholders who attend the meeting | ||
Single call | One fifth of the overall votes relating to the shares issued by the Company | Two thirds of the overall votes relating to the shares held by the shareholders who attend the meeting |
141
Right to Withdraw
Shareholders may exercise the right to withdraw from the Company in accordance with applicable law, with respect to all or part of their shareholding. Rights to withdraw are available to the shareholders who did not vote on or voted against resolutions relating to: (a) the extension of the term of the Company; or (b) the introduction or removal of limitations on share transfers.
For the purposes of the valid exercise of the right of withdrawal, the Beneficial Owners who exercise the right of withdrawal directly or through the Holder of Record, must prove that they were Beneficial Owners at the time of the adoption of the resolution from which the right of withdrawal arises and did not vote in favor of the such resolution.
The liquidation value of the shares is determined by reference to the arithmetic average of the closing prices during the six months preceding the publication of the Notice of Call for the meeting whose resolutions entitle the shareholders to withdraw.
Any agreement aimed at prohibiting or limiting the exercise of the right of withdrawal in the above cases would be null and void.
Corporate Governance of the Company
Pursuant to article 2409-sexiesdecies et seq. of the Italian Civil Code, the Company has adopted, a one-tier system of corporate governance (sistema monistico) according to which the management of the Company is carried out by the board of directors under the supervision of the management control committee (comitato per il controllo sulla gestione) set up within the board of directors.
Board of Directors
The board of directors shall be comprised of a number of members between a minimum of nine and a maximum of 15 members who shall remain in office for a term of no more than three financial years and may be re-elected for further terms. The office of the directors shall terminate on the date of the shareholders meeting convened to approve the financial statements for the third full financial year from their appointment (or such earlier date as may be determined by the shareholders). In addition, applicable law or the articles of association provide further causes of termination of a director`s appointment.
The directors must meet the eligibility and integrity requirements set out in article 2382 of the Italian Civil Code and have the professional qualifications required to perform their duties.
One third of the members of the board of directors, rounded up in case of fractional number, must meet the independence requirements set out in article 2399 of the Italian Civil Code.
The board of directors shall be entrusted with all powers for the ordinary and extraordinary management of the Company, with the authority to carry out all the acts deemed appropriate to achieve the corporate purpose, with the sole exception of those reserved for the shareholders meeting by law or the articles of association.
The board of directors is also responsible, pursuant to articles 2365, paragraph 2, and 2446, paragraph 3, of the Italian Civil Code, without prejudice to the concurrent competence of the extraordinary shareholders meeting, for resolutions concerning: (a) the merger and demerger of the Company in the cases provided for by articles 2505 and 2505-bis of the Italian Civil Code; (b) the transfer of the registered office within the Italian territory; (c) the establishment or closure of secondary offices; (d) the indication of the directors who have authority to represent the Company; (e) the reduction of the share capital in the event of withdrawal of a shareholder; (f) the reduction of the share capital following losses resulting in the Companys own funds to be lower than two thirds of the share capital; and (g) the amendment of the articles of association necessary to reflect the enactment of laws or regulatory provisions or the conversion of the Companys shares.
142
The board of directors shall elect a chairman from among its members, unless the shareholders meeting has already appointed one, and may also appoint one or more deputy chairmen.
The board of directors may also assign the office of Honorary Chairman to a person of recognized standing who has contributed to the growth and development of the Company. The office of Honorary Chairman may be granted to individuals who are not members of the board of directors, has an indefinite duration and can be revoked only for just cause. If he/she is not also a director, the Honorary Chairman may attend the meetings of the board of directors and the shareholders meeting only to express non-binding opinions on the issues to be resolved upon and may represent the Company only on the basis of special powers of attorney. The board of directors determines the remuneration, any other emolument and/or reimbursement of expenses due to the Honorary Chairman.
The board of directors may delegate part of its powers to an executive committee made up of some of its members or to one or more directors, determining their powers in compliance with the limitations set forth by applicable law. To this end, the provisions of article 2381, paragraphs 3, 4 and 5, of the Italian Civil Code shall apply.
The board of directors and, if appointed, the executive committee and the managing directors, within the limits of their powers, may appoint, among the Companys employees, general managers or proxies, as well as, also among third parties, ad negotia or special proxies, determining their powers in compliance with the limitations set forth by applicable law.
The board of directors shall be convened, even outside the registered office, in Italy or abroad, every time the chairman deems it appropriate, or when it is requested by a managing director (if appointed) or by at least one third of its members. The meetings of the board of directors may also be held by audio or videoconference.
Even in the absence of a formal convocation, the board of directors shall be deemed to be duly held if all the directors in office are present.
In order for the resolutions of the board of directors to be valid, the presence of the majority of the directors in office and the favorable vote of the absolute majority of the directors attending are required.
Minutes of the meetings of the board of directors must be drawn up in accordance with applicable law, signed by the chairman of the meeting and by the secretary or notary, and must be copied in the book of meetings and resolutions of the board of directors.
With regard to resolutions concerning transactions in which one or more directors have an interest on their own behalf or on behalf of third parties, article 2391 of the Italian Civil Code shall apply.
Management Control Committee
The management control committee shall be made up of three members, appointed by the board of directors, and its members shall remain in office for three financial years and may be re-elected. The management control committee shall elect a chairman from among its members.
The members of the management control committee shall meet the independence requirements set forth in article 2399 of the Italian Civil Code, and the additional independence requirements set forth in the relevant Italian and foreign laws and regulations applicable to the Company. Any member of the management control committee that is granted powers or holds particular offices for, or performs, even de facto, roles relating to, the management of the Company or of companies controlling it or controlled by it, shall thereupon automatically cease to be a member of the management control committee.
143
At least one member of the management control committee must be chosen among those enrolled in the Italian register of legal auditors, and shall possess the financial expertise required by the Italian and foreign laws and regulations applicable to the Company.
In case of death, resignation, revocation or disqualification of any members of the management control committee, or in case of loss by any members of the management control committee of the relevant independence and professional requirements, the board of directors shall promptly replace him or her by selecting new members among the other directors who meet such requirements .
The management control committee shall be entrusted with: (a) supervising the ongoing viability of the organizational structure of the Company, of the internal control system and of the administrative and accounting system, as well as its suitability to properly represent the management facts; and (b) carrying out such further duties as entrusted to it by the board of directors, with particular regard to liaising with the firm appointed for the legal auditing of the accounts.
The management control committee shall also perform the duties pertaining to the audit committee pursuant to the provisions of U.S. laws and regulations applicable to the Company. The management control committee shall be convened at least every 90 days.
A meeting of the management control committee is duly held with the presence of the majority of its members and resolves by absolute majority of those present at the meeting. Any member who intends to disagree with the adoption of a resolution has the right to have the reasons for his disagreement recorded in the minutes.
The minutes of the meetings of the management control committee must be drawn up and signed by those present, and must be copied in the meeting book of the management control committee.
Election, Removal and Remuneration of Directors.
The board of directors is elected by the ordinary shareholders meeting according to a slate voting system. Directors remain in office for the period established by the shareholders meetings at the time of election, which cannot exceed three financial years, and may be re-elected.
According to the procedure provided for by the articles of association, the right to submit a slate for the election of the members of the board of directors is reserved to shareholders who hold, individually or jointly with other submitting shareholders, shares representing at least five per cent of the overall voting rights pertaining to the shares issued by the Company, it being understood that each shareholder, or group acting in concert, may submit only one slate. The ownership of the number of shares necessary for the presentation of the slate is determined based on the records of the Shareholders Register and the U.S. Register on the date on which the slates are deposited at the registered office, and according to the Record Date.
The slates shall (i) be deposited at the Companys registered office, pursuant to the Notice of Call, at least three days prior to the Record Date, and must be published by the Company in compliance with the applicable legal and regulatory provisions, if any; and (ii) indicate a number of proposed directors between nine and 15, who shall meet the eligibility and integrity requirements provided by applicable law and the articles of association. Each slate must also indicate the candidate directors meeting the independence requirements set out in article 2399 of the Italian Civil Code (at least one third of the candidates), the candidate directors meeting the experience and independence requirements required by our articles of association (at least three candidates) and the candidate directors meeting the additional professional requirements required by the articles of association. Each proposed director shall only stand for election in one slate.
Each slate shall include: (a) the résumés of each of the proposed directors; (b) the statements by means of which each proposed director accepts his/her candidacy and states that he/she possesses the relevant eligibility, integrity, independence, expertise and professional requirements; and (c) the identity of the shareholders or of the Beneficial Ownership who have submitted the lists and of the percentage of voting rights attaching to the shares held by them.
144
Each shareholder can only vote for one slate of proposed directors, and such vote refers to the whole slate and, therefore, all the candidates indicated therein, without the possibility of variations, additions or exclusions.
The number of members of the board of directors shall be the same as the number of candidates indicated in the list that obtained the highest number of votes. The proposed directors indicated in the slate that obtained the highest number of votes shall be elected to the board of directors. If more than one slate has obtained the same number of votes, a second ballot shall be held during the same shareholders meeting; only the slate obtaining the same number of votes shall take part in this second ballot.
In the event that, at the end of the voting, it is ascertained that one or more of the elected directors do not meet the relevant eligibility and integrity requirements, such candidates shall be excluded and, where necessary to ensure the correct composition of the board of directors, replaced in accordance with the following provisions.
In the event that, at the end of the voting, no directors are elected who meet the relevant independence, professional and expertise requirements, a number of candidate starting from the bottom of the slate must be excluded as is necessary to vacate the number of seats that are reserved to candidates who meet such requirements, to be appointed in accordance with the following provisions.
In the event that (a) no slate are submitted by the shareholders, (b) only one slate is submitted and this slate does not obtain the required majority of votes, (c) the number of elected directors is lower than nine, (d) only a number of directors, not the whole board, are to be appointed, or (e) it is not otherwise possible for any reason to appoint the board of directors following the above described procedure, the directors shall be appointed by the shareholders meeting without applying the slate voting mechanism, without prejudice to the obligation to ensure the correct composition of the board of directors and of the management control committee as required by law and the articles of association.
In the event that one or more directors cease to hold office during their term of office, the board of directors shall replace them with directors who meet the eligibility and integrity requirements and, where necessary to ensure the regular composition of the board of directors and of the management control committee, the independence, professional and expertise requirements provided by applicable law and the articles of association. To this end, the provisions of article 2386, paragraphs 1, 2 and 3, of the Italian Civil Code shall apply, without prejudice to the provisions of article 2409-octiesdecies, paragraph 4, of the Italian Civil Code and the provisions of the articles of association concerning the replacement of members of the management control committee.
If, following a directors loss of the independence requirements and/or the independence and professional requirements set out in the articles of association, the board of directors and/or the management control committee are no longer compliant with the articles of associations provisions, the director who no longer meets the aforementioned requirements must cease to be a director and be replaced.
The shareholders meeting establishes the compensation of the directors for their office as members of the board of directors, at the time of their appointment. The directors shall also be entitled to reimbursement of expenses incurred in the performance of their duties.
The shareholders meeting may also determine an aggregate amount for the compensation of all directors, including those holding specific functions, to be allocated by the board of directors.
The board of directors may provide for additional compensation for the directors entrusted with specific functions, which may consist of a fixed part and a variable part, correlated to the achievement of certain objectives, or consist of the right to subscribe for ordinary shares or other financial instruments of the Company at a predetermined price.
145
Furthermore, the shareholders meeting shall establish the fixed compensation of the chairman and the members of the control management committee for their entire term of office, at the time of their appointment. If the shareholders meeting does not do so, the compensation of the chairman and the members of the control management committee shall be established by the board of directors.
Liquidation.
The Company shall be wound up in the cases provided for by the Italian law.
In any case of winding-up of the Company, the extraordinary shareholders meeting shall determine the manner of liquidation and appoint one or more liquidators, determining their powers and remuneration, pursuant to article 2487 of the Italian Civil Code.
Shareholders agreements.
The shareholders agreements must be communicated to the Company and declared before each shareholders meeting. In case of failure to comply with these requirements, the voting rights attaching to the relevant shares cannot be exercised and any resolutions approved due to the favorable vote of such shares can be voided.
Material Differences in Italian law and our Articles of Association and Delaware Law
The provisions of the Italian Civil Code applicable to companies that are listed on a regulated market (società che fanno ricorso al mercato del capitale di rischio) differ from laws applicable to U.S. corporations and their shareholders. Set forth below is a summary of certain differences between the provisions of the Italian Civil Code applicable to companies that are listed on a regulated market (società che fanno ricorso al mercato del capitale di rischio) and the General Corporation Law of the State of Delaware relating to shareholders rights and protections. This summary is not intended to be a complete discussion of the respective rights and it is qualified in its entirety by reference to the laws of the Republic of Italy and of the State of Delaware.
Items |
Republic of Italy |
State of Delaware | ||
Number of Directors | Under Italian law, the board of directors is appointed by the ordinary shareholders meeting of the corporation, for the period established at the time of appointment, which cannot exceed three financial years.
The number of directors is determined by the articles of association or, if only a minimum and a maximum number of directors is provided, by the shareholders meeting.
For corporations adopting the one-tier board system, the board of directors appoints among its members the audit committee which is composed of at least 3 directors.
The board of directors appoints the chairman among its members, if not appointed by the shareholders meeting.
A director may be reappointed for successive terms. |
Under Delaware law, a corporation must have at least one director and the number of directors shall be fixed by or in the manner provided in the By-Laws unless the certificate of incorporation fixes the number of directors, in which case a change in the number shall be made only by amendment of the certificate of incorporation. |
146
Items |
Republic of Italy |
State of Delaware | ||
Removal of Directors | Under Italian law, directors may be removed from office at any time by the shareholders meeting. A director that is removed without cause may have a claim for damages against the corporation.
Directors may resign at any time by written notice to the board of directors and to the chairman of the audit committee. |
Under Delaware law, any director or the entire board of directors may be removed, with or without cause, by the holders of a majority of the shares entitled to vote at an election of directors, except (i) unless the certificate of incorporation provides otherwise, in the case of a corporation whose board of directors is classified, shareholders may effect such removal only for cause, or (ii) in the case of a corporation having cumulative voting, if less than the entire board of directors is to be removed, no director may be removed without cause if the votes cast against his removal would be sufficient to elect him if then cumulatively voted at an election of the entire board of directors, or, if there are classes of directors, at an election of the class of directors of which he/she is a part. | ||
Vacancies on the Board of Directors | Under Italian law, vacancies arising from resignation, removal, death, or loss of the required legal capabilities or independence requirements of directors shall be filled by a resolution of the board of directors, with the approval of the audit committee. The newly appointed directors shall serve until the next ordinary shareholders meeting, by which they may be confirmed or substituted. In case of resignation, removal, death, or loss of the required legal capabilities or of the independence requirements of/by more than half of the directors originally appointed by the shareholders meeting, the remaining directors must call an ordinary shareholders meeting promptly to appoint as many directors as necessary to fill the vacancies and until such vacancies are so filled the resigning directors, if any, remain temporarily in office (in prorogatio). | Under Delaware law, vacancies and newly created directorships may be filled by a majority of the directors then in office (even though less than a quorum) or by a sole remaining director unless (i) otherwise provided in the certificate of incorporation or By-laws of the corporation or (ii) the certificate of incorporation directs that a particular class of stock is to elect such director, in which case a majority of the other directors elected by such class, or a sole remaining director elected by such class, will fill such vacancy. | ||
Annual General Meeting | Under Italian law, shareholders meetings can be either ordinary or extraordinary.
The ordinary shareholders meeting of corporations adopting the one-tier board system, inter alia, |
Under Delaware law, the annual meeting of stockholders shall be held at such place, on such date and at such time as may be designated from time to time by the board of directors or as provided in |
147
Items |
Republic of Italy |
State of Delaware | ||
approves the corporations financial statements;
appoints and removes the directors;
appoints external auditors;
determines the basic compensation of directors and of external auditors;
resolves on the initiation of a liability action against the companys directors
resolves on the authorizations, if any, required by the articles of association for carrying out certain transactions.
Ordinary shareholders meeting must be convened at least once a year within the term established by the articles of association and in any case not later than 120 days after the end of the financial year.
Such term may be extended to up to 180 days after the end of the financial year, if the corporation is bound by law to draw up consolidated financial statements or if particular circumstances concerning its structure or its purposes so require. |
the certificate of incorporation or by the By-Laws. | |||
Special Meeting | Under Italian law the special shareholders meeting (also referred to as extraordinary meeting), inter alia, (i) resolves on amendments to the articles of association; (ii) appoints, replaces and sets forth the powers of liquidators; and (iii) resolves on any other matter assigned to it by law. | Under Delaware law, special meetings of the stockholders may be called by the board of directors or by such person or persons as may be authorized by the certificate of incorporation or by the By-Laws. | ||
Location of the General Meeting | Shareholders meetings may be held in the municipality where the corporation has its registered office or in the locations determined by the board of directors in compliance with the provisions of the articles of association. If so permitted by the articles of association shareholders meeting may be also held via teleconference. | Shareholder meetings may be held within or outside the State of Delaware and may be held virtually if so permitted in accordance with the certificate of incorporation or the By-Laws. | ||
Action by Written Consent | Actions required under Italian law to be taken by a meeting of shareholders may not be taken by the shareholders without a meeting. |
Any action required to be taken by a meeting of shareholders may be taken without a meeting if a consent for such action is in writing and is signed by shareholders having not less than the minimum number of votes that would be necessary to authorize or take such action at a meeting at which all shares entitled to vote thereon were present and voted. |
148
Items |
Republic of Italy |
State of Delaware | ||
Notice of General Meeting | Under Italian law, a shareholders meeting is convened by the board of directors by means of a written notice containing the date, time and place of the meeting and a list of the items on the agenda.
The notice must be published in the Official Gazette of the Italian Republic or in at least one daily newspaper indicated in the articles of incorporation at least 15 days before the date set for the meeting. The articles of association may also provide for additional requirements, such as the publication of the notice on the website of the corporation.
Unless otherwise provided by the articles of association, the notice of a shareholders meeting may specify two or more meeting dates for an ordinary or extraordinary shareholders meeting. |
Under Delaware law, unless otherwise provided in the certificate of incorporation or By-Laws, written notice of any meeting of the stockholders must be given to each stockholder entitled to vote at the meeting not less than 10 and no more than 60 days before the date of the meeting and shall specify the place, date, hour, and purpose or purposes of the meeting. | ||
Quorum | Unless otherwise provided for by the articles of association, ordinary shareholders meetings are validly held, in a single call, irrespective of the percentage of the voting share capital present at the meeting and resolutions are validly passed with the majority (i.e., 50%+1) of the voting share capital present at the meeting.
The Companys articles of association may provide that ordinary shareholders meetings are held in multiple calls. In such case, unless higher majorities are provided for by the articles of association with regard to certain resolutions, (i) on first call, ordinary shareholders meetings are validly held if the majority of the voting share capital is present at the meeting and resolutions are validly passed with the majority (i.e., 50%+1) of the voting share capital present at the meeting, and (ii) on second call, and in any subsequent calls, are validly held irrespective of the percentage of the voting share capital present at the meeting and resolutions are validly passed with the majority (i.e., 50%+1) of the voting share capital present at the meeting. |
The certificate of incorporation or By-Laws may specify the number of shares, the holders of which shall be present or represented by proxy at any meeting in order to constitute a quorum, but in no event shall a quorum consist of less than one third of the shares entitled to vote at the meeting. In the absence of such specification in the certificate of incorporation or By-Laws, a majority of the shares entitled to vote, present in person or represented by proxy, shall constitute a quorum at a meeting of stockholders. |
149
Items |
Republic of Italy |
State of Delaware | ||
Unless otherwise provided by the companys articles of association, extraordinary shareholders meetings are validly held, in a single call, if shareholders representing at least one fifth of the voting share capital is present at the meeting and resolutions are validly passed with the favorable vote of at least two thirds of the voting share capital present at the meeting.
The articles of association may provide that extraordinary shareholders meetings are held in multiple calls. In such case, unless higher majorities are provided by the articles of association, (i) on first call, extraordinary shareholders meetings are validly held if the majority (i.e., 50%+1) of the voting share capital is present at the meeting and resolutions are validly passed with the favorable vote of at least two thirds of the voting share capital present at the meeting; (ii) on second call, extraordinary shareholders meetings are validly held if more than one third of the voting share capital is present at the meeting and resolutions are validly passed with the favorable vote of at least two thirds of the voting share capital present at the meeting, (iii) in subsequent calls, extraordinary shareholders meetings are validly held if shareholders representing at least one fifth of the voting share capital is present at the meeting and resolutions are validly passed with the favorable vote of at least two thirds of the voting share capital present at the meeting. |
||||
Proxy | A shareholder may designate another person to attend, speak and vote at the shareholders meetings of the corporation on such shareholders behalf by way of a written proxy. By means of each proxy, a shareholder may confer to the relevant attorneys the power to attend, speak and vote to a single shareholders meeting. The proxy must include the names of the attorneys and of the substitutes, if any. A shareholder may not appoint as proxy- | Under Delaware law, at any meeting of stockholders, a stockholder may designate another person to act for such stockholder by proxy, but no such proxy shall be voted or acted upon after three years from its date, unless the proxy provides for a longer period. A director of a Delaware corporation may not issue a proxy representing the directors voting rights as a director. |
150
Items |
Republic of Italy |
State of Delaware | ||
holder directors or employees of the corporation or of companies controlled by the latter.
A single proxy-holder may not hold power of attorney for a maximum number of shareholders comprised between 20 and 200, depending on the amount of the companys corporate capital.
A director may not issue a proxy to confer to another person his/her voting rights as a director. |
||||
Preemptive Rights | Pursuant to Italian law, shareholders are entitled to subscribe for newly issued shares in proportion to their respective shareholdings.
Subject to certain conditions, such pre-emptive rights may be waived or limited by the articles of associations (up to 10 percent of the existing corporate capital) or by a resolution of the extraordinary shareholders meeting.
In such event, the proposal concerning the issuance of new shares must be justified by the board of directors and the relevant subscription price must be determined based on the value of the consolidated net worth of the corporation. External auditors of the corporation must issue an opinion on the fairness of the newly issued shares subscription price.
Pre-emptive rights may also be limited with respect to newly issued shares when these are offered for subscription by employees of the corporation or its subsidiaries or parent companies. |
Under Delaware law, shareholders have no preemptive rights to subscribe to additional issues of stock or to any security convertible into such stock unless, and except to the extent that, such rights are expressly provided for in the certificate of incorporation. | ||
Authority to allot | The extraordinary shareholders meeting may increase the share capital and issue new shares (i) to be subscribed by the current shareholders or third parties for a consideration or (ii) by allotting the newly issued shares to the current shareholders for no consideration, provided, in such latter case, that there are sufficient available reserves to cover such newly issued shares, the share capital is covered by the existing own funds of the corporation. | Under Delaware law, if the corporations charter or certificate of incorporation so provides, the board of directors has the power to authorize the issuance of stock. It may authorize capital stock to be issued for consideration consisting of cash, any tangible or intangible property or any benefit to the corporation or any combination thereof. It may determine the amount of such consideration by approving a formula. In the absence of actual fraud in the transaction, the |
151
Items |
Republic of Italy |
State of Delaware | ||
The extraordinary shareholders meeting may delegate the power to increase the share capital of the corporation and/or issue new shares to the board of directors up to a specified amount and for a maximum period of 5 years since the date of such delegation.
In case new shares are issued for cash consideration, the relevant resolution may be executed upon subscription of the new shares and payment of at least 25 per cent of their nominal value and the entire share premium by the subscribers. |
judgment of the directors as to the value of such consideration is conclusive. | |||
Liability of Directors and Officers | Directors of the corporation may be held liable towards the corporation, the creditors of the corporation or single shareholders or creditors for any damage caused to them in consequence of a breach of the directors general or specific duties and obligations.
Any provision, whether contained in the corporations articles of association or any contract or otherwise, that purports to exempt directors in connection with breach of duty in relation to the corporation may not be enforceable.
Apart from insolvency or special circumstances, a judicial action for damages may be brought against the directors only by the corporation (upon resolution of an ordinary shareholders meeting), one or more shareholders owning at least 2.5 per cent of the share capital, or by single shareholders or creditors (only in case of damages directly suffered by the latter), as the case may be.
The corporation may waive or settle actual or potential claims against directors, provided that one or more shareholders owning at least 5 per cent of the share capital do not object to the waiver or settlement. |
Under Delaware law, a corporations certificate of incorporation may include a provision eliminating or limiting the personal liability of a director to the corporation and its stockholders for damages arising from a breach of fiduciary duty as a director. However, no provision can limit the liability of a director for:
any breach of the directors duty of loyalty to the corporation or its stockholders;
acts or omissions not in good faith or that involve intentional misconduct or a knowing violation of law;
intentional or negligent payment of unlawful dividends or stock purchases or redemptions; or
any transaction from which the director derives an improper personal benefit. | ||
Voting Rights | Generally, each shareholder is entitled to one vote for each share held by such shareholder at all shareholders meetings of the corporation. | Delaware law provides that, unless otherwise provided in the certificate of incorporation, each stockholder is entitled to one vote for each share of capital stock held by such stockholder. |
152
Items |
Republic of Italy |
State of Delaware | ||
The articles of association may provide that certain share classes carry no, limited, contingent or multiple (up to 3 votes per share) voting rights. |
||||
Shareholder Vote on Certain Transactions | Resolutions approving any merger or demerger of the corporation require the approval of the board of directors and the approval of the extraordinary shareholders meeting of the corporation (please refer to paragraph Quorum above for further details).
The articles of association may provide for other transactions to be subject to the authorization of the ordinary shareholders meeting of the corporation. In such event, unless otherwise provided by the articles of association, the relevant transaction must be approved with the favorable vote of the ordinary shareholders meeting (please refer to paragraph Quorum above for further details). |
Generally, under Delaware law, unless the certificate of incorporation provides for the vote of a larger portion of the stock, completion of a merger, consolidation, sale, lease or exchange of all or substantially all of a corporations assets or dissolution requires:
the approval of the board of directors; and
approval by the vote of the holders of a majority of the outstanding stock or, if the certificate of incorporation provides for more or less than one vote per share, a majority of the votes of the outstanding stock of a corporation entitled to vote on the matter. | ||
Standard of Conduct for Directors | Directors have a general duty to act with care, without self-interest and on a well- informed basis.
The applicable standard of conduct is determined, on a case-by-case basis, taking into account the characteristics of the corporation, the specific tasks and responsibilities conferred to the single directors, and the personal skills of the latter.
In addition, directors have numerous specific duties and obligations, such as, inter alia:
keeping the corporations books, records and other databases (including the shareholders register) in such a manner that the corporations rights and obligations may be ascertained from the interested parties at all times;
preparing the corporations annual financial statements according with the applicable accounting principles and filing them with the Companies Register on time; |
Delaware law does not contain specific provisions setting forth the standard of conduct of a director. The scope of the fiduciary duties of directors is generally determined by the courts of the State of Delaware. In general, directors have a duty to act without self-interest, on a well- informed basis and in a manner they reasonably believe to be in the best interest of the stockholders.
Directors of a Delaware corporation owe fiduciary duties of care and loyalty to the corporation and to its shareholders. The duty of care generally requires that a director act in good faith, with the care that an ordinarily prudent person would exercise under similar circumstances. Under this duty, a director must inform himself of all material information reasonably available regarding a significant transaction. The duty of loyalty requires that a director act in a manner he/ she reasonably believes to be in the best interests of the corporation. He/she must not use his corporate position for personal gain or advantage. In general, but subject |
153
Items |
Republic of Italy |
State of Delaware | ||
registering the corporation with the Companies Register and keeping the registered information up to date;
convening annually or when necessary or required by one or more shareholders holding at least 5 per cent of the corporate capital, the ordinary shareholders meetings; and
monitoring the own funds and financial position of the corporation and initiate the actions or procedures contemplated by the law in case of (i) losses entailing the reduction of the share capital of the corporation below the threshold of two thirds of the share capital or (ii) income, asset or financial unbalances having certain characteristics. |
to certain exceptions, actions of a director are presumed to have been made on an informed basis, in good faith and in the honest belief that the action taken was in the best interests of the corporation. However, this presumption may be rebutted by evidence of a breach of one of the fiduciary duties. Delaware courts have also imposed a heightened standard of conduct upon directors of a Delaware corporation who take any action designed to defeat a threatened change in control of the corporation.
In addition, under Delaware law, when the board of directors of a Delaware corporation approves the sale or break-up of a corporation, the board of directors may, in certain circumstances, have a duty to obtain the highest value reasonably available to the shareholders. | |||
Indemnification of Directors and Officers | Corporations may enter into indemnity agreements (patti di manleva) with directors, according to which the latter are kept harmless from the liabilities arising from the acts they carried out during their office.
Further, when directors resign from their office, corporations may issue indemnification letters in their favor. |
A corporation may indemnify a director or officer of the corporation against expenses (including attorneys fees), judgments, fines and amounts paid in settlement actually and reasonably incurred in defense of an action, suit or proceeding by reason of such position if (i) such director or officer acted in good faith and in a manner he reasonably believed to be in or not opposed to the best interests of the corporation and (ii) with respect to any criminal action or proceeding, such director or officer had no reasonable cause to believe his conduct was unlawful. | ||
Shareholder Litigation | Under Italian law, liability actions against directors may be brought by the corporation following a resolution of the ordinary shareholders meeting.
The statute of limitation for this action is equal to five years from the termination of the relevant directors appointment.
The approval of the liability action by the shareholders meeting implies the removal from office of the director against whom it |
Under Delaware law, a stockholder may initiate a derivative action to enforce a right of a corporation if the corporation fails to enforce the right itself. The complaint must:
state that the plaintiff was a stockholder at the time of the transaction of which the plaintiff complains or that the plaintiffs shares thereafter devolved on the plaintiff by operation of law; and |
154
Items |
Republic of Italy |
State of Delaware | ||
is proposedif the latter is still in officeprovided that it is taken with the favorable vote of at least 20 per cent of the share capital.
The corporation may waive the exercise of the liability action and may settle, provided that the waiver and the settlement are approved by a resolution of the ordinary shareholders meeting, and provided that there is no vote against by a minority of shareholders representing at least 5 per cent of the share capital.
Liability actions may also be brought by shareholders holding at least 2.5 per cent of the share capital or the lower amount set forth in the corporations articles of association.
The shareholders who have acted may waive or settle the action; any consideration for the waiver or settlement shall inure to the benefit of the corporation. |
allege with particularity the efforts made by the plaintiff to obtain the action the plaintiff desires from the directors and the reasons for the plaintiffs failure to obtain the action; or
state the reasons for not making the effort.
Additionally, the plaintiff must remain a stockholder through the duration of the derivative suit. The action will not be dismissed or compromised without the approval of the Delaware Court of Chancery. | |||
Amendment of the certificate of incorporation | Certificate of incorporation is not a separate document from the articles of association and, as such, is not separately amended. | Under Delaware law, generally a corporation may amend its certificate of incorporation if:
its board of directors has adopted a resolution setting forth the amendment proposed and declared its advisability; and
the amendment is adopted by the affirmative votes of a majority (or greater percentage as may be specified by the corporation) of the outstanding shares entitled to vote on the amendment and a majority (or greater percentage as may be specified by the corporation) of the outstanding shares of each class or series of stock, if any, entitled to vote on the amendment as a class or series. |
155
Items |
Republic of Italy |
State of Delaware | ||
Amendment of By-Laws /Article of Association | Under Italian law, the extraordinary shareholders meeting must resolve upon any amendments to the corporations articles of association, which amendments must also be filed with the Companies Register. The articles of association may provide for the board of directors power to carry out other amendments to the corporations articles of association, as to, inter alia, resolutions regarding the setting-up or closure of the corporations branch office, simplified mergers (e.g., a merger in which the merging corporation owns all or at least 90% of the share capital of the merged corporation), the indication of whom among the directors has the power to represent the corporation.
Upon each of the amendments to the corporations articles of association, the up-to-date version must be filed with the Companies Register. |
Under Delaware law, the stockholders entitled to vote have the power to adopt, amend or repeal By-Laws. A corporation may also confer, in its certificate of incorporation, that power upon the board of directors. | ||
Transactions with Significant Shareholders | Relevant rules are not applicable under Italian law for companies whose shares are not listed on a regulated market in the EU. | Subject to certain exceptions and conditions, a corporation may not enter into a business combination with an interested shareholder for a period of three years from the time the person became an interested shareholder without prior approval from shareholders holding at least 66 2/3% of the corporations outstanding voting stock which is not owned by such interested shareholder. | ||
Dissenters Rights of Appraisal | Mergers and demergers plans to be approved by the board of directors must be based on a fair shares exchange ratio, to be certified by independent experts, appointed by the court. Such experts must draw up a report on the fairness of the exchange ratio of the shares, stating: a) the method or methods followed in determining the proposed exchange ratio and the values resulting from the application of each such method or methods; b) any valuation difficulties; and c) an opinion on the appropriateness of the methods followed to determine the exchange ratio and the relevant importance attributed to each in determining the value adopted. | Appraisal rights shall be available for the shares of any class or series of stock of a corporation in a merger or consolidation, subject to limited exceptions, such as a merger or consolidation of corporations listed on a national securities exchange in which listed stock is the offered consideration. |
156
SHARES ELIGIBLE FOR FUTURE SALE
Upon completion of this offering, we will have 294,827,240 shares outstanding, assuming the underwriters do not exercise their over-allotment option to purchase additional ordinary shares from us. All of the ordinary shares sold in this offering will be freely transferable by persons other than by our affiliates without restriction or further registration under the Securities Act. Furthermore, because only a limited number of ordinary shares will be available for sale shortly after this offering due to existing contractual and legal restrictions on resale as described below, there may be sales of substantial amounts of our ordinary shares in the public market after such restrictions lapse. Sales of substantial amounts of our Shares in the public market could adversely affect prevailing market prices of our Shares and our ability to raise equity capital in the future. Prior to this offering, there has been no public market in the United States for our Shares. The Shares have been approved for listing on the NYSE, but we cannot assure you that a regular trading market will develop for the Shares.
Rule 144
All of our shares that will be outstanding upon the completion of this offering, other than those ordinary shares sold in this offering, are restricted securities as that term is defined in Rule 144 under the Securities Act and may be sold publicly in the United States only if they are subject to an effective registration statement under the Securities Act or pursuant to an exemption from the registration requirement such as those provided by Rule 144 and Rule 701 promulgated under the Securities Act. In general, beginning 90 days after the date of this prospectus, a person (or persons whose shares are aggregated) who at the time of a sale is not, and has not been during the three months preceding the sale, an affiliate of ours and has beneficially owned our restricted securities for at least six months will be entitled to sell the restricted securities without registration under the Securities Act, subject only to the availability of current public information about us, and will be entitled to sell restricted securities beneficially owned for at least one year without restriction. Persons who are our affiliates and have beneficially owned our restricted securities for at least six months may sell a number of restricted securities within any three-month period that does not exceed the greater of the following:
| 1% of the then outstanding ordinary shares of the same class, in the form of shares or otherwise, which immediately after this offering will equal 330,847 ordinary shares, assuming the underwriters do not exercise their over-allotment option; or |
| the average weekly trading volume of our ordinary shares of the same class during the four calendar weeks preceding the date on which notice of the sale is filed with the SEC on Form 144 with respect to the sale. |
provided, in each case, that we are subject to the Exchange Act periodic reporting requirements for at least three-months before the sale. Sales both by our affiliates and by non-affiliates under Rule 144 are also subject to certain requirements relating to manner of sale, notice and the availability of current public information about us.
Rule 701
In general, under Rule 701 of the Securities Act as currently in effect, each of our employees, consultants or advisors who purchases our ordinary shares from us in connection with a compensatory stock plan or other written agreement executed prior to the completion of this offering is eligible to resell those ordinary shares 90 days after the effective date of this offering in reliance on Rule 701, without having to comply with the holding period requirements or other restrictions contained in Rule 144. The SEC has indicated that Rule 701 will apply to typical share options granted by an issuer before it becomes subject to the reporting requirements of the Exchange Act, along with the shares acquired upon exercise of such options, including exercises after the date of this prospectus. Securities issued in reliance on Rule 701 are restricted securities and, subject to the contractual restrictions described below, beginning 90 days after the date of this prospectus, may be sold by persons other than affiliates, as defined in Rule 144, subject only to the manner of sale provisions of Rule 144 and by affiliates under Rule 144 without compliance with its one-year minimum holding period requirement.
157
Lock-up Agreements
We, all of our shareholders as of the date of this registration statement, including the Selling Shareholder, our directors and executive officers have agreed, subject to limited exceptions, not to offer, pledge, sell, contract to sell, sell any option or contract to purchase, purchase any option or contract to sell, grant any option, right or warrant to purchase, lend, or otherwise transfer or dispose of, directly or indirectly, or enter into any swap or other agreement that transfers, in whole or in part, any of the economic consequences of ownership of our shares (whether any such transaction is to be settled by delivery of shares or such other securities, in cash or otherwise) for a period of 180 days after the date of this prospectus, subject to limited exceptions, without the prior written consent of the underwriters.
Registration Rights Agreement
Upon completion of this offering, we and certain of our existing shareholders will enter into the Registration Rights Agreement. The Registration Rights Agreement will provide such shareholders certain registration rights relating to our ordinary shares held by them, subject to customary restrictions and exceptions. Registration of such registrable securities would result in registration of ordinary shares under the Securities Act and would result in these shares becoming freely tradable without restriction under the Securities Act immediately upon the effectiveness of the registration, except for shares purchased by affiliates.
Regulation S
Regulation S provides generally that sales made in offshore transactions are not subject to the registration or prospectus-delivery requirements of the Securities Act.
158
The following summary of Italian and U.S. federal income tax considerations of an investment in our ordinary shares is based upon laws and relevant interpretations thereof in effect as of the date of this registration statement, all of which are subject to change. This summary does not deal with all possible tax considerations relating to an investment in our ordinary shares, such as the tax considerations under U.S. state and local tax laws or under the tax laws of jurisdictions other than Italy and the United States.
Italian Taxation
This section describes solely the material Italian tax consequences of acquiring, holding and disposing of the Shares. It does not consider every aspect of Italian taxation that may be relevant to a particular holder of Shares in special circumstances or who is subject to special treatment under applicable law, and it is not intended to be applicable in all respects to all classes of investors.
Shareholders and any potential prospective investors should consult their own tax advisors regarding the Italian tax consequences of acquiring, holding and disposing of Shares in their particular circumstances and should investigate the nature and the origin of the amounts received as distributions in connection with the Shares (dividends or reserves).
Where in this section English terms and expressions are used to refer to Italian concepts, the meaning to be given to these terms and expressions shall be the meaning to be given to the equivalent Italian concepts under Italian tax law. This summary assumes that Shares will be listed on a regulated market as defined under the interpretation of the Italian tax authorities. This summary also assumes that Stevanato is organized, and that the business will be conducted, in the manner outlined in this prospectus. A change to the organizational structure or to the manner in which Stevanato conducts its business may invalidate the contents of this section, which will not be updated to reflect any such change.
This summary is based on the tax laws of the Republic of Italy and published case law / practice (unpublished case law / practice is not included) as it stands at the date of this prospectus. The law upon which this description is based is subject to change, potentially with retroactive effect. Any such change may invalidate the contents of this description, which will not be updated to reflect this change.
Definitions
For purposes of this section of this offering circular, the terms defined have the meaning described below.
References to CITA are to Presidential Decree No. 917 of December 22, 1986 (the Consolidated Income Tax Act).
References to Italian White List are to the list of countries and territories allowing a satisfactory exchange of information with Italy (i) currently included in the Italian Ministerial Decree of September 4, 1996, as subsequently amended and supplemented or (ii) once effective in any other decree or regulation that will be issued in the future to provide the list of such countries and territories (and that will replace Ministerial Decree of September 4, 1996), including any country or territory that will be deemed listed therein for the purpose of any interim rule.
References to Non-Qualified Shareholdings are to shareholdings in companies listed on regulated markets other than Qualified Shareholdings;
References to Qualified Shareholdings are to shareholdings in companies listed on regulated markets represented by the ownership of shares (other than savings shares), rights or securities through which shares may be acquired which represent overall voting rights exercisable at ordinary shareholders meetings of over 2 percent or an interest in the share capital of over 5 percent;
159
References to Transfer of Non-Qualified Shareholdings are to transfers of shares (other than savings shares), rights or securities through which shares can be acquired, different from the Transfer of Qualified Shareholdings; and
References to Transfer of Qualified Shareholdings are to transfers of shares (other than savings shares), rights or securities through which shares can be acquired, which exceed, over a period of twelve months, the threshold for their qualification as Qualified Shareholdings. The 12-month period starts from the date on which the securities and the rights owned represent a percentage of voting rights or interest in the capital exceeding the aforesaid threshold. For rights or securities through which holdings can be acquired, it is considered the percentage of voting rights or interest in the capital potentially attributable to the holdings.
Tax Regime for Dividends
Dividends allocated to the Shares will be subject to the tax treatment ordinarily applicable to dividends paid by joint stock companies resident in Italy for tax purposes.
The following different methods of taxation are provided for the different classes of recipients.
(i) Italian resident individuals
Dividends received by individual shareholders who are resident in Italy for income tax purposes in connection with a Non-Qualified Shareholding, not holding the participation in connection with a business activity, are subject to a final withholding tax (WHT) at the rate of 26 percent pursuant to the article 27 of Presidential Decree No. 600 of September 29, 1973 (hereinafter Decree 600/73)which will be withheld by Stevanato upon payment of the dividendand do not have to be reported in the shareholders annual income tax return.
Dividends paid to individual shareholders who have entrusted the management of their financial assets, including the Shares, to an authorized intermediary and have expressly elected for the discretionary investment portfolio regime (Regime del Risparmio Gestito, set forth by article 7 of Legislative Decree No. 461 of November 21, 1997 (Decree 461/97), as illustrated below) are not subject to WHT, and are included in the computation of the accrued annual increase in value of the managed assets, subject to an ad hoc 26 percent substitute tax withheld by the authorized intermediary pursuant to article 7(4) of Legislative Decree No. 461 of November 21, 1997.
Dividends received by resident individual shareholders, holding the Shares in connection with a business activity, are not subject to WHT, if the individual shareholders declare to the payor before the payment of the dividends that the profits collected are from holdings related to the business activity. Such dividends are partially included in the individual shareholders taxable income, subject to personal income tax (IRPEF) for (i) 58.14 percent of their amount as to dividends paid out of profits realized in the tax years following the one in progress on December 31, 2016, (ii) 49.72 percent of their amount as to dividends paid out of profits realized from the tax year following the one in progress on December 31, 2007 up to the one in progress on December 31, 2016 and (iii) 40 percent of their amounts as to dividends paid out of profits realized in the tax years up to that in progress on December 31, 2007. For these purposes (taxation of the recipient), profits realized in the tax years up to the tax year in progress on December 31, 2007, and then profits realized in the tax years up to the tax year in progress on December 31, 2016 are deemed to be distributed with priority. IRPEF is generally levied at progressive rates ranging from 23 percent to 43 percent, plus local surcharges.
Dividends received by resident individual shareholders not engaged in a business activity, in connection with a Qualified Shareholding not held in the context of the discretionary investment portfolio regime, are subject to the same 26 percent WHT applicable in connection with dividends received on Non-Qualified Shareholding and do not have to be reported in the shareholders annual income tax return. However, with
160
respect to dividends paid on a Qualified Shareholding out of profits realized in the tax years up to that in progress on December 31, 2017, the previously applicable regime would continue to apply, provided that the distribution of such profits is approved between January 1, 2018 and December 31, 2022. Hence, such dividends would not be subject to any WHT and would be included in the individual shareholders taxable income according to the rules illustrated above for individual shareholders holding the Shares in connection with a business activity.
(ii) Partnerships (excluding non-commercial partnerships), companies and other commercial entities, which are resident in Italy for tax purposes
Dividends received by partnerships (other than non-commercial partnership) and similar entities as referred to in article 5 of the CITA, as well as to companies or entities as referred to in article 73 (1) sections a) and b) of the CITA, such as joint stock companies, partnerships limited by shares, limited liability companies, public and private entities (other than companies) and trusts whose sole or principal purpose is to carry on a business activity, which are resident in Italy for income tax purposes, are not subject to WHT at source and are included in the recipients overall taxable income.
In particular, dividends received by:
1. | partnerships and similar entities as referred to in article 5 of the TUIR (e.g., società in nome collettivo or società in accomandita semplice) are partially included in the relevant taxable and then proportionally allocated to the relevant partners on a look-through basis. In particular, such dividends are included for (i) 58.14 percent of their amount as to dividends paid out of profits realized in the tax years following the one in progress on December 31, 2016, (ii) 49.72 percent of their amount as to dividends paid out of profits realized from the tax year following the one in progress on December 31, 2007 up to the one in progress on December 31, 2016, and (iii) 40 percent of their amounts as to dividends paid out of profits realized in the tax years up to that in progress on December 31, 2007. For these purposes (taxation of the recipient), profits realized in the tax years up to the tax year in progress on December 31, 2007, and then profits realized in the tax years up to the tax year in progress on December 31, 2016 are deemed to be distributed with priority; |
2. | entities subject to IRES as referred to in article 73(1) sections a) and b) of CITA (e.g., commercial and non-commercial entities such as società per azioni or società in accomandita per azioni), are included in the entities total taxable income for an amount equal to 5 percent of the received dividend amount and subject to the corporate income tax (IRES, currently levied at a rate of 24 percent). However, if the recipient is a company applying the international accounting standards (IAS/IFRS), dividends arising from securities accounted for in the financial statements as held for trading purposes only, would be fully included in the recipients taxable income for IRES purposes. |
For some types of businesses and under certain conditions, the dividends received will also be included for 50 percent of their amounts in the taxable income subject to the Regional Tax on Business Activities (IRAP).
(iii) Italian non-commercial entities
Dividends received by non-commercial entities which are resident in Italy for income tax purposes are not subject to WHT and are included in the recipients overall taxable income for 50 percent of their amount subject to IRES. However, non-commercial entities should account for a non-distributable reserve equal to IRES that would have been paid had the exempt portion of dividend been subject to tax.
(iv) Exempt and excluded entities resident in Italy for tax purposes
Dividends received by Italian residents exempt from IRES are generally subject to WHT at a rate of 26 percent. No Italian tax is levied at source on Italian entities that are excluded from income taxation pursuant to article 74(1) of the CITA.
161
(v) Italian pension funds and OICR (other than real estate investment funds or real estate SICAF)
Dividends received by Italian pension funds established pursuant to article 17 of Legislative Decree No. 252 of December 5, 2005 are not subject to WHT and are included in the annual net accrued results of the pension fund, which is subject to a substitute tax of 20 percent. Subject to certain limitations and requirements (including a minimum holding period), dividends received by certain pension funds, not in connection with a Qualified Shareholding, may be exempt from any taxation if the shares meet the requirements set by to article 1(88-114) of Law No. 132 of December 11, 2016 (Italian Budget Law for 2017).
Dividends received by Italian undertakings for collective investment of saving income (OICR) and Luxembourg based OICR which have already been authorized for sale in Italy, subject to supervision, other than real estate investment funds and by Italian investment companies with variable or fixed capital (SICAV and SICAF), are not subject to WHT. Dividends received by the aforementioned investment funds are not subject to tax at the level of such entities pursuant to article 73(5-quinquies) of the CITA.
They are generally subject to taxation upon the investor at the time of payment or when the units of the aforementioned investment funds are transferred or redeemed.
(vi) Italian real estate investment funds and real estate SICAF
Dividends received by Italian-resident real estate investment funds established pursuant to article 37 of Legislative Decree No. 58 of 1998, and article 14-bis of Law No. 86 of January 25, 1994, and by Italian real estate SICAF are not subject to WHT pursuant to Law Decree No. 351 of September 25, 2001.
In some circumstances, the income realized by an Italian non-institutional real estate investment funds may be attributed to their non-institutional investors (thus being included in their income taxable in Italy) holding an investment of more than 5 percent of the fund assets.
(vii) Non-Italian resident shareholders holding the Shares through a permanent establishment in Italy
No Italian WHT at source is levied on dividends paid to non-resident persons that hold the Shares through a permanent establishment in Italy to which the Shares are effectively connected. Only 5 percent of the dividends are included in the overall income subject to IRES, unless the Shares are booked as shares held for trading by holders applying the international accounting standards (IAS/IFRS). In this case, dividends would be fully included in the recipients taxable income for IRES purposes.
For some types of businesses and under certain conditions, dividends are also included in the net value of production, which is subject to IRAP.
(viii) Non-Italian resident shareholders not holding the Shares through a permanent establishment in Italy
A WHT at a rate of 26 percent is generally levied on dividends paid to non-resident persons that do not have a permanent establishment in Italy to which the Shares are effectively connected.
Subject to a specific application that must be submitted to the Italian tax authorities under the terms and conditions provided by law, non-resident holders are entitled to a tax relief (in the form of a refund), which cannot be greater than 11/26 (eleven twenty-sixths) of the tax levied in Italy, if they can demonstrate that they have paid final tax abroad on the same profits.
As an alternative to the tax relief described above, persons resident in Countries that have a double tax treaty in force with Italy may request that the WHT on dividends be levied at the (reduced) rate provided under the applicable double tax treaty. Under article 10 of the Italy-U.S. double tax treaty (a) treaty entitled U.S.
162
resident shareholders can generally benefit from a reduced WHT rate on dividends equal to 15 percent, (b) treaty entitled U.S. resident companies can benefit, under certain conditions, from a reduced WHT rate on dividends equal to 5 percent, and (c) certain qualified U.S. governmental entities are entitled, under certain conditions, to a full exemption from WHT on dividends.
The domestic WHT rate on dividends is 1.2 percent (and not 26 percent) if the recipients and beneficial owners of the dividends are companies or entities that are (a) resident for tax purposes in an EU Member State or in a State that is party to the European Economic Area Agreement (EEA Member State) and is included in the Italian White List and (b) subject to corporate income tax in such State. These companies and entities are not entitled to the tax relief described above.
The domestic WHT rate on dividends is 11 percent (and not 26 percent) if the recipients and beneficial owners of the dividends are pension funds that are set up in an EU Member States or an EEA Member State included in the Italian White List. These pension funds are not entitled to the tax relief described above.
Moreover, article 1(631-632) of Law No. 178 of December 30, 2020 (2021 Budget Law) has introduced favorable tax regime applicable to certain for undertakings for collective investment (UCIs) established outside of Italy according to which dividends derived from shareholdings in Italian tax resident companies are not subject to taxation in Italy, if realized by: (i) foreign UCIs compliant with Directive 2009/65/EC (UCITS Directive), or (ii) foreign UCIs (not compliant with Directive 2009/65/EC) established in an EU Member State or EEA Member State allowing for an adequate exchange of information for tax purposes and whose manager is subject to regulatory supervision in the Country where it is established pursuant to Directive 2011/61/EU (AIFM Directive).
Under article 27-bis of Decree 600/73, which implemented in Italy Directive 435/90/EEC of July 23, 1990, then recast in EU Directive 2011/96 of November 30, 2011 (the Parent-Subsidiary Directive), a company is entitled to a full refund of the WHT levied on the dividends if it (a) has one of the legal forms provided for in the appendix to the Parent-Subsidiary Directive, (b) is resident for tax purposes in an EU Member State without being considered to be resident outside the EU according to a double tax treaty signed with a non-EU country, (b) is subject in the Country of residence to one of the taxes indicated in the appendix to the Parent-Subsidiary Directive with no possibility of benefiting from optional or exemption regimes that have no territorial or time limitations and (d) directly holds Shares that represent an interest in the issued and outstanding capital of Stevanato of no less than 10 percent for an uninterrupted period of at least one year. If these conditions are met, and as an alternative to submitting a refund request after the dividend distribution, the nonresident company may request that no tax be levied at the time the dividends are paid, provided that (x) the 1-year holding period under condition (d) above has already run and (y) the non-resident company promptly submits proper documentation. EU resident companies that are controlled directly or indirectly by persons that are not resident in a EU Member State may request the refund or the direct withholding exemption only if the EU resident companies prove that they do not hold the Shares for the sole or primary purpose of benefiting from the Parent-Subsidiary Directive.
The application of the above-described tax relief, WHT reduction under the double tax treaties or WHT exemption, is subject to conditions required under the applicable laws and/or treaties, which may vary depending on the case, as well as to the fulfillment by the shareholders of certain formalities, such as the timely provision to the withholding tax agent of affidavits, self-statements and tax residence certificates. In this respect, shareholders should consult with their own independent tax advisors to determine whether they are eligible for, and how to obtain, such tax relief, WHT reductions or exemption.
Distributions of Certain Capital Reserves
Special rules apply to the distribution of certain capital reserves, including reserves or funds created with share offerings premiums, adjusted interest paid by subscribers of shares, capital contributions, capital account payments made by shareholders or tax-exempt monetary revaluation funds. Under certain circumstances, such
163
distribution may trigger taxable income in the hands of the recipients depending on the existence of current profits or outstanding profit reserves of the distributing company at the time of the distribution, and on the actual nature of the reserves so distributed. The application of such rules may also have an impact on the tax basis of the shares and the characterization of the taxable income received by the recipients as well as the tax regime applicable to it. Non-Italian resident shareholders may be subject to tax in Italy as a result of the distribution of such reserves pursuant to the same tax regime applicable to dividends as described at section Tax Regime for Dividends above. Prospective investors should consult their advisers in case any distributions of such capital reserves occur.
Tax Regime for Capital Gains Realized Upon Transfer of Shares
(i) Italian resident individuals not carrying out business activities
Capital gains, other than those realized in connection with the carrying out of a business activity, realized by individuals resident in Italy for tax purposes upon transfer for consideration of shares are subject to the same tax regime whether they are realized upon Transfer of Qualified Shareholdings or Transfer of Non-Qualified Shareholdings.
In particular, such capital gains are subject to substitute tax at a rate of 26 percent. The taxpayer may opt for one of the following three regimes:
a) | Taxation under tax return regime (regime della dichiarazione). Under the tax return regime, which is the standard regime for taxation of capital gains realized by Italian resident individuals not carrying out a business activity, a 26 percent substitute tax on capital gains will be chargeable, on a cumulative basis, on all capital gains, net of any relevant incurred capital loss of the same nature. The mentioned substitute tax must be paid within the deadline for the payment of the balance income tax due on the basis of the tax return. Capital losses in excess of capital gains may be carried forward against capital gains of the same nature realized in the following four years, provided that such capital losses are reported in the tax return of the year when they were realized. The tax return method is mandatory in the event that the taxpayer does not choose one of the two alternative regimes mentioned in (b) and (c) below. |
b) | Non-discretionary investment portfolio (risparmio amministrato) regime (optional). Pursuant to article 6 of Decree 461/97, Italian resident individuals holding Shares otherwise than in connection with business activity may elect to pay 26 percent substitute tax, separately on capital gains realized on each transfer of the Shares. Such separate taxation of capital gains is allowed provided (i) the Shares being deposited with Italian banks, SIMs or certain authorized financial intermediaries; and (ii) an express election by the relevant shareholder for the risparmio amministrato regime being made in writing in due time. Under the risparmio amministrato regime, the financial intermediary is responsible for accounting for the due substitute tax in respect of capital gains realized on each transfer of the Shares (as well as in respect of capital gains realized at revocation of its mandate), net of any relevant incurred capital loss of the same nature. Then the intermediary is required to pay the due amount of tax to the Italian tax authorities on behalf of the taxpayer, by deducting a corresponding amount from proceeds to be credited to the shareholder or using funds provided by the shareholder for this purpose. Under the risparmio amministrato regime, where a transfer of the Shares results in capital loss, such loss may be deducted from capital gains of the same nature subsequently realized within the same relationship of deposit in the same tax year or in the following tax years up to the fourth. Under the risparmio amministrato regime, the shareholder is not required to declare capital gains in its annual tax return. |
c) | Discretionary investment portfolio (risparmio gestito) regime (optional). Pursuant to article 7 of Decree 461/97, any capital gains accrued on Shares held otherwise than in connection with business activity by Italian resident individuals who have entrusted the management of their financial assets, including the Shares, to an authorized intermediary and have elected for the risparmio gestito regime |
164
will be included in the computation of the annual increase in value of the accrued managed assets result, even if not actually received, at year end, which is subject to a 26 percent substitute tax to be applied on behalf of the taxpayer by the managing authorized intermediary. Under the risparmio gestito regime, any depreciation of the managed assets accrued at year end may be carried forward against increase in value of the managed assets accrued in any of the four following tax years. Under the risparmio gestito regime, the shareholder is not required to report capital gains realized in its annual tax return. |
(ii) Italian resident individuals shareholders holding the Shares in connection with a business activity and partnerships and similar entities (excluding non-commercial partnerships)
Capital gains realized by partnerships and similar entities or Italian residents on the sale or disposal of the Shares held in connection with a business activity, are included in the recipients overall taxable income for the entire amount in the tax year in which they are realized, subject to income tax at ordinary rates. However, if the conditions indicated in the following paragraph for the partial exemption provided for capital gains realized by Italian resident companies and commercial entities were satisfied, these capital gains would be subject to tax only partially, in an amount equal to 58.14% (49.72% for commercial partnerships) of the capital gains realized. In this event, the relating capital losses would be deductible for a corresponding amount.
(iii) Italian companies and commercial entities
Capital gains realized by Italian resident commercial companies subject to IRES, private and public entities and trusts whose sole or principal purpose is to carry out a business activity, are included in their taxable income and are subject to IRES according to the ordinary rules. If the Shares were held and accounted for as fixed financial assets in the three-year period preceding the disposal, the shareholder may elect to spread any realized gain on a straight line basis across the five-year period commencing in the tax year in which the gain is realized and the following four pursuant to article 86(4) of the CITA.
However, under article 87 of the CITA (participation exemption regime), capital gains arising from the disposal of the Shares are tax-exempt for 95 percent of such capital gains, whereas the remaining 5% is included in the shareholders taxable income and is subject to IRES, if the following conditions are met:
a) | the shareholding must be held, without interruption, from the first day of the twelfth month preceding the month in which the sale occurs (the most recently purchased shares being deemed to have been sold first); |
b) | the shareholding must be accounted for in the financial statements of the shareholder as a fixed financial asset in the first year of the holding period. To parties who prepare their financial statements in accordance with IAS/IFRS international accounting standards the shares not accounted as held for trading are deemed as fixed financial assets; |
a) | residence for tax purposes of the participated entity in a country other than those with a privileged tax regime in accordance with the criteria set out in article 47-bis(1) of the CITA. This requirement must be met at the time when the capital gain is realized, without interruption, since the beginning of the holding of the shares or, if the shares are held since more than five years and the disposal is made in favour of entities not belonging to the sale group of the seller, from at least the beginning of the fifth tax period preceding the one in which the gain is realized. |
b) | the participated entity carries out a commercial business activity according to the definition set forth in article 55 of the CITA; however, this requirement is not relevant for shareholdings in companies whose securities are traded on regulated markets (as for the Shares). This requirement must be met at the time when the capital gain is realized, without interruption, from at least the beginning of the third tax period preceding the one in which the gain is realized. |
165
If the aforementioned requirements are met, the capital losses made on holdings are not deductible from business income.
Capital losses and negative differences between revenue and costs for shares that do not meet the requirements for participation exemption are not relevant up to the non-taxable amount of dividends, or of accounts thereof, received in the thirty six months prior to their transfer. This provision applies with reference to shares acquired during the 36 month period prior to the realization of capital losses or negative differences, provided that the conditions under (c) and (d) above are met; such a provision does not apply to parties who prepare their financial statements in accordance with IAS/IFRS international accounting standards referred to in Regulation (EC) No. 1606/2002 of the European Parliament and Council of July 19, 2002.
Capital losses in excess of Euro 50,000 must be reported to the Italian tax administration in the tax return.
Moreover, the data and the information relating to capital losses in excess of Euro 5,000,000, deriving from the sales of shares accounted for as fixed financial assets, must be included in the recipients tax return. Such an obligation does not apply to parties who prepare their financial statements in accordance with IAS/IFRS international accounting standards.
Under certain conditions, capital gains on the Shares realized by certain companies and commercial entities are also subject to IRAP, at ordinary rates.
(iv) Non-commercial entities, which are resident in Italy for tax purposes
Capital gains realized on the sale or disposal of the Shares by Italian-resident public or private non-commercial entities and trusts are subject to the tax regime described in connection with capital gains realized by Italian resident individual shareholders otherwise than in connection with a business activity.
(v) Italian pension funds and investment funds
Capital gains realized by Italian resident pension funds established pursuant to article 17 of Legislative Decree No. 252 of December 5, 2005 are subject to the same tax regime described under the paragraph relating to the taxation regime of dividends received by such funds, above. Subject to certain limitations and requirements (including a minimum holding period), capital gains realized by certain pension funds, not in connection with a Qualified Shareholding, may be exempt from any taxation if the shares meet the requirements set by article 1 (88-114) of the Italian Budget Law for 2017.
Capital gains realized by Italian resident Investment Funds, SICAVs and SICAFs are subject to the same tax regime described under the paragraph relating to the taxation regime of dividends received by such entities, above.
(vi) Italian real estate investment funds
Capital gains realized by real estate investment funds and real estate SICAFs are subject to the same tax regime described under the paragraph relating to the taxation regime of dividends received by such entities, above.
(vii) Non Italian residents
Capital gains realized by non-Italian resident shareholders without a permanent establishment in Italy, through which the relevant Shares are held, are subject to the following tax regimes:
a) | Transfer of a Non-Qualified Shareholding relating to shares listed on a regulated market, such as the Shares, is not subject to taxation in Italy pursuant to article 23 of the CITA. In such case, in order to |
166
benefit from this exemption, non-Italian resident holders who hold the Shares with an Italian authorized financial intermediary may be required to file a statement evidencing their residence outside of Italy for tax purposes; |
b) | Transfer of a Qualified Shareholding is subject to the same taxation regime of capital gains realized by resident individual shareholders not engaged in a business activity. Therefore, capital gains realized are subject to substitute tax at the rate of 26 percent (under one of the regimes described above for Italian resident individuals not carrying out business activities). |
The tax regimes described above will not prevent the application, if more favourable to the taxpayer, of any different provisions of any applicable double taxation treaty with Italy. Most double taxation treaties entered into by Italy provide that capital gains realized on the disposal of shares are subject to tax only in the Country of residence of the seller. In such a case, the capital gains realized by non-resident shareholders on the disposal of the Shares will not be subject to tax in Italy. Under article 13(4) of the Italy-U.S. double tax treaty, capital gains realized by treaty entitled U.S. resident shareholders upon disposal of the Shares would be subject to tax only in the U.S..
Article 1(633) of the 2021 Budget Law has introduced favorable tax regime applicable to certain UCIs established outside of Italy according to which capital gains derived from Qualified Shareholdings in Italian tax resident companies are not subject to taxation in Italy, if realized by: (i) foreign UCIs compliant with Directive 2009/65/EC (UCITS Directive), or (ii) foreign UCIs (not compliant with Directive 2009/65/EC) established in an EU Member State or EEA Member State allowing for an adequate exchange of information for tax purposes and whose manager is subject to regulatory supervision in the Country where it is established pursuant to Directive 2011/61/EU (AIFM Directive).
Capital gains realized by non-resident shareholders holding the shareholding through a permanent establishment in Italy are included in the permanent establishments overall taxable income and are subject to tax in accordance with the tax regime indicated for capital gains realized by Italian resident companies or commercial entities, above.
Financial Transaction Tax
Article 1(491-500) of Law No. 228 of December 24, 2012 introduced a financial transaction tax (FTT) applicable, among others, to the transfers of the ownership of (i) shares issued by Italian joint stock companies (società per azioni) , (ii) participating financial instruments (as defined under article 2346(6) of the Italian Civil Code) issued by Italian resident corporations and (iii) securities representing equity investments in Italian resident corporations. The residence of the issuer for the purposes of FTT is the place where the issuer has its registered office.
Since the registered office of Stevanato is in Italy, transfers of ownership of the Shares will be subject to FTT.
The FTT is due by the transferee of the relevant financial instruments and is generally levied by any financial intermediary intervening in the transaction and has to be paid on or before the 16th day of the month following the one in which the ownership was transferred.
The FTT rates are equal to 0.10 percent for transfers of shares executed in regulated stock markets or through multilateral trading facilities and 0.20 percent for all other taxable transfers. Based on the specific FTT regulations, on the assumption that the NYSE is considered a regulated stock market for FTT purposes, the transfer of the Shares should be subject to 0.10 percent FTT tax rate.
Shareholders are recommended to consult their independent advisors with respect to the application of FTT.
167
Stamp Duty
Pursuant to article 13(2bis-2ter) of the Tariff attached to Presidential Decree No. 642 of October 26, 1972, as amended, regulating the Italian stamp duty (imposta di bollo), subject to certain conditions, a stamp duty may be due, at the rate of 0.2 percent on the market value of the Shares, in connection with the periodic reporting communications sent by Italian financial intermediaries to their clients with respect to any financial instruments (such as the Shares), if deposited with an Italian financial intermediary or with an Italian permanent establishment of a foreign financial intermediary. The stamp duty cannot exceed Euro 14,000 for taxpayers other than individuals.
The stamp duty applies to any investor who is a client (as defined in the regulations issued by the Bank of Italy on June 20, 2012) of an entity that exercises in any form a banking, financial or insurance activity within the Italian territory.
Tax on the Value of Financial Activities Held Abroad
Italian resident individuals, certain partnerships (società semplici) and non-commercial entities holding financial activities abroad shall be generally subject to tax on the value thereof (Ivafe).
Ivafe applies at a rate of 0.2 percent on the value of the financial activity and is due in proportion to the percentage of ownership and the holding period. The value of financial activity corresponds to the market value at the end of each calendar year (or at the end of the holding period); if it is not available, the relevant value is the nominal or the redemption value.
A tax credit is generally granted for any net worth tax paid abroad by the Italian resident individual in relation to the same financial activities, in an amount not exceeding the Ivafe due.
Details of the financial activities held abroad have to be inserted in the income tax return to be filed in Italy by the Italian resident individuals.
Tax Monitoring Obligations
Individuals, non-commercial entities and certain partnerships (in particular, società semplici or similar partnerships in accordance with article 5 of the TUIR) resident in Italy for tax purposes are required to report in their yearly income tax return, for tax monitoring purposes, the amount of securities and financial instruments (including the Shares) held abroad during a tax year, from which income taxable in Italy may be derived.
In relation to the Shares, such reporting obligation shall not apply if the Shares are not held abroad and, in any case, if the Shares are deposited with an Italian financial intermediary that intervenes in the collection of the relevant income and the intermediary applied the due withholding or substitute tax on any income derived from such Shares.
Inheritance and Gift Tax
Subject to certain exceptions, Italian inheritance and gift tax is generally payable on transfers of assets and rights (including shares) (i) by reason of death or donations by Italian residents, even if the transferred assets are held outside Italy and (ii) by reason of death or donations by non-Italian residents, but limited to transferred assets located in Italy (which are presumed by law to include shares of Italian resident companies).
Subject to certain exceptions, transfers of assets and rights (including the Shares) on death or by gift are generally subject to inheritance and gift tax:
| at a rate of 4 percent in case of transfers made to the spouse or relatives in direct line, on the portion of the global net value of the transferred assets, if any, exceeding, for each beneficiary, Euro 1,000,000; |
168
| at a rate of 6 percent in case of transfers made to relatives to the fourth degree or relatives-in-law to the third degree (in the case of transfers to brothers or sisters, the 6% rate is applicable only on the portion of the global net value of the transferred assets, if any, exceeding, for each beneficiary, Euro 100,000); and |
| at a rate of 8 percent in any other case. |
If the beneficiary of any such transfer is an individual with a severe disability pursuant to Law No. 104 of February 5, 1992, inheritance or gift tax is applied only on the value of the asset transferred in excess of Euro 1,500,000 at the rates illustrated above, depending on the relationship existing between the deceased or donor and the beneficiary.
U.S. Federal Income Tax Considerations
The following is a summary of U.S. federal income tax considerations generally applicable to the ownership and disposition of Shares. Unless otherwise noted, this summary addresses only U.S. Holders (as defined below) that acquire our Shares in this offering and hold our Shares as capital assets for U.S. federal income tax purposes. This summary is based on the U.S. Internal Revenue Code of 1986, as amended (the Code), U.S. Treasury regulations promulgated thereunder (Regulations), judicial decisions, administrative pronouncements, and other relevant applicable authorities, all as in effect as of the date hereof and all of which are subject to change or differing interpretations (possibly with retroactive effect). This summary does not address all aspects of U.S. federal income taxation that may be relevant to a particular holder in light of that holders particular circumstances or that may be relevant to certain types of holders subject to special treatment under U.S. federal income tax law, such as:
| banks and other financial institutions; |
| insurance companies; |
| pension plans; |
| cooperatives; |
| regulated investment companies; |
| real estate investment trusts; |
| broker-dealers; |
| traders that elect to use a mark-to-market method of accounting; |
| certain former U.S. citizens or long-term residents; |
| tax-exempt entities (including private foundations); |
| individual retirement accounts or other tax-deferred accounts; |
| persons who acquire Shares pursuant to any employee share option or otherwise as compensation; |
| persons that will hold Shares as part of a straddle, hedge, conversion, constructive sale or other integrated transaction for U.S. federal income tax purposes; |
| persons whose functional currency is not the U.S. dollar; |
| persons that actually or constructively own 10% or more of our stock (by vote or value); and |
| partnerships or other entities or arrangements subject to tax as partnerships for U.S. federal income tax purposes or persons holding Shares through such entities. |
In addition, this summary does not address any U.S. state or local or non-U.S. tax considerations or any U.S. federal estate, gift, or alternative minimum tax considerations, or the Medicare tax on certain net investment income.
169
This information set forth below is of a general nature only and is not intended to be tax advice to any prospective investor. Each prospective investor should consult its tax advisors with respect to the U.S. federal, state, local and non-U.S. income and other tax considerations of owning and disposing of Shares in their particular circumstances.
For purposes of this discussion, a U.S. Holder is a beneficial owner of Shares that is, for U.S. federal income tax purposes:
| an individual who is a citizen or resident of the United States; |
| a corporation (or other entity treated as a corporation for U.S. federal income tax purposes) created in, or organized under the law of, the United States or any political subdivision thereof; |
| an estate the income of which is includible in gross income for U.S. federal income tax purposes regardless of its source; or |
| a trust that is subject to the primary supervision of a court within the United States and the control of one or more United States persons for all substantial decisions or that has otherwise validly elected to be treated as a United States person under the Code. |
If a partnership (or other entity or arrangement treated as a partnership for U.S. federal income tax purposes) is a beneficial owner of Shares, the tax treatment of a partner in the partnership will generally depend upon the status of the partner and the activities of the partnership. Partnerships holding Shares and their partners should consult their tax advisors regarding an investment in the Shares.
Distributions
The gross amount of any distributions on the Shares (including any amounts withheld in respect of Italian withholding taxes) will generally be subject to tax as dividends to the extent of our current or accumulated earnings and profits, as determined for U.S. federal income tax purposes, and will be includible in the gross income of U.S. Holders on the day actually or constructively received. Distributions in excess of earnings and profits will be treated as a non-taxable return of capital to the extent of the U.S. Holders adjusted tax basis in the Shares and thereafter as capital gain. We do not intend to calculate our earnings and profits for U.S. federal income tax purposes, however. Therefore, U.S. Holders should expect that a distribution will generally be treated as a dividend even if that distribution would otherwise be treated as a non-taxable return of capital or as capital gain under the rules described above. Such dividends will not be eligible for the dividends received deduction generally allowed to U.S. corporations under the Code. The following discussion assumes that any dividends will be paid in euros.
Individuals and other non-corporate U.S. Holders may be eligible for reduced rates of taxation on dividends received from a qualified foreign corporation, provided that certain holding period and other requirements are satisfied. A non-U.S. corporation that is not classified as a passive foreign investment company (PFIC) with respect to the relevant U.S. Holder for the taxable year in which the dividend is paid or the preceding taxable year is generally treated as a qualified foreign corporation with respect to dividends on shares that are readily tradable on an established securities market in the United States. The Shares have been approved for listing on the NYSE, which is an established securities market in the United States. The Shares are expected to be readily tradable. There can be no assurance, however, that the Shares will be considered readily tradable on an established securities market in the current year or in future years.
Dividends on the Shares will generally be treated as income from sources outside the United States and will generally constitute passive category income for U.S. foreign tax credit purposes. A U.S. Holder may be eligible, subject to a number of complex limitations, to claim a foreign tax credit not in excess of any applicable treaty rate in respect of any foreign withholding taxes imposed on dividends received on the Shares. A U.S. Holder who does not elect to claim a foreign tax credit for foreign taxes withheld may instead claim a deduction, for U.S.
170
federal income tax purposes, in respect of such withholding, but only for a year in which such U.S. Holder elects to do so for all creditable foreign income taxes. The rules governing the U.S. foreign tax credit are complex and the application thereof depends in large part on the U.S. Holders individual facts and circumstances. Accordingly, U.S. Holders should consult their tax advisors regarding the availability of the U.S. foreign tax credit in their particular circumstances.
The gross amount of any dividend paid in Euros, including any amount of taxes withheld on the dividend amount, will be included in the gross income of a U.S. Holder in an amount equal to the U.S. dollar value of the Euros received calculated by reference to the exchange rate in effect on the date the dividend distribution is received, regardless of whether the payment is in fact converted into U.S. dollars. If the Euros are converted into U.S. dollars on the date of receipt, a U.S. Holder should generally not be required to recognize foreign currency gain or loss in respect of the dividend. If the Euros received are not converted into U.S. dollars on the date of receipt, a U.S. Holder will have a basis in the Euros equal to their U.S. dollar value on the date of receipt. Any gain or loss on a subsequent conversion or other disposition of the Euros will be treated as ordinary income or loss, and will generally be income or loss from sources within the United States for foreign tax credit limitation purposes.
Sale or Other Disposition of Shares
A U.S. Holder will generally recognize gain or loss on the sale or other disposition of Shares in an amount equal to the difference between the amount realized on the disposition (or, if the amount realized is denominated in a foreign currency, the U.S. dollar equivalent thereof, generally determined by reference to the spot rate of exchange on the date of disposition) and the holders adjusted tax basis in such Shares. Any such gain or loss will generally be long-term capital gain or loss if the holders holding period for the Shares exceeds one year at the time of disposition and will generally be U.S. source gain or loss for U.S. foreign tax credit purposes. Individuals who are U.S. Holders will generally be subject to U.S. federal income tax on long-term capital gains at preferential rates. The deductibility of capital losses is subject to limitations. U.S. Holders should consult their tax advisors regarding the tax consequences if a foreign tax is imposed on a disposition of Shares, including the availability of the foreign tax credit under their particular circumstances.
Passive Foreign Investment Company
A non-U.S. corporation, such as the Company, will be classified as a PFIC for U.S. federal income tax purposes for any taxable year if either (i) 75% or more of its gross income for such year consists of certain types of passive income (the income test) or (ii) 50% or more of the value of its assets (determined on the basis of a quarterly average) during such year is attributable to assets that produce or are held for the production of passive income (the asset test). Passive income generally includes dividends, interest, rents, royalties and gains from the disposition of passive assets. Passive assets are those which give rise to passive income, and include assets held for investment, as well as cash, assets readily convertible into cash, and (subject to certain exceptions) working capital. The companys goodwill and other unbooked intangibles are taken into account and may be classified as active or passive depending upon the relative amounts of income generated by the company in each category. We will be treated as owning a proportionate share of the assets and earning a proportionate share of the income of any other corporation in which we own, directly or indirectly, 25% or more (by value) of the stock.
Based on our anticipated market capitalization and the current composition of our income, assets and operations, we believe we were not a PFIC for U.S. federal income tax purposes for our most recent taxable year and do not expect to be a PFIC for the current taxable year or for foreseeable future years. PFIC status is a
factual determination, however, and must be made annually after the close of each taxable year. Moreover, the value of our assets for purposes of the PFIC determination will generally be determined by reference to the public price of the Shares, which could fluctuate significantly. Therefore, there can be no assurance that we will not be classified as a PFIC for the current taxable year or for future years.
171
If we are a PFIC for any taxable year during which a U.S. Holder holds the Shares, such U.S. Holder will be subject to special to special tax rules with respect to any excess distribution that such U.S. Holder receives and any gain such U.S. Holder recognizes from a sale or other disposition (including a pledge) of the Shares, unless such U.S. Holder makes a mark-to-market election as discussed below. Distributions received by a U.S. Holder on Shares in a taxable year that exceed 125% of the average annual distributions on the Shares received the three preceding taxable years or such U.S. Holders holding period for the Shares, whichever is shorter, will be treated as an excess distribution. Under these special tax rules:
| the excess distribution or gain will be allocated pro-rata over the U.S. Holders holding period for the Shares; |
| amounts allocated to the taxable year of the excess distribution or of the sale or other disposition and to any taxable years in such U.S. Holders holding period prior to the first taxable year in which we are classified as a PFIC (a pre-PFIC year) will be taxable as ordinary income; and |
| amounts allocated to each prior taxable year, other than a pre-PFIC, will be subject to tax at the highest tax rate in effect applicable to such U.S. Holder for that year, and such amounts will be increased by an additional tax equal to interest on the resulting tax deemed deferred with respect to such years. |
If we are a PFIC for any taxable year during which a U.S. Holder holds the Shares and any of our non-U.S. subsidiaries are also PFICs, such U.S. Holder will be treated as owning a proportionate amount (by value) of the shares of each such non-U.S. subsidiary classified as a PFIC for purposes of the application of these rules.
Certain elections may be available that would result in alternative treatments, such as mark-to-market treatment, of the Shares. Each U.S. Holder should consult its tax adviser as to whether a mark-to-market election is available or advisable with respect to the Shares. As a technical matter, however, a mark-to-market election cannot be made for any lower-tier PFICs that we may own, so a U.S. Holder may continue to be subject to the PFIC rules with respect to such U.S. Holders indirect interest in any investments held by us that are treated as an equity interest in a PFIC for U.S. federal income tax purposes. We do not expect to prepare or provide the information that would enable U.S. Holders to make a qualified electing fund (QEF) election. If we are considered a PFIC, a U.S. Holder also will be subject to annual information reporting requirements.
If we are a PFIC for any taxable year that a U.S. Holder holds Shares, we will continue to be treated as a PFIC with respect to such U.S. Holders investment unless (i) we cease to be a PFIC and (ii) the U.S. Holder has made a deemed sale election under the PFIC rules.
U.S. Holders should consult their tax advisers about the potential application of the PFIC rules to an investment in the Shares.
Foreign Financial Asset Reporting
Certain U.S. Holders are required to report their holdings of certain foreign financial assets, including equity of foreign entities, if the aggregate value of all of these assets exceeds certain threshold amounts. The Shares are expected to constitute foreign financial assets subject to these requirements unless the Shares are held in an account at certain financial institutions. U.S. Holders should consult their tax advisors regarding the application of these reporting requirements, and the significant penalties for non-compliance.
172
Under the terms and subject to the conditions contained in the underwriting agreement dated the date of this prospectus, we and the Selling Shareholder have agreed to sell to the underwriters named below, for whom Morgan Stanley & Co. LLC, BofA Securities, Inc. and Jefferies LLC are acting as representatives, the following respective numbers of ordinary shares:
Underwriter |
Number of |
|||
Morgan Stanley & Co. LLC |
8,941,177 | |||
BofA Securities, Inc. |
6,588,235 | |||
Jefferies LLC |
6,588,235 | |||
Citigroup Global Markets Inc. |
2,823,529 | |||
UBS Securities LLC |
2,823,529 | |||
KeyBanc Capital Markets Inc. |
1,411,765 | |||
Wells Fargo Securities, LLC |
1,411,765 | |||
William Blair & Company, L.L.C. |
1,411,765 | |||
|
|
|||
Total |
32,000,000 | |||
|
|
The underwriters and the representatives are collectively referred to as the underwriters and the representatives, respectively. The underwriters are offering the ordinary shares subject to their acceptance of the ordinary shares from us and subject to prior sale. The underwriting agreement provides that the obligations of the underwriters to purchase the ordinary shares included in this offering are subject to the approval of certain legal matters by their counsel and to certain other conditions. The underwriters are obligated, severally and not jointly, to purchase all the ordinary shares (other than those covered by the over-allotment option described below) if they purchase any of the ordinary shares.
All sales of ordinary shares in the United States will be made through United States registered broker-dealers. Sales of ordinary shares made outside the United States may be made by affiliates of the underwriters. The address of Morgan Stanley & Co. LLC is 1585 Broadway, New York, NY 10036. The address of BofA Securities, Inc. is One Bryant Park, New York, NY 10036. The address of Jefferies LLC is 520 Madison Avenue, New York, NY 10022. .
We and the Selling Shareholder have granted to the underwriters an option, exercisable for 30 days from the date of this prospectus, to purchase on a pro rata basis up to 3.36 million additional ordinary shares from us and up to 1.44 million additional ordinary shares from the Selling Shareholder at the initial public offering price less the underwriting discounts and commissions. Any ordinary shares issued or sold under the option will be issued and sold on the same terms and conditions as the other ordinary shares that are the subject of this offering. The option may be exercised only to cover any over-allotments of ordinary shares.
The underwriters propose to offer the ordinary shares initially at the initial public offering price set forth on the cover of this prospectus. Any ordinary shares sold by the underwriters to securities dealers may be sold at a discount from the initial public offering price not to exceed $0.5355 per share of ordinary shares. If all the ordinary shares are not sold at the initial offering price, the underwriters may change the offering price and the other selling terms.
173
The following table shows the underwriting discounts and commissions that we and the Selling Shareholder are to pay to the underwriters in connection with this offering. These amounts are shown assuming both no exercise and full exercise of the underwriters over-allotment option.
Paid by us | Paid by the Selling Shareholder | |||||||||||||||
No Exercise | Full Exercise | No Exercise | Full Exercise | |||||||||||||
Per Share |
$ | 0.89 | $ | 0.89 | $ | 0.89 | $ | 0.89 | ||||||||
Total |
$ | 19,936,000 | $ | 22,926,400 | $ | 8,544,000 | $ | 9,825,600 |
We and the Selling Shareholder estimate that our respective portions of the total expenses of the offering, exclusive of the underwriting discounts and commissions, will be $11,222,210.55 and $4,809,518.81, respectively. We have also agreed to reimburse the underwriters for certain of their expenses in an amount up to $40,000.
The underwriters have informed us that they do not intend sales to accounts over which the underwriters have discretionary authority to exceed 5% of the total number of ordinary shares offered by them.
We have agreed that we will not offer, sell, contract to sell, pledge or otherwise dispose of, directly or indirectly, or file with the Securities and Exchange Commission a registration statement under the Securities Act relating to, any ordinary shares or securities convertible into or exchangeable or exercisable for any ordinary shares, or publicly disclose the intention to make any offer, sale, pledge, disposition or filing, without the prior written consent of the representatives for a period of 180 days after the date of this prospectus, except issuances pursuant to employee stock options outstanding on the date hereof.
Each of our directors, executive officers and existing shareholders have agreed that they will not offer, sell, contract to sell, pledge or otherwise dispose of, directly or indirectly, any ordinary shares or securities convertible into or exchangeable or exercisable for any ordinary shares, enter into a transaction that would have the same effect, or establish or increase a put equivalent position or liquidate or decrease a call equivalent position in any ordinary share or securities convertible into or exchangeable or exercisable for any ordinary shares, or enter into any swap, hedge or other arrangement that transfers, in whole or in part, any of the economic consequences of ownership of our ordinary shares or securities convertible into or exchangeable or exercisable for any ordinary shares, whether any of these transactions are to be settled by delivery of our ordinary shares or other securities, in cash or otherwise, or publicly disclose the intention to make any offer, sale, pledge or disposition, to establish, increase, liquidate or decrease any such position, or to enter into any transaction, swap, hedge or other arrangement, without, in each case, the prior written consent of the representatives for a period of 180 days after the date of this prospectus.
The restrictions described in the immediately preceding two paragraphs do not apply to: the sale of Shares to the underwriters in the offering; such ordinary shares acquired in the open market transactions following the offering, provided that no filing under the Exchange Act or the Securities Act or other public announcement is required or made voluntarily during the lock-up period in connection with such transfer of shares; the transfer of ordinary shares or any security convertible into ordinary shares as a bona fide gift (provided that each donee signs and delivers a lock-up agreement substantially in the form of the lock-up agreement between the donor and the underwriters); the distribution of ordinary shares or any security convertible into ordinary shares to limited partners or shareholders of the person adhering to the lock-up (provided that each distributee signs and delivers a lock-up agreement substantially in the form of the lock-up agreement between the distributor and the underwriters); facilitating the establishment of a trading plan pursuant to Rule 10b5-1 under the Exchange Act, provided that no transfers occur under such plan during the lock-up period and no public announcement or filing shall be required or voluntarily made by any person in connection therewith until after the expiration of the lock-up period; the transfer to any trust for the direct or indirect benefit of the person adhering to the lock-up agreement or of the immediate family of such person, provided that the trustee of the trust agrees to be bound in writing by the restrictions set forth in the lock-up agreement between the transferor and the underwriter, and provided further that any such transfer does not involve a disposition for value, or if the relevant person entering
174
into a lock-up agreement with the underwriters is a corporation, to any wholly-owned subsidiary of such corporation or to an affiliate that is wholly-owned by the same persons that own such corporation, provided, however, that in any such case, it is a condition to the transfer that the transferee execute an agreement stating that the transferee is receiving and holding such ordinary shares subject to the provisions of the lock-up agreement between the transferor and the underwriters and that there shall be no further transfer of such ordinary shares except in accordance with such agreement (provided such transfer does not on its own require public disclosure or filing under the Exchange Act that is required to be made or made voluntarily, reporting a reduction in beneficial ownership of ordinary shares in connection with such transfer). For the purpose of the lock-up agreements entered into by us, our directors, executive officers and our existing shareholders, immediate family means any relationship by blood, marriage or adoption, not more remote than first cousin.
Prior to this offering, there has been no public market in the United States for our ordinary shares. Consequently, the initial public offering price for the ordinary shares has been determined by negotiations among us, the Selling Shareholder and the representatives. The factors considered in determining the initial public offering price include our results of operations, our current financial condition, our future prospects, our markets, the economic conditions in and future prospects for the industry in which we compete, our management and currently prevailing general conditions in the equity securities markets, including current market valuations of publicly traded companies considered comparable to our company. Neither we nor the underwriters can assure investors that an active trading market will develop for our ordinary shares, or that our ordinary shares will trade in the public market at or above the initial public offering price.
Our ordinary shares have been approved for listing on the NYSE under the symbol STVN.
In connection with the offering, the underwriters may engage in stabilizing transactions, over-allotment transactions, syndicate covering transactions and penalty bids in accordance with Regulation M under the Exchange Act.
STABILIZING TRANSACTIONS PERMIT BIDS TO PURCHASE THE UNDERLYING SECURITY SO LONG AS THE STABILIZING BIDS DO NOT EXCEED A SPECIFIED MAXIMUM.
OVER-ALLOTMENT INVOLVES SALES BY THE UNDERWRITERS OF ORDINARY SHARES IN EXCESS OF THE NUMBER OF ORDINARY SHARES THE UNDERWRITERS ARE OBLIGATED TO PURCHASE, WHICH CREATES A SYNDICATE SHORT POSITION. THE SHORT POSITION MAY BE EITHER A COVERED SHORT POSITION OR A NAKED SHORT POSITION. IN A COVERED SHORT POSITION, THE NUMBER OF ORDINARY SHARES OVER-ALLOTTED BY THE UNDERWRITERS IS NOT GREATER THAN THE NUMBER OF ORDINARY SHARES THAT THEY MAY PURCHASE IN THE OVER-ALLOTMENT OPTION. IN A NAKED SHORT POSITION, THE NUMBER OF ORDINARY SHARES INVOLVED IS GREATER THAN THE NUMBER OF ORDINARY SHARES IN THE OVER-ALLOTMENT OPTION. THE UNDERWRITERS MAY CLOSE OUT ANY COVERED SHORT POSITION BY EITHER EXERCISING THEIR OVER-ALLOTMENT OPTION AND/OR PURCHASING ORDINARY SHARES IN THE OPEN MARKET.
SYNDICATE COVERING TRANSACTIONS INVOLVE PURCHASES OF ORDINARY SHARES IN THE OPEN MARKET AFTER THE DISTRIBUTION HAS BEEN COMPLETED IN ORDER TO COVER SYNDICATE SHORT POSITIONS. IN DETERMINING THE SOURCE OF ORDINARY SHARES TO CLOSE OUT THE SHORT POSITION, THE UNDERWRITERS WILL CONSIDER, AMONG OTHER THINGS, THE PRICE OF ORDINARY SHARES AVAILABLE FOR PURCHASE IN THE OPEN MARKET AS COMPARED TO THE PRICE AT WHICH THEY MAY PURCHASE ORDINARY SHARES THROUGH THE OVER-ALLOTMENT OPTION. IF THE UNDERWRITERS SELL MORE ORDINARY SHARES THAN COULD BE COVERED BY THE OVER-ALLOTMENT OPTION, A NAKED SHORT POSITION, THE POSITION CAN ONLY BE CLOSED OUT BY BUYING ORDINARY SHARES IN THE OPEN MARKET. A NAKED SHORT POSITION IS MORE LIKELY TO BE CREATED IF THE UNDERWRITERS ARE CONCERNED THAT THERE COULD BE
175
DOWNWARD PRESSURE ON THE PRICE OF THE ORDINARY SHARES IN THE OPEN MARKET AFTER PRICING THAT COULD ADVERSELY AFFECT INVESTORS WHO PURCHASE IN THE OFFERING.
PENALTY BIDS PERMIT THE REPRESENTATIVES TO RECLAIM A SELLING CONCESSION FROM A SYNDICATE MEMBER WHEN ORDINARY SHARES ORIGINALLY SOLD BY THE SYNDICATE MEMBER ARE PURCHASED IN A STABILIZING OR SYNDICATE COVERING TRANSACTION TO COVER SYNDICATE SHORT POSITIONS.
These stabilizing transactions, syndicate covering transactions and penalty bids may have the effect of raising or maintaining the market price of ordinary shares or preventing or retarding a decline in the market price of ordinary shares. As a result, the price of ordinary shares may be higher than the price that might otherwise exist in the open market. These transactions may be effected on the or otherwise, and, if commenced, may be discontinued at any time.
A prospectus in electronic format may be made available by e-mail or on the websites or through online services maintained by one or more of the underwriters or their affiliates. In those cases, prospective investors may view offering terms online and may be allowed to place orders online. The underwriters may agree with us to allocate a specific number of ordinary shares for sale to online brokerage account holders. Any such allocation for online distributions will be made by the underwriters on the same basis as other allocations. Other than the prospectus in electronic format, the information on the underwriters websites and any information contained in any other website maintained by any of the underwriters is not part of this prospectus, has not been approved and/or endorsed by us or the underwriters and should not be relied upon by investors.
Relationships
The underwriters and their respective affiliates are full service financial institutions engaged in various activities, which may include securities trading, commercial and investment banking, financial advisory, investment management, principal investment, hedging, financing and brokerage activities. Certain of the underwriters and their respective affiliates have in the past performed commercial banking, investment banking and advisory services for us from time to time for which they have received customary fees and reimbursement of expenses and may, from time to time, engage in transactions with and perform services for us in the ordinary course of their business for which they may receive customary fees and reimbursement of expenses. In addition, in the ordinary course of their various business activities, the underwriters and their respective affiliates may make or hold a broad array of investments and actively trade debt and equity securities (or related derivative securities) and financial instruments (which may include bank loans and/or credit default swaps) for their own account and for the accounts of their customers and may at any time hold long and short positions in such securities and instruments. Such investments and securities activities may involve securities and/or instruments of ours or our affiliates. The underwriters and their affiliates may also make investment recommendations and/or publish or express independent research views in respect of such securities or financial instruments and may hold, or recommend to clients that they acquire, long and/or short positions in such securities and instruments.
We and the Selling Shareholder have agreed to indemnify the underwriters against certain liabilities, including liabilities under the Securities Act, or to contribute to payments the underwriters may be required to make because of any of those liabilities.
Notice to Investors
Notice to Prospective Investors in the European Economic Area
In relation to each member state of the European Economic Area (each, a relevant member state), no ordinary shares have been offered or will be offered pursuant to the offering described in this prospectus to the public in that relevant member state prior to the publication of a prospectus in relation to the ordinary shares that
176
has been approved by the competent authority in that relevant member state, all in accordance with the Prospectus Regulation, except that offers of ordinary shares may be made to the public in that relevant member state at any time:
| to any legal entity which is a qualified investor as defined under article 2(e) of the Prospectus Regulation; |
| to fewer than 150 natural or legal persons (other than qualified investors as defined under article 2(e) of the Prospectus Regulation), subject to obtaining the prior consent of the underwriters for any such offer; or |
| in any other circumstances falling within article 1(4) of the Prospectus Regulation, |
provided that no such offer of ordinary shares shall require us or any underwriter to publish a prospectus pursuant to article 3 of the Prospectus Regulation or supplement a prospectus pursuant to article 23 of the Prospectus Regulation.
For purposes of this provision, the expression an offer to the public in relation to any ordinary shares in any relevant member state means the communication in any form and by any means of sufficient information on the terms of the offer and any ordinary shares to be offered so as to enable an investor to decide to purchase or subscribe for any ordinary shares, and the expression Prospectus Regulation means Regulation (EU) 2017/1129.
The sellers of the ordinary shares have not authorized and do not authorize the making of any offer of ordinary shares through any financial intermediary on their behalf, other than offers made by the underwriters with a view to the final placement of the ordinary shares as contemplated in this prospectus. Accordingly, no purchaser of the ordinary shares, other than the underwriters, is authorized to make any further offer of the ordinary shares on behalf of the sellers or the underwriters.
Notice to Prospective Investors in the United Kingdom
No ordinary shares have been offered or will be offered pursuant to the offering described in this prospectus to the public in the United Kingdom prior to the publication of a prospectus in relation to the ordinary shares that either (i) has been approved by the Financial Conduct Authority or (ii) is to be treated as if it had been approved by the Financial Conduct Authority in accordance with the transitional provisions in Regulation 74 of the Prospectus (Amendment etc.) (EU Exit) Regulations 2019, except that offers of ordinary shares may be made to the public in the United Kingdom at any time:
| to any legal entity which is a qualified investor as defined under article 2 of the UK Prospectus Regulation; |
| to fewer than 150 natural or legal persons (other than qualified investors as defined under article 2 of the UK Prospectus Regulation), subject to obtaining the prior consent of the underwriters for any such offer; or |
| in any other circumstances falling within section 86 of the Financial Services and Markets Act 2000 (as amended, the FSMA), |
provided that no such offer of ordinary shares shall require us or any underwriter to publish a prospectus pursuant to section 85 of the FSMA or supplement a prospectus pursuant to article 23 of the UK Prospectus Regulation.
For purposes of this provision, the expression an offer to the public in relation to any ordinary shares in the United Kingdom means the communication in any form and by any means of sufficient information on the terms of the offer and any ordinary shares to be offered so as to enable an investor to decide to purchase or subscribe for any ordinary shares, and the expression UK Prospectus Regulation means Regulation (EU) 2017/1129 as it forms part of domestic law by virtue of the European Union (Withdrawal) Act 2018.
177
This prospectus is only being distributed to, and is only directed at, persons in the United Kingdom that are qualified investors (as defined in the UK Prospectus Regulation) who (i) are investment professionals falling within article 19(5) of the Financial Services and Markets Act 2000 (Financial Promotion) Order 2005 (as amended, the Order) or (ii) are high net worth entities or other persons falling within article 49(2)(a) to (d) of the Order or (iii) are persons to whom an invitation or inducement to engage in investment activity (within the meaning of section 21 of the FSMA) in connection with the issue or sale of any ordinary shares may otherwise lawfully be communicated or caused to be communicated (all such persons being referred to as relevant persons). This prospectus is directed only at relevant persons and must not be acted on or relied on by persons who are not relevant persons. Any investment or investment activity to which this prospectus relates is available only to relevant persons and will be engaged in only with relevant persons. Any person who is not a relevant person should not act or rely on this prospectus or any of its contents.
Notice to prospective investors in Canada
The ordinary shares may be sold only to purchasers purchasing, or deemed to be purchasing, as principal that are accredited investors, as defined in National Instrument 45-106 Prospectus Exemptions or subsection 73.3(1) of the Securities Act (Ontario), and are permitted clients, as defined in National Instrument 31-103 Registration Requirements, Exemptions and Ongoing Registrant Obligations. Any resale of the ordinary shares must be made in accordance with an exemption from, or in a transaction not subject to, the prospectus requirements of applicable securities laws.
Securities legislation in certain provinces or territories of Canada may provide a purchaser with remedies for rescission or damages if this prospectus (including any amendment thereto) contains a misrepresentation, provided that the remedies for rescission or damages are exercised by the purchaser within the time limit prescribed by the securities legislation of the purchasers province or territory. The purchaser should refer to any applicable provisions of the securities legislation of the purchasers province or territory for particulars of these rights or consult with a legal advisor.
Pursuant to section 3A.3 of National Instrument 33-105 Underwriting Conflicts (NI 33-105), the underwriters are not required to comply with the disclosure requirements of NI 33-105 regarding underwriter conflicts of interest in connection with this offering.
Notice to prospective investors in Hong Kong
The underwriters and each of their affiliates have not (1) offered or sold, and will not offer or sell, in Hong Kong, by means of any document, the ordinary shares other than (A) to professional investors as defined in the Securities and Futures Ordinance (Cap. 571) of Hong Kong and any rules made under that Ordinance or (B) in other circumstances which do not result in the document being a prospectus as defined in the Companies Ordinance (Cap. 32 of Hong Kong) or which do not constitute an offer to the public within the meaning of that Ordinance or (2) issued or had in its possession for the purposes of issue, and will not issue or have in its possession for the purposes of issue, whether in Hong Kong or elsewhere any advertisement, invitation or document relating to the ordinary shares which is directed at, or the contents of which are likely to be accessed or read by, the public in Hong Kong (except if permitted to do so under the securities laws of Hong Kong) other than with respect to the securities which are or are intended to be disposed of only to persons outside Hong Kong or only to professional investors as defined in the Securities and Futures Ordinance and any rules made under that Ordinance. The contents of this document have not been reviewed by any regulatory authority in Hong Kong. You are advised to exercise caution in relation to the offer. If you are in any doubt about any of the contents of this document, you should obtain independent professional advice.
Notice to prospective investors in Italy
This prospectus has not been submitted to the clearance of CONSOB and will not be subject to formal review or clearance by CONSOB.
178
The ordinary shares may not be offered, sold or delivered, directly or indirectly, in Italy or to a resident of Italy, unless such offer, sale or delivery of ordinary shares or distribution of copies of this prospectus or other documents relating to the offering in Italy is made:
a) | to qualified investors (investitori qualificati), as defined pursuant to Article 2 of the Prospectus Regulation and the applicable Italian laws; |
b) | in other circumstances which are exempted from the rules on public offers pursuant to Article 1 of the Prospectus Regulation and the applicable Italian laws. |
Any offer, sale or delivery of the ordinary shares or any distribution of this prospectus or any other document relating to the offering within the Republic of Italy must be in compliance with the selling restrictions under (a) and (b) above and must be, in any event:
| made by an investment firm, bank or financial intermediary, permitted to conduct such activities in Italy in accordance with the Legislative Decree No. 385 of September 1, 1993, as amended, the Legislative Decree February 24, 1998 No. 58, as amended, the CONSOB Regulation No. 11971 of May 14, 1999, as amended and the CONSOB Regulation no. 20307 of 15 February 2018, as amended; and |
| in accordance with any other applicable Italian securities, tax, exchange control and any other applicable laws and regulation, including any requirements or limitations which may be imposed by CONSOB, the Bank of Italy or by any other competent authority from time to time. |
Any investor purchasing the ordinary shares is solely responsible for ensuring that any offer or resale of the ordinary shares it purchased occurs in compliance with applicable laws and regulations.
In accordance with Article 5 of the Prospectus Regulation and the applicable Italian laws, any subsequent resale on the secondary market in the Republic of Italy of the ordinary shares shall be considered as a separate offer that must be made in compliance with the Article 5 of the Prospectus Regulation and the applicable Italian laws. Pursuant to Italian laws failure to comply with such rules may result in the subsequent resale of such ordinary shares being declared null and void and in the liability of the intermediary transferring the ordinary shares for any damage suffered by the investors.
Notice to prospective investors in Japan
The offering has not been and will not be registered under the Financial Instruments and Exchange Law of Japan (Law No. 25 of 1948 of Japan, as amended), or FIEL, and the underwriters will not offer or sell any securities, directly or indirectly, in Japan or to, or for the benefit of, any resident of Japan (which term as used herein means, unless otherwise provided herein, any person resident in Japan, including any corporation or other entity organized under the laws of Japan), or to others for re-offering or resale, directly or indirectly, in Japan or to a resident of Japan, except pursuant to an exemption from the registration requirements of, and otherwise incompliance with, the FIEL and any other applicable laws, regulations and ministerial guidelines of Japan.
Notice to prospective investors in Singapore
This prospectus or any other offering material relating to the ordinary shares has not been and will not be registered as a prospectus with the Monetary Authority of Singapore, and the ordinary shares will be offered in Singapore pursuant to exemptions under Section 274 and Section 275 of the Securities and Futures Act, Chapter 289 of Singapore, or the Securities and Futures Act. Accordingly the ordinary shares may not be offered or sold, or be the subject of an invitation for subscription or purchase, nor may this prospectus or any other offering material relating to the ordinary shares be circulated or distributed, whether directly or indirectly, to the public or any member of the public in Singapore other than (a) to an institutional investor or other person specified in Section 274 of the Securities and Futures Act, (b) to a sophisticated investor, and in accordance with the
179
conditions specified in Section 275 of the Securities and Futures Act or (c) otherwise pursuant to, and in accordance with the conditions of, any other applicable provision of the Securities and Futures Act.
Solely for the purposes of our obligations pursuant to sections 309B(1)(a) and 309B(1)(c) of the SFA, we have determined, and hereby notify all relevant persons (as defined in Section 309A of the SFA), that the ordinary shares are prescribed capital markets products (as defined in the Securities and Futures (Capital Markets Products) Regulations 2018) and Excluded Investment Products (as defined in MAS Notice SFA 040-N12: Notice on the Sale of Investment Products and MAS Notice FAA-N16: Notice on Recommendations on Investment Products).
Notice to prospective investors in Switzerland
This prospectus is not intended to constitute an offer or solicitation to purchase or invest in the ordinary shares. The ordinary shares may not be publicly offered, directly or indirectly, in Switzerland within the meaning of the Swiss Financial Services Act, or FinSA, and no application has or will be made to admit the ordinary shares to trading on any trading venue (exchange or multilateral trading facility) in Switzerland. Neither this prospectus nor any other offering or marketing material relating to the ordinary shares constitutes a prospectus pursuant to the FinSA, and neither this prospectus nor any other offering or marketing material relating to the ordinary shares may be publicly distributed or otherwise made publicly available in Switzerland.
180
EXPENSES RELATED TO THIS OFFERING
Set forth below is an itemization of the total expenses, excluding underwriting discounts and commissions, that we and the Selling Shareholder expect to incur in connection with this offering. With the exception of the SEC registration fee, the Financial Industry Regulatory Authority, or FINRA, filing fee, and the stock exchange application and listing fee, all amounts are estimates.
SEC Registration Fee |
$ | 120,446.40 | ||
FINRA Fee |
$ | 166,100.00 | ||
Stock exchange application and listing fee |
$ | 237,200.00 | ||
Printing and Engraving Expenses |
$ | 400,000.00 | ||
Legal Fees and Expenses |
$ | 2,500,000.00 | ||
Accounting Fees and Expenses |
$ | 1,011,500.00 | ||
Miscellaneous |
$ | 11,596,482.96 | ||
|
|
|||
Total |
$ | 16,031,729.36 | ||
|
|
181
We are being represented by Skadden, Arps, Slate, Meagher & Flom (UK) LLP with respect to certain legal matters as to United States federal securities and New York State law. The underwriters are being represented by Latham & Watkins LLP with respect to certain legal matters as to United States federal securities and New York State law. The validity of the ordinary shares offered in this offering, and certain legal matters as to Italian law, will be passed upon for us by Chiomenti Studio Legale. Certain legal matters as to Italian law will be passed upon for the underwriters by Latham & Watkins LLP. Skadden, Arps, Slate, Meagher & Flom (UK) LLP may rely upon Chiomenti Studio Legale with respect to matters governed by Italian law.
182
The consolidated financial statements of Stevanato Group S.p.A. as of December 31, 2020 and 2019, and January 1, 2019, and for each of the two years in the period ended December 31, 2020, appearing in this Prospectus and Registration Statement, have been audited by EY S.p.A., independent registered public accounting firm, as set forth in their report thereon appearing elsewhere herein, and are included in reliance upon such report given on the authority of such firm as experts in accounting and auditing.
183
SERVICE OF PROCESS AND ENFORCEABILITY OF JUDGMENTS AGAINST FOREIGN PERSONS
We are incorporated and currently existing under the laws of the Republic of Italy. In addition, most of our directors and officers reside outside the United States, and most of the assets of our non-U.S. subsidiaries are located outside the United States. As a result, it may be a long and costly process for investors to effect service of process on us or those non-U.S. resident persons in the United States or to enforce in the United States judgments obtained in United States courts against us or those non-U.S. resident persons based on the civil liability or other provisions of the United States securities laws or other laws. It may be possible for investors to effect service of process within other jurisdictions (including Italy) upon us or those non-U.S. resident persons provided that, for example, The Hague Convention on the Service Abroad of Judicial and Extrajudicial Documents in Civil or Commercial Matters of November 15, 1965 is complied with.
Judgments of U.S. courts may be enforceable in Italy. Final enforceable and conclusive judgments rendered by U.S. courts, even if obtained by default, shall not require retrial on the merits and will be enforceable in the Republic of Italy, provided that pursuant to article 64 of Italian Law No. 218 of May 31, 1995 (riforma del sistema italiano di diritto internazionale privato), the following conditions are met:
| the U.S. court which rendered the final judgment had jurisdiction according to Italian law principles of jurisdiction; |
| the relevant summons and complaint was appropriately served on the defendants in accordance with U.S. law and during the proceedings the essential rights of the defendants have not been violated; |
| the parties to the proceedings appeared before the court in accordance with U.S. law or, in the event of default by the defendants, the U.S. court declared such default in accordance with U.S. law; |
| the decision is final pursuant to U.S. law; |
| there is no conflicting final judgment previously rendered by an Italian court; |
| there is no pending proceedings before an Italian court between the same parties over the same matter which were instituted before the U.S. proceedings; |
| the provisions of such judgment would not violate Italian public policy. |
In addition, pursuant to article 67 of Italian Law No. 218 of May 31, 1995, if a judgment rendered by a U.S. court is not complied with, its recognition is challenged or its compulsory enforcement is necessary, then a proceeding shall be initiated before the competent Court of Appeal in Italy to that end. The competent Court of Appeal does not consider the merits of the case but exclusively ascertains the fulfillment of all the conditions set out above.
In original actions brought before Italian courts, the enforceability of liabilities or remedies based solely on the U.S. federal securities law is debatable. If an original action is brought before an Italian court, the Italian court may apply not only Italian rules of civil procedure, but also certain substantive provisions of Italian law that are regarded as mandatory and may refuse to apply the U.S. law provisions or grant some of the remedies sought (e.g., punitive damages) if their application violates Italian public policy and/or any mandatory provisions of Italian law.
Italian shareholders should seek advice from their own counsel based on the applicable circumstances.
184
WHERE YOU CAN FIND ADDITIONAL INFORMATION
We have filed a registration statement, including relevant exhibits, with the SEC on Form F-1 under the Securities Act with respect to the Shares to be sold as contemplated by this prospectus. This prospectus, which constitutes a part of the registration statement on Form F-1, does not contain all of the information contained in the registration statement. You should read our registration statement and the exhibits and schedules thereto for further information with respect to us and our Shares.
Immediately upon the effectiveness of the registration statement on Form F-1 of which this prospectus forms a part, we will become subject to periodic reporting and other informational requirements of the Exchange Act as applicable to foreign private issuers. Accordingly, we will be required to file reports, including annual reports on Form 20-F and other information with the SEC. All information filed with the SEC can be obtained over the internet at the SECs website at www.sec.gov, or inspected and copied at the public reference facilities maintained by the SEC at 100 F Street, N.E., Washington, D.C. 20549. You can request copies of documents, upon payment of a duplicating fee, by writing to the SEC. You may obtain further information about operation of the SECs Public Reference Room by calling the SEC at 1-800-SEC-0330.
In addition, following the closing of this offering, we will make the information filed with or furnished to the SEC available free of charge through our website (www.stevanatogroup.com) or by calling us at +39 049 9318111 as soon as reasonably practicable after we electronically file such material with, or furnish it to, the SEC. The information contained on our website is not a part of this prospectus.
As a foreign private issuer, we are exempt under the Exchange Act from, among other things, the rules prescribing the furnishing and content of proxy statements. While we furnish proxy statements to shareholders in accordance with the rules of any stock exchange on which our ordinary shares may be listed in the future, those proxy statements will not conform to Schedule 14A of the proxy rules promulgated under the Exchange Act. Our executive officers, directors and principal shareholders are also exempt from the reporting and short-swing profit recovery provisions contained in Section 16 of the Exchange Act. Although we will not be required under the Exchange Act to file periodic reports and financial statements with the SEC as frequently or as promptly as U.S. companies whose securities are registered under the Exchange Act, we will furnish holders of our ordinary shares with annual reports containing audited financial statements and a report by our independent registered public accounting firm and intend to make available quarterly reports containing selected unaudited financial data for the first three quarters of each fiscal year. The audited financial statements will be prepared in accordance with IFRS and those reports will include a Managements discussion and analysis of financial condition and results of operations section for the relevant periods.
185
INDEX TO THE CONSOLIDATED FINANCIAL STATEMENTS OF STEVANATO GROUP S.P.A.
Consolidated Financial Statements at December 31, 2020 and 2019 |
||||
F-2 | ||||
F-3 | ||||
F-4 | ||||
F-5 | ||||
F-6 | ||||
F-7 | ||||
F-8 | ||||
Interim Condensed Consolidated Financial Statements as at March 31, 2021 and for three months ended March 31, 2021 and 2020 |
||||
F-85 | ||||
Interim condensed consolidated statement of comprehensive income |
F-86 | |||
Interim condensed consolidated statement of financial position |
F-87 | |||
Interim condensed consolidated statement of changes in equity |
F-88 | |||
F-89 | ||||
Notes to the interim condensed consolidated financial statements |
F-90 |
F-1
REPORT OF INDEPENDENT REGISTERED PUBLIC ACCOUNTING FIRM
To the Shareholders and the Board of Directors of
Stevanato Group S.p.A.
Opinion on the Financial Statements
We have audited the accompanying consolidated statements of financial position of Stevanato Group S.p.A. (the Company) as of December 31, 2020 and 2019, and January 1, 2019, the related consolidated income statements, consolidated statements of comprehensive income, changes in equity and cash flows for each of the two years in the period ended December 31, 2020, and the related notes (collectively referred to as the consolidated financial statements). In our opinion the consolidated financial statements present fairly, in all material respects, the financial position of the Company at December 31, 2020 and 2019, and January 1, 2019, and the results of its operations and its cash flows for each of the two years in the period ended December 31, 2020, in conformity with International Financial Reporting Standards as issued by the International Accounting Standards Board.
Change in Basis of Accounting
As discussed in Note 2 to the consolidated financial statements, in 2019 the Company changed its basis of accounting from Italian generally accepted accounting principles to International Financial Reporting Standards as issued by the International Accounting Standards Board.
Basis for Opinion
These financial statements are the responsibility of the Companys management. Our responsibility is to express an opinion on the Companys financial statements based on our audits. We are a public accounting firm registered with the Public Company Accounting Oversight Board (United States) (PCAOB) and are required to be independent with respect to the Company in accordance with the U.S. federal securities laws and the applicable rules and regulations of the Securities and Exchange Commission and the PCAOB.
We conducted our audits in accordance with the standards of the PCAOB. Those standards require that we plan and perform the audit to obtain reasonable assurance about whether the financial statements are free of material misstatement, whether due to error or fraud. The Company is not required to have, nor were we engaged to perform, an audit of its internal control over financial reporting. As part of our audits we are required to obtain an understanding of internal control over financial reporting but not for the purpose of expressing an opinion on the effectiveness of the Companys internal control over financial reporting. Accordingly, we express no such opinion.
Our audits included performing procedures to assess the risks of material misstatement of the financial statements, whether due to error or fraud, and performing procedures that respond to those risks. Such procedures included examining, on a test basis, evidence regarding the amounts and disclosures in the financial statements. Our audits also included evaluating the accounting principles used and significant estimates made by management, as well as evaluating the overall presentation of the financial statements. We believe that our audits provide a reasonable basis for our opinion.
/s/ EY S.p.A.
We have served as the Companys auditor since 2017.
Treviso, Italy
April 27, 2021, except as to Notes 15, 27 and 41, as to which the date is July 7, 2021.
F-2
Stevanato Group S.p.A.
Consolidated income statements
for the years ended December 31, 2020 and 2019
Notes | For the years ended December 31, |
|||||||||||
2020 | 2019 | |||||||||||
(EUR thousand) | ||||||||||||
Revenues |
6 | 662,037 | 536,539 | |||||||||
Cost of sales |
7 | 467,861 | 398,518 | |||||||||
|
|
|
|
|||||||||
Gross profit |
194,176 | 138,021 | ||||||||||
Other operating income |
8 | 5,230 | 8,737 | |||||||||
Selling and Marketing expenses |
9 | 20,044 | 26,144 | |||||||||
Research and Development expenses |
9 | 17,390 | 7,826 | |||||||||
General and Administrative expenses |
9 | 58,863 | 50,568 | |||||||||
|
|
|
|
|||||||||
Operating profit |
103,109 | 62,220 | ||||||||||
Finance income |
11 | 14,926 | 8,006 | |||||||||
Finance expense |
12 | 21,848 | 15,250 | |||||||||
Share of profit of an associate |
19 | 92 | (262 | ) | ||||||||
|
|
|
|
|||||||||
Profit before tax |
96,279 | 54,714 | ||||||||||
Income taxes |
14 | 17,682 | 16,007 | |||||||||
|
|
|
|
|||||||||
Net Profit |
78,597 | 38,707 | ||||||||||
|
|
|
|
|||||||||
Net Profit attributable to: |
||||||||||||
Equity holders of the parent |
78,513 | 39,201 | ||||||||||
Non-controlling interests |
37 | 84 | (494 | ) | ||||||||
|
|
|
|
|||||||||
78,597 | 38,707 | |||||||||||
|
|
|
|
|||||||||
Earnings per share |
||||||||||||
Basic earnings per common share (in EUR) |
15 | 0.33 | 0.16 | |||||||||
Diluted earnings per common share (in EUR) |
15 | 0.33 | 0.16 |
The accompanying notes are an integral part of the Consolidated Financial Statements
F-3
Stevanato Group S.p.A.
Consolidated statements of comprehensive income
for the years ended December 31, 2020 and 2019
For the years ended December 31, |
||||||||||||
Notes | 2020 | 2019 | ||||||||||
(EUR thousand) | ||||||||||||
Net Profit |
78,597 | 38,707 | ||||||||||
Gains/(losses) from remeasurement of employee defined benefit plans |
31 | (145 | ) | (377 | ) | |||||||
Gains/(losses) from remeasurement of the agent termination plan |
32 | (22 | ) | (29 | ) | |||||||
Tax effect relating to those components of OCI |
14 | 15 | 86 | |||||||||
|
|
|
|
|||||||||
Other comprehensive income/(loss) that will not be classified subsequently to profit or loss |
(152 | ) | (320 | ) | ||||||||
|
|
|
|
|||||||||
Exchange difference on translation of foreign operations |
27 | (22,589 | ) | 2,535 | ||||||||
Changes in the fair value of cash flow hedging instruments |
40 | (722 | ) | (900 | ) | |||||||
Tax effect relating to that components of OCI |
14 | 173 | 216 | |||||||||
|
|
|
|
|||||||||
Other comprehensive income/(loss) that will be classified subsequently to |
(23,139 | ) | 1,851 | |||||||||
|
|
|
|
|||||||||
Total other comprehensive income/(loss), net of tax |
(23,291 | ) | 1,531 | |||||||||
|
|
|
|
|||||||||
Total Comprehensive Income |
55,307 | 40,238 | ||||||||||
|
|
|
|
|||||||||
Attributable to: |
||||||||||||
Equity holders of the parent |
55,232 | 40,720 | ||||||||||
Non-controlling interests |
75 | (482 | ) | |||||||||
|
|
|
|
|||||||||
55,307 | 40,238 | |||||||||||
|
|
|
|
The accompanying notes are an integral part of the Consolidated Financial Statements
F-4
Stevanato Group S.p.A.
Consolidated statements of financial position
at December 31, 2020, 2019 and January 1, 2019
Notes | At December 31, 2020 |
At December 31, 2019 |
At January 1, 2019 |
|||||||||||
(EUR thousand) | ||||||||||||||
Assets |
||||||||||||||
Non-current assets |
||||||||||||||
Goodwill |
16 | 47,243 | 47,243 | 47,243 | ||||||||||
Other intangible assets |
17 | 33,901 | 34,823 | 34,510 | ||||||||||
Right of Use assets |
36 | 25,380 | 26,339 | 20,804 | ||||||||||
Property, plant and equipment |
18 | 313,658 | 280,587 | 245,627 | ||||||||||
Investments in an associate |
19 | 2,009 | 1,917 | 2,179 | ||||||||||
Financial assetsinvestments FVTPL |
20 | 760 | 1,978 | 1,957 | ||||||||||
Other non current financial assets |
21 | 6,701 | 6,610 | 5,979 | ||||||||||
Deferred tax assets |
14 | 45,552 | 33,098 | 28,396 | ||||||||||
|
|
|
|
|
|
|||||||||
475,204 | 432,595 | 386,694 | ||||||||||||
Current assets |
||||||||||||||
Inventories |
22 | 139,373 | 131,882 | 98,611 | ||||||||||
Contract assets |
23 | 39,430 | 32,536 | 24,420 | ||||||||||
Trade receivables |
23 | 127,818 | 128,042 | 131,223 | ||||||||||
Other current financial assets |
21 | 41,543 | 41,306 | 40,337 | ||||||||||
Tax receivables |
24 | 25,033 | 26,356 | 20,695 | ||||||||||
Other receivables |
25 | 3,979 | 4,075 | 5,080 | ||||||||||
Cash and cash equivalents |
26 | 115,599 | 85,386 | 74,519 | ||||||||||
|
|
|
|
|
|
|||||||||
492,775 | 449,584 | 394,885 | ||||||||||||
|
|
|
|
|
|
|||||||||
Total assets |
967,979 | 882,179 | 781,580 | |||||||||||
|
|
|
|
|
|
|||||||||
Equity and liabilities |
||||||||||||||
Equity |
||||||||||||||
Share capital |
27 | 20,002 | 20,002 | 20,002 | ||||||||||
Reserves and Retained Earnings |
27 | 211,979 | 206,287 | 170,152 | ||||||||||
Net profit attributable to equity holders of the parent |
27 | 78,513 | 39,201 | 41,409 | ||||||||||
|
|
|
|
|
|
|||||||||
Equity attributable to equity holders of the parent |
310,495 | 265,489 | 231,563 | |||||||||||
Non-controlling interests |
37 | (355 | ) | (50 | ) | (166 | ) | |||||||
|
|
|
|
|
|
|||||||||
Total equity |
310,140 | 265,439 | 231,397 | |||||||||||
|
|
|
|
|
|
|||||||||
Non-current liabilities |
||||||||||||||
Non-current financial liabilities |
29, 36 | 294,124 | 312,139 | 267,692 | ||||||||||
Employees Benefits |
31 | 29,725 | 26,545 | 24,512 | ||||||||||
Provisions |
32 | 4,384 | 3,946 | 3,060 | ||||||||||
Deferred tax liabilities |
14 | 11,623 | 10,429 | 10,890 | ||||||||||
Other non-current liabilities |
33 | 1,808 | 739 | 125 | ||||||||||
|
|
|
|
|
|
|||||||||
341,664 | 353,798 | 306,278 | ||||||||||||
Current liabilities |
||||||||||||||
Current financial liabilities |
29, 36 | 81,234 | 73,917 | 57,904 | ||||||||||
Trade payables |
34 | 118,740 | 95,051 | 91,772 | ||||||||||
Contract Liabilites |
35 | 5,031 | 5,623 | 7,851 | ||||||||||
Advances from customers |
35 | 48,361 | 41,892 | 37,901 | ||||||||||
Tax payables |
24 | 19,126 | 5,692 | 13,086 | ||||||||||
Other liabilities |
34 | 43,683 | 40,766 | 35,391 | ||||||||||
|
|
|
|
|
|
|||||||||
316,175 | 262,942 | 243,905 | ||||||||||||
|
|
|
|
|
|
|||||||||
Total liabilities |
657,839 | 616,739 | 550,183 | |||||||||||
|
|
|
|
|
|
|||||||||
Total equity and liabilities |
967,979 | 882,179 | 781,580 | |||||||||||
|
|
|
|
|
|
The accompanying notes are an integral part of the Consolidated Financial Statements
F-5
Stevanato Group S.p.A.
Consolidated statements of changes in equity
for the years ended December 31, 2020 and 2019
Notes | Share capital | Treasury shares |
Cash flow hedge reserve |
Reserve for actuarial gains / (losses) on employee benefits |
Foreign currency translation reserve |
Retained earnings and other reserve |
Equity attributable to equity holders of the parent |
Non- controlling interests |
Total equity |
|||||||||||||||||||||||||||||
(EUR thousand) | ||||||||||||||||||||||||||||||||||||||
At January 1, 2020 |
20,002 | (26,189 | ) | (2,796 | ) | (523 | ) | (12,331 | ) | 287,327 | 265,490 | (50 | ) | 265,439 | ||||||||||||||||||||||||
Other comprehensive income |
27, 40 | | | (549 | ) | (152 | ) | (22,580 | ) | | (23,281 | ) | (9 | ) | (23,290 | ) | ||||||||||||||||||||||
Net profit |
| | | | | 78,513 | 78,513 | 84 | 78,597 | |||||||||||||||||||||||||||||
|
|
|
|
|
|
|
|
|
|
|
|
|
|
|
|
|
|
|||||||||||||||||||||
Total comprehensive income |
| | (549 | ) | (152 | ) | (22,580 | ) | 78,513 | 55,232 | 75 | 55,307 | ||||||||||||||||||||||||||
Dividends |
28 | | | | | | (8,900 | ) | (8,900 | ) | | (8,900 | ) | |||||||||||||||||||||||||
Acquisition of non-controlling interests |
37 | | | | | | (1,381 | ) | (1,381 | ) | (379 | ) | (1,760 | ) | ||||||||||||||||||||||||
Other |
| | | | | 54 | 54 | | 54 | |||||||||||||||||||||||||||||
|
|
|
|
|
|
|
|
|
|
|
|
|
|
|
|
|
|
|||||||||||||||||||||
Total effects |
| | | | | (10,227 | ) | (10,227 | ) | (379 | ) | (10,606 | ) | |||||||||||||||||||||||||
|
|
|
|
|
|
|
|
|
|
|
|
|
|
|
|
|
|
|||||||||||||||||||||
At December 31, 2020 |
20,002 | (26,189 | ) | (3,345 | ) | (675 | ) | (34,911 | ) | 355,614 | 310,495 | (355 | ) | 310,140 | ||||||||||||||||||||||||
|
|
|
|
|
|
|
|
|
|
|
|
|
|
|
|
|
|
Notes | Share capital | Treasury shares |
Cash flow hedge reserve |
Reserve for actuarial gains / (losses) on employee benefits |
Foreign currency translation reserve |
Retained earnings and other reserve |
Equity attributable to equity holders of the parent |
Non- controlling interests |
Total equity |
|||||||||||||||||||||||||||||
(EUR thousand) | ||||||||||||||||||||||||||||||||||||||
At January 1, 2019 |
20,002 | (26,189 | ) | (2,112 | ) | (203 | ) | (14,853 | ) | 254,919 | 231,563 | (166 | ) | 231,397 | ||||||||||||||||||||||||
Other comprehensive income |
27, 40 | | | (684 | ) | (320 | ) | 2,523 | | 1,519 | 13 | 1,531 | ||||||||||||||||||||||||||
Net profit |
| | | | | 39,201 | 39,201 | (494 | ) | 38,707 | ||||||||||||||||||||||||||||
|
|
|
|
|
|
|
|
|
|
|
|
|
|
|
|
|
|
|||||||||||||||||||||
Total comprehensive income |
| | (684 | ) | (320 | ) | 2,523 | 39,201 | 40,720 | (482 | ) | 40,238 | ||||||||||||||||||||||||||
Dividends |
28 | | | | | | (6,170 | ) | (6,170 | ) | | (6,170 | ) | |||||||||||||||||||||||||
Change in the consolidated group |
37 | | | | | | (621 | ) | (621 | ) | 597 | (24 | ) | |||||||||||||||||||||||||
Other |
| | | | | (2 | ) | (2 | ) | | (2 | ) | ||||||||||||||||||||||||||
|
|
|
|
|
|
|
|
|
|
|
|
|
|
|
|
|
|
|||||||||||||||||||||
Total effects |
| | | | | (6,793 | ) | (6,793 | ) | 597 | (6,196 | ) | ||||||||||||||||||||||||||
|
|
|
|
|
|
|
|
|
|
|
|
|
|
|
|
|
|
|||||||||||||||||||||
At December 31, 2019 |
20,002 | (26,189 | ) | (2,796 | ) | (523 | ) | (12,331 | ) | 287,327 | 265,490 | (50 | ) | 265,439 | ||||||||||||||||||||||||
|
|
|
|
|
|
|
|
|
|
|
|
|
|
|
|
|
|
The accompanying notes are an integral part of the Consolidated Financial Statements
F-6
Stevanato Group S.p.A.
Consolidated statement of cash flows
for the years ended December 31, 2020 and 2019
For the years ended December 31, |
||||||||||||
Notes | 2020 | 2019 | ||||||||||
(EUR thousand) | ||||||||||||
Cash Flow from Operating activities |
||||||||||||
Profit before tax |
96,279 | 54,714 | ||||||||||
Adjustments: |
||||||||||||
Depreciation of property, plant and equipment |
10 | 41,363 | 35,719 | |||||||||
Amortization of intangible assets and Right of Use |
10 | 12,740 | 10,498 | |||||||||
Allowance for doubtful accounts |
23 | 341 | 3,506 | |||||||||
Net finance expense |
4,885 | 4,660 | ||||||||||
Change in other provisions and in employee benefits |
(9,072 | ) | (8,759 | ) | ||||||||
Other non-cash expenses, net |
(388 | ) | 470 | |||||||||
Working capital changes: |
||||||||||||
inventories and contract assets |
(15,603 | ) | (42,674 | ) | ||||||||
trade receivables and other assets |
(3,631 | ) | 5,867 | |||||||||
trade payables, contract liabilities, advances and other liabilites |
52,412 | 11,835 | ||||||||||
Interest paid |
(5,368 | ) | (4,711 | ) | ||||||||
Interest received |
684 | 635 | ||||||||||
Income tax paid |
(18,986 | ) | (29,188 | ) | ||||||||
|
|
|
|
|||||||||
Total |
155,656 | 42,572 | ||||||||||
|
|
|
|
|||||||||
Cash Flow used in investing activities |
||||||||||||
Purchase of property, plant and equipment |
(89,565 | ) | (68,092 | ) | ||||||||
Proceeds from sale of property plant and equipment |
15 | 199 | ||||||||||
Purchase of intangible assets |
(6,439 | ) | (5,814 | ) | ||||||||
Investment in financial assets |
(100 | ) | (631 | ) | ||||||||
|
|
|
|
|||||||||
Total |
(96,089 | ) | (74,338 | ) | ||||||||
|
|
|
|
|||||||||
Cash Flow from / (used in) financing activities |
||||||||||||
Acquisition of non-controlling interests |
37 | (539 | ) | | ||||||||
Dividends paid |
28 | (8,900 | ) | (6,170 | ) | |||||||
Payment of principal portion of lease liabilities |
(5,906 | ) | (4,741 | ) | ||||||||
Proceed from loans |
51,911 | 102,251 | ||||||||||
Repayments of loans |
(63,083 | ) | (49,170 | ) | ||||||||
|
|
|
|
|||||||||
Total |
(26,517 | ) | 42,170 | |||||||||
|
|
|
|
|||||||||
Net change in cash and cash equivalents |
33,050 | 10,404 | ||||||||||
Net foreign exchange difference |
(2,837 | ) | 463 | |||||||||
Cash and cash equivalents at January 1 |
85,386 | 74,519 | ||||||||||
|
|
|
|
|||||||||
Cash and cash equivalents at December 31 |
115,599 | 85,386 | ||||||||||
|
|
|
|
The accompanying notes are an integral part of the Consolidated Financial Statements
F-7
Notes to the consolidated financial statements
1. Corporate information
Stevanato Group S.p.A. (herein referred to as the Company and together with its subsidiaries the Group) is headquartered in Italy and its registered office is located in via Molinella 17, Piombino Dese (Padova, Italy). The Group is active in the design, production and distribution of products and processes to provide integrated solutions for pharma and healthcare, leveraging on constant investment and the acquisition of skills of new technologies that has brought to become a global player in the pharma industry. Principal products are linked to containment solutions, drug delivery systems, medical devices, diagnostic, analytical services, visual inspection machines, assembling and packaging machines, glass forming machines.
The Group has nine production plants for manufacturing and assembly of pharma and healthcare products (in Italy, Germany, Slovakia, United States, Mexico, China), five plants for the production of machinery and equipment (in Italy and Denmark), two sites for analytical services (in Italy and United States) and two commercial offices (in Japan and the United States). The global footprint allows to sell products and provide services in more than 70 countries worldwide.
Stevanato Group S.p.A. is controlled by Stevanato Holding S.r.l. which holds 88.28% of its share capital.
2. Significant accounting policies
2.1 Basis of preparation
The consolidated financial statements comprised the financial statements of the Company and its subsidiaries as at December 31, 2020 and 2019, and January 1, 2019 and for the years ended December 31, 2020 and 2019. The consolidated financial statements were authorized for issuance by resolution of the Board of Directors on April 7, 2021.
The consolidated financial statements of the Group have been prepared in accordance with the International Financial Reporting Standards as issued by the International Accounting Standards Board (IFRS). For all periods up to and including the year ended December 31, 2019, the Group prepared its financial statements in accordance with Italian generally accepted accounting principles (Local GAAP).
The accounting policies stated below have, unless otherwise stated, been applied consistently over all periods presented in the consolidated financial statements. The Groups accounting policies have been applied consistently by the Groups companies. Refer to Note 2.4 for information on how the Group adopted IFRS.
The consolidated financial statements are composed of a consolidated income statement, a consolidated statement of comprehensive income, a consolidated statement of financial position, a consolidated statement of changes in equity, a consolidated statement of cash flows and the accompanying notes (the Consolidated Financial Statements).
The Group presents its consolidated statement of profit or loss using the function of expense method reflecting the practice in the industry in which the Group operates. The Group presents current and non-current assets and liabilities as separate classifications in its consolidated statements of financial position. The statement of cash flows has been prepared using the indirect method allowed by IAS 7Cash Flow statements. In the consolidated income statement, the Group also presents subtotal for Gross Profit and Operating Profit. Operating Profit distinguishes between the profit before taxes arising from operating items and those arising from financing activities, including also the share of profit of associates. Operating Profit is one of the primary measures used by the Chief Executive Officer, the Groups Chief Operating Decision Maker (CODM) as defined in IFRS 8Operating Segments to assess performance.
The consolidated financial statements have been prepared on a historical cost basis, modified as required for the measurement of certain financial instruments at their fair value.
F-8
The consolidated financial statements are presented in Euro, the Groups presentation currency, which is also the functional currency of the Company, and all values are rounded to the nearest thousand, except when otherwise indicated.
The consolidated financial statements are prepared on a going concern basis. Management believes that there are no financial or other indicators presenting material uncertainties that may cast significant doubt upon the Groups ability to meet its obligations in the foreseeable future and in particular in the next 12 months.
2.2 Basis of consolidation
Subsidiaries
Subsidiaries are any entities over which the Group has control. The Group controls an entity when the Group is exposed to, or has the rights to, variable returns from its involvement with the entity and has the ability to affect those returns through its power over the entity. Power is generally presumed with an ownership of more than one-half of the voting rights. The existence and effect of potential voting rights that are currently exercisable or convertible are considered when assessing whether the Group controls another entity. The Group re-assesses whether or not it controls an investee if facts and circumstances indicate that there are changes to one or more of the three elements of control.
The Group recognizes any non-controlling interests (NCI) at fair value or at the non-controlling interests share of the recognized amounts of the acquirees identifiable net assets. Net profit or loss and each component of other comprehensive income/ (loss) are attributed to the owners of the parent and to the non-controlling interests. Total comprehensive income/ (loss) of subsidiaries is attributed to owners of the parent and to the non-controlling interests even if this results in the non-controlling interests having a deficit balance.
Subsidiaries are fully consolidated from the date on which control is obtained by the Group. If the Group loses control over a subsidiary, it derecognizes the related assets (including goodwill), liabilities, non-controlling interest and other components of equity, while any resultant gain or loss is recognized in profit or loss. Any investment retained is recognized at fair value.
Associates
These are companies in which the Group has a significant influence over their financial and operating policies and which are neither subsidiaries nor joint ventures. The consolidated financial statements show the Groups portion of results of the associated companies, accounted for using the equity method, starting from the date when the significant influence began. Under the equity method, the investments are initially recognized at cost and adjusted thereafter to recognize the Groups share of the profit/ (loss) and other comprehensive income/ (loss) of the investee. The Groups share of the investees profit/ (loss) is recognized in the consolidated income statement.
Consolidation of foreign companies
All the assets and liabilities of foreign companies that report in a currency other than the Euro and which fall within the scope of consolidation are translated into Euros using the exchange rate at the end of the reporting period (current exchange rate method). Income and costs are translated using average rates for the reporting period. The exchange differences arising on translation for consolidation are recognized in OCI. On disposal of a foreign operation, the component of OCI relating to that particular foreign operation is reclassified to profit or loss.
Transactions eliminated upon consolidation
All transactions and balances between Group companies and all unrealized gains and losses arising on intercompany transactions are eliminated on consolidation.
F-9
Transactions in foreign currency
Transactions in foreign currencies are initially recorded by the Groups entities at their respective functional currency spot rates at the date the transaction first qualifies for recognition. Monetary assets and liabilities in foreign currency are translated using the exchange rate ruling on the reporting date. Exchange differences arising on the extinguishment of monetary items or their translation at different rates to those used for their translation upon initial recognition or in previous financial statements are recorded in the income statement. Exchange differences arising on monetary items that are effectively part of the Groups net investment in foreign operations are classified in net equity until the investments disposal, at which time such differences are recognized in the income statement as income or expenses.
The principal foreign currency exchange rates used to translate other currencies into Euro were as follows:
COUNTRY |
ISO CODE |
Average for the year ended December 31, 2020 |
At December 31, 2020 |
Average for the year ended December 31, 2019 |
At December 31, 2019 |
|||||||||||||
CHINA |
CNY | 7.8747 | 8.0225 | 7.7355 | 7.8205 | |||||||||||||
UNITED STATES |
USD | 1.1422 | 1.2271 | 1.1195 | 1.1234 | |||||||||||||
MEXICO |
MXN | 24.5194 | 24.4160 | 21.5565 | 21.2202 | |||||||||||||
DENMARK |
DKK | 7.4542 | 7.4409 | 7.4661 | 7.4715 | |||||||||||||
BRAZIL |
BRL | 5.8943 | 6.3735 | 4.4134 | 4.5157 | |||||||||||||
SWITZERLAND |
CHF | 1.0705 | 1.0802 | 1.1124 | 1.0854 | |||||||||||||
JAPAN |
JPY | 121.8458 | 126.4900 | 122.0100 | 121.9400 |
2.3 Main accounting policies, estimates and assumptions
Current and non-current
The Group in its consolidated statements of financial position presents assets and liabilities as separate classifications in current and non-current.
An asset is current when it is: (i) expected to be realized or intended to be sold or consumed in the normal operating cycle; (ii) held primarily for the purpose of trading; (iii) expected to be realized within twelve months after the reporting period or (iv) cash or cash equivalent. All other assets are classified as non-current.
A liability is current when it is: (i) expected to be settled in the normal operating cycle, (ii) held primarily for the purpose of trading; (iii) due to be settled within twelve months after the reporting period or (iv) there is no unconditional right to defer the settlement of the liability for at least twelve months after the reporting period. The terms of the liability that could, at the option of the counterparty, result in its settlement by the issue of equity instruments do not affect its classification. The Group classifies all other liabilities as non-current. Deferred tax assets and liabilities are classified as non-current assets and liabilities.
Goodwill
Goodwill is initially measured at cost (being the excess of the aggregate of the consideration transferred and the amount recognized for non-controlling interests and any previous interest held over the net identifiable assets acquired and liabilities assumed in a business combination).
After initial recognition, goodwill is measured at cost less any accumulated impairment losses. For the purpose of impairment testing, that is performed at least annually, goodwill acquired in a business combination is, from the acquisition date, allocated to each of the Groups cash-generating units that are expected to benefit from the combination.
F-10
Impairment test consists in the comparison of the recoverable amount of each CGU, over which goodwill has been allocated for monitoring purposes, with their corresponding carrying amount of net assets including goodwill. The recoverable amount is the higher of an assets fair value less costs to sell and its value in use. The fair value less costs to sell is the price that would be received from the sale of an asset or group of assets in an orderly transaction between market participants at the measurement date, less costs to sell. These values are determined on the basis of market data (stock market prices or comparison with similar listed companies, with the value attributed to similar assets or companies in recent transactions) or, in the absence of such data, on the basis of discontinued cash flows as determined by a market participant. The value in use is based on discounted future cash flows net of income taxes, calculated as follows:
| future cash flows are estimated based on actual cash flows for the current year, the annual budget for the following year and mid-term projections based on previous years cash flows, management expectations and plans, and past experience; subsequent years are extrapolated with a perpetuity growth rate; |
| the Group discount rate is determined on the basis of market information on the cost of capital and the specific risk of the industry (Weighted Average Cost of Capital, WACC). |
These procedures are in accordance with IAS 36Impairment of assets, an impairment loss is recognized if the recoverable amount is lower than the carrying amount. An impairment loss recognized for goodwill cannot be reversed in a subsequent period.
Where goodwill has been allocated to a cash-generating unit (CGU) and part of the operation within that unit is disposed of, the goodwill associated with the disposed operation is included in the carrying amount of the operation when determining the gain or loss on disposal. Goodwill disposed in these circumstances is measured based on the relative values of the disposed operation and the portion of the cash-generating unit retained.
Fair Value Measurement
In accordance with IFRS 13Fair Value Measurement, the Group measures financial instruments such as derivatives, and non-financial assets, at fair value at each balance sheet date. Fair value is the price that would be received to sell an asset or paid to transfer a liability in an orderly transaction between market participants at the measurement date. The fair value measurement is based on the presumption that the transaction to sell the asset or transfer the liability takes place in the principal market or, in the absence of a principal market, in the most advantageous market for the asset or liability.
The Group uses valuation techniques that are appropriate in the circumstances and for which sufficient data are available to measure fair value, maximizing the use of relevant observable inputs and minimizing the use of unobservable inputs. All assets and liabilities for which fair value is measured or disclosed in the financial statements are categorized within the fair value hierarchy, described as follows, based on the lowest level input that is significant to the fair value measurement as a whole:
| Level 1Quoted (unadjusted) market prices in active markets for identical assets or liabilities; |
| Level 2Valuation techniques for which the lowest level input that is significant to the fair value measurement is directly or indirectly observable; |
| Level 3Valuation techniques for which the lowest level input that is significant to the fair value measurement is unobservable. |
Recognition of revenues
The Group is in the business of production and distribution of products and processes to provide integrated solutions for pharma and healthcare. Revenue from contracts with customers is recognized when control of the
F-11
goods or services are transferred to the customer at an amount that reflects the consideration to which the Group expects to be entitled in exchange for those goods or services. The Group has generally concluded that it is the principal in its revenue arrangements because it typically controls the goods or services before transferring them to the customer.
The Group considers whether there are other promises in the contract that are separate performance obligations to which a portion of the transaction price needs to be allocated.
Based on the five-step model introduced in IFRS 15Revenue from contracts with customers, the Company recognizes revenue after the following requirements have been met:
a) | the parties have approved the contract (in writing, orally or in accordance with other common commercial practices) and are committed to fulfilling the respective performance obligations; an agreement between the parties which creates rights and obligations regardless of the form of the agreement has, therefore, been created; |
b) | the rights of each of the parties in relation to the services to be transferred can be identified; |
c) | the payment terms for the goods or services to be transferred can be identified; |
d) | the contract has commercial substance; |
e) | it is probable that the Company will receive the consideration to which it is entitled in exchange for the services transferred to the customer. If the consideration referred to in the contract has a variable component, the Company will estimate the amount of the consideration it will be entitled to in exchange for the services transferred to the customer. |
Revenues from sale of Biopharmaceutical and Diagnostic Solution segment
Revenue from sale of Biopharmaceutical and Diagnostic Solution segment is mainly recognized at the point in time when control of the asset is transferred to the customer, generally on delivery of the products at the customers location and generally considering applicable Incoterms.
The normal credit term is 60 to 90 days upon delivery.
The Group enters in certain contracts whereby it provides customer with the right to access certain intellectual properties for a defined short period of time. These contracts do not result in additional performance obligations for the Group and have been assessed to result in revenue to be recognized over the time the customer can benefit from the access to the intellectual property.
In determining the transaction price for the sale of glass and plastic products, both part of the Biopharmaceutical and Diagnostic Solution segment, the Group considers the effects of variable consideration, existence of a significant financing component, noncash consideration, and consideration payable to the customer. If the consideration in a contract includes a variable amount, the Group estimates the amount of consideration to which it will be entitled in exchange for transferring the goods to the customer. The variable consideration is estimated at contract inception and constrained until it is highly probable that a significant revenue reversal in the amount of cumulative revenue recognized will not occur when the associated uncertainty with the variable consideration is subsequently resolved. The Group estimates the impact of potential returns from customers based on the Groups right of return policies and practices along with historical data on returns, in order to determine the amount of variable consideration that can be included in the transaction price and recognized as revenue. A refund liability is recognized for the goods that are expected to be returned. There are no post-delivery obligations other than product warranties, if required by local law; these warranties do not
F-12
represent a separate performance obligation and are accounted for applying IAS 37Provisions, Contingent Liabilities and Contingent Assets. Any advance payments or deposits from customers are not recognized as revenue until the control of the relevant good is transferred to the customer.
Biopharmaceutical and Diagnostic Solution segment also develops, contracts for and sells to customers molds, tools and equipment necessary to produce plastic products. If the tooling is highly customized with no alternative use to the Group, and the Group has an enforceable right to payment for performance completed to date, revenue is recognized over time by measuring progress towards completion using the input method based on costs incurred relative to total estimated costs to completion consistently with transfer of control. Otherwise, revenue for the molds, tools and equipment is recognized at the point in time when the performance obligations are satisfied by transferring of control.
Revenue from sale of Engineering segment
Revenue from sale of Engineering segment is recognized at the point in time or over the time, accordingly to terms and conditions of the customers contract.
The Group recognizes revenues from customer-specific construction contracts of the engineering system division over the time as the performance does not create an asset with an alternative use and the Group has an enforceable right to payment for performance completed to date. When it is not possible to consider the enforceable right to payment for performance completed to date, revenue is recognized at a point in time.
For revenue recognized over time, revenue is recognized by applying a method of measuring progress toward complete satisfaction of the related performance obligation. When selecting the method for measuring progress, the Group select the method that best depicts the transfer of control of goods or services promised to customers. Engineering revenue is recorded under an input method, which recognizes revenue on the basis of efforts or inputs to the satisfaction of a performance obligation (for example, resources consumed, labor hours expended, costs incurred, time elapsed, or machine hours used) relative to the total expected inputs to the satisfaction of that performance obligation. The input method that we use is based on costs incurred, using the percentage of completion method (or expected cost plus a margin approach). The Group determines the applicable stage of completion based on the portion of contract costs incurred for work performed to date relative to the estimated total contract costs (cost to cost method).
Engineering revenue can be generated from contracts with multiple performance obligations. When a sales agreement involves multiple performance obligations, each obligation is separately identified, and the transaction price is allocated based on the amount of consideration the Group expect to be entitled in exchange for transferring the promised good or service to the customer.
If the stage of completion of a customer-specific contract cannot be estimated reliably, contract revenue is recognized to the extent of contract costs incurred that are likely to be recoverable.
Engineerings revenues also include after-sales services, those mainly consists in the supply of spare parts to customers for machinery and equipment sold, other than maintenance activity on the machines sold. Such revenues is recognized at a point in time.
Contract costs are recognized in profit or loss as incurred unless they create an asset which generates or enhances resources that will be used in satisfying (or in continuing to satisfy) performance obligations in the future. When it is probable that total contract costs will exceed total contract revenue, the expected loss is recognized as an expense immediately in the consolidated income statement following requirements on onerous contracts in IAS 37.
F-13
Trade receivables
A receivable is the entitys right to consideration that is unconditional. A right to consideration is unconditional if the passage of time is required before payment of that consideration is due.
Contract assets
The entitys right to consideration in exchange for goods or services that the entity has transferred to a customer when that right is conditioned on something other than the passage of time.
Contract liabilities
A contract liability is the entitys obligation to transfer goods or services to a customer for which the entity has received consideration.
Presentation of Contract assets and liabilities
Contract assets and liabilities are determined at the contract level and not at the performance obligation level. As such, an asset or liability for each performance obligation within a contract is not separately recognized, but they are aggregated into a single contract asset or liability. Contract asset or contract liability positions are determined for each contract on a net basis.
Cost of sales
Cost of sales comprises expenses incurred in the manufacturing and distribution of products. The remaining costs principally include depreciation, amortization and transportation costs.
Income (and deferred) taxes
Income taxes include all the taxes calculated on taxable profits of the Group. Income taxes are recorded in the income statement, except to the extent that they relate to a business combination, or items recognized directly in equity or in other comprehensive income.
Current taxes are calculated on the basis of the tax laws enacted or substantially enacted at the reporting date in the countries where the Group operates and generates taxable income. Current tax receivables and payables are measured at the amount expected to be recovered or paid to the tax authorities.
Italian Regional Income Tax (IRAP) is recognized within income tax expense. IRAP is calculated on a measure of income defined by the Italian Civil Code as the difference between operating revenues and costs, before financial income and expense, and in particular before the cost of fixed-term employees, credit losses and any interest included in lease payments, for the Italian components of the Group only. IRAP is applied on the tax base at 3.9% for the years ended December 31, 2019 and December 31, 2020.
Deferred tax is provided using the liability method on temporary differences between the tax bases of assets and liabilities and their carrying amounts for financial reporting purposes at the reporting date.
Deferred tax liabilities are recognized for all taxable temporary differences, except:
| When the deferred tax liability arises from the initial recognition of goodwill or an asset or liability in a transaction that is not a business combination and, at the time of the transaction, affects neither the accounting profit nor taxable profit or loss; |
| In respect of taxable temporary differences associated with investments in subsidiaries, associates and interests in joint arrangements, when the timing of the reversal of the temporary differences can be controlled and it is probable that the temporary differences will not reverse in the foreseeable future. |
F-14
Deferred tax assets are recognized for all deductible temporary differences, the carry forward of unused tax credits and any unused tax losses. Deferred tax assets are recognized to the extent that it is probable that taxable profit will be available against which the deductible temporary differences, and the carry forward of unused tax credits and unused tax losses can be utilized, except:
| When the deferred tax asset relating to the deductible temporary difference arises from the initial recognition of an asset or liability in a transaction that is not a business combination and, at the time of the transaction, affects neither the accounting profit nor taxable profit or loss. |
| In respect of deductible temporary differences associated with investments in subsidiaries, and associates, deferred tax assets are recognized only to the extent that it is probable that the temporary differences will reverse in the foreseeable future and taxable profit will be available, against which the temporary differences can be utilized. |
The carrying amount of deferred tax assets is reviewed at each reporting date and reduced to the extent that it is no longer probable that sufficient taxable profit will be available to allow all or part of the deferred tax asset to be utilized. Unrecognized deferred tax assets are re-assessed at each reporting date and are recognized to the extent that it has become probable that future taxable profits will allow the deferred tax asset to be recovered.
Deferred tax assets and liabilities are measured at the tax rates that are expected to apply to the period when the asset is realized or the liability is settled, based on tax rates (and tax laws) that have been enacted or substantively enacted at the reporting date.
In assessing the feasibility of the realization of deferred tax assets, management considers whether it is probable that some portion or all of the deferred tax assets will not be realized. The ultimate realization of deferred tax assets is dependent upon the generation of future taxable income during the periods in which those temporary differences become deductible and the tax loss carried-forwards are utilized. Estimating future taxable income requires estimates about matters that are inherently uncertain and requires significant management judgment, and different estimates can have a significant impact on the outcome of the analysis.
Changes in the assumptions and estimates related to future taxable income, tax planning strategies and scheduled reversal of deferred tax liabilities could affect the recoverability of the deferred tax assets. If actual results differ from such estimates and assumptions the Group financial position and results of operation may be affected.
Deferred tax relating to items recognized outside profit or loss is recognized outside profit or loss. Deferred tax items are recognized in correlation to the underlying transaction either in OCI or directly in equity. The Group offsets deferred tax assets and deferred tax liabilities if and only if it has a legally enforceable right to set off current tax assets and current tax liabilities and the deferred tax assets and deferred tax liabilities relate to income taxes levied by the same taxation authority on either the same taxable entity or different taxable entities which intend either to settle current tax liabilities and assets on a net basis, or to realize the assets and settle the liabilities simultaneously, in each future period in which significant amounts of deferred tax liabilities or assets are expected to be settled or recovered.
Any uncertainty regarding tax treatments is considered in the tax calculation in accordance with the recommendations of IFRIC 23Uncertainty over Income Tax Treatments that requires an entity to consider whether it is probable that a taxation authority will accept an uncertain tax treatment. If the Group concludes that the position is not probable of being accepted, the effect of uncertainty is reflected in the income taxes.
Dividend
The Company recognizes a liability to pay a dividend when the distribution is authorized and the distribution is no longer at the discretion of the Company. As per the corporate laws of Italy, a distribution is authorized when it is approved by the shareholders. A corresponding amount is recognized directly in equity.
F-15
Other intangible assets
Intangible assets, other than goodwill, acquired separately are measured on initial recognition at cost. The cost of intangible assets acquired in a business combination is their fair value at the date of acquisition. Following initial recognition, intangible assets are carried at cost less any accumulated amortization and accumulated impairment losses. Internally generated intangibles, excluding capitalized development costs, are not capitalized and the related expenditure is reflected in profit or loss in the period in which the expenditure is incurred. The useful lives of intangible assets are assessed as either finite or indefinite. Intangible assets with finite lives are amortized over the useful economic life and assessed for impairment whenever there is an indication that the intangible asset may be impaired. The amortization period and method for an intangible asset with a finite useful life are reviewed at the end of each reporting period. Changes in the expected useful life or the expected pattern of consumption of future economic benefits embodied in the asset are considered to modify the amortization period or method and are treated as changes in accounting estimates. The amortization expense on intangible assets with finite lives is recognized in the income statement in the expense category that is consistent with the function of the intangible assets.
Developments costs for the production of new products or parts, like requested as IAS 38Intangible Assets, are recognized as assets only if the costs can be reliably determined; the Group has the intention and resources to complete them, the technical feasibility of completing them is such that they will be available for use; its intention to complete and its ability and intention to use or sell the asset; how the asset will generate future economic benefits; the availability of resources to complete the asset and the ability to measure reliably the expenditure during development. Capitalized development costs include only those expenses that can be directly attributed to the development process and are amortized on a systematic basis, starting from the commencement of production and lasting the length of the product or processs estimated life, generally ranging between three and five years. Research costs are expensed as incurred.
Industrial patents and intellectual property rights, and licenses are valued at purchase or production cost and amortized, if they have a finite life, on a straight-line basis over their estimated useful life, generally between three and five years.
Other intangible assets mainly relate to the registration of trademarks and have been recognized in accordance with IAS 38Intangible Assets, where it is probable that the use of the asset will generate future economic benefits for the Group and where the cost of the asset can be measured reliably. Other intangible assets are measured at cost less any impairment losses and amortized on a straight-line basis over their estimated life, which is generally between three and five years.
The amortization period and the amortization method for an intangible asset with a finite useful life are reviewed at least at the end of each reporting period. Changes in the expected useful life or the expected pattern of consumption of future economic benefits embodied in the asset are considered to modify the amortization period or method, as appropriate, and are treated as changes in accounting estimates.
An intangible asset is derecognized upon disposal (i.e., at the date the recipient obtains control) or when no future economic benefits are expected from its use or disposal. Any gain or loss arising upon derecognition of the asset (calculated as the difference between the net disposal proceeds and the carrying amount of the asset) is included in the statement of profit or loss.
Property, plant and equipment
Plant and equipment are recorded at purchase or production cost and systematically depreciated over their residual useful lives and accumulated impairment losses, if any. The land pertaining to buildings is not depreciated. Such cost includes the cost of replacing part of the plant and equipment and borrowing costs for long-term construction projects if the recognition criteria are met.
F-16
When significant parts of plant and equipment are required to be replaced at intervals, the Group depreciates them separately based on their specific useful lives. Likewise, when a major inspection is performed, its cost is recognized in the carrying amount of the plant and equipment as a replacement if the recognition criteria are satisfied. All other repair and maintenance costs are recognized in profit or loss as incurred. The present value of the expected cost for the decommissioning of an asset after its use is included in the cost of the respective asset if the recognition criteria for a provision are met. Property, plant and equipment transferred from customers are initially measured at fair value at the date on which control is obtained. Construction in progress is stated at cost, net of accumulated impairment losses, if any.
The useful lives, estimated by the Group for its various categories of property, plant and equipment, are as follows:
Biopharmaceutical and Diagnostic Solutions |
Engineering | Holding | ||||
Buildings |
18 to 33 years | 16 years | 33 years | |||
Plant and machinery |
6 to 20 years | 6 to 10 years | 4 years | |||
Industrial and commercial equipment |
5 to 8 years | 8 years | 8 years | |||
Other tangible assets |
5 to 8 years | 5 to 8 years | 5 to 8 years |
Land is not depreciated. The residual values, useful lives and methods of depreciation of property, plant and equipment are reviewed at each financial year end and adjusted prospectively, if appropriate.
An item of property, plant and equipment and any significant part initially recognized is derecognized upon disposal (i.e., at the date the recipient obtains control) or when no future economic benefits are expected from its use or disposal. Any gain or loss arising on derecognition of the asset (calculated as the difference between the net disposal proceeds and the carrying amount of the asset) is included in the statement of profit or loss when the asset is derecognized.
Leases
The Group assesses at contract inception whether a contract is, or contains, a lease. That is, if the contract conveys the right to control the use of an identified asset for a period of time in exchange for consideration.
According to IFRS 16Leases, the Group applies a recognition and measurement approach for each lease, except for short-term leases and leases of low-value assets. The Group applies the short-term lease recognition exemption to its short-term leases (i.e., those leases that have a lease term of 12 months) and applies the lease of low-value assets recognition exemption to leases of that are considered to be low value. Lease payments on short-term leases and leases of low-value assets are recognized as expense on a straight-line basis over the lease term.
The Group recognizes lease liabilities representing obligations to make lease payments and Right of Use assets representing the Right of Use the underlying assets.
The Group recognizes Right of Use assets at the commencement date of the lease and it is measured at cost, less any accumulated depreciation and impairment losses, and adjusted for any remeasurement of lease liabilities. Right of Use assets are measured at cost comprising the following: (i) the amount of the initial measurement of lease liability; (ii) any lease payments made at or before the commencement date less any lease incentives received; (iii) any initial direct costs and, if applicable, (iv) restoration costs. Right of Use assets are depreciated on a straight-line basis over the shorter of the lease term and the estimated useful lives of the assets.
At the commencement date of the lease, the Group recognizes lease liabilities measured at the present value of lease payments to be made over the lease term, of the following: (i) fixed lease payments less any lease incentives receivable, (ii) variable lease payments that are based on an index or a rate and, if applicable, (iii) amounts expected to be payable under residual value guarantees, and (iv) the exercise price of a purchase
F-17
option if the lessee is reasonably certain to exercise that option. Variable lease payments that do not depend on an index or a rate are recognized as expenses in the period in which the event or condition that triggers the payment occurs. Lease payments are discounted using the interest rate implicit in the lease. If that rate cannot be determined, the Groups incremental borrowing rate is used, being the rate that the Group would have to pay to borrow the funds necessary to obtain an asset of similar value in a similar economic environment with similar terms and conditions. Each lease payment is allocated between the principal liability and interest expense. Interest expense is charged to the income statement over the lease period using the effective interest rate method.
Inventories
Inventories of raw materials, semi-finished and finished products are valued at the lower of cost and net realizable value. Inventories are valued at the lower of cost and net realizable value. Costs incurred in bringing each product to its present location and condition are accounted for, as follows:
| Raw materials: purchase cost on weighted average cost |
| Finished goods and work in progress: cost of direct materials and labor and a proportion of manufacturing overheads based on the normal operating capacity but excluding borrowing costs. |
Allowances for obsolete and slow-moving goods are calculated for materials and finished products, taking into account their future expected use and realizable value. Net realizable value is the estimated selling price in the ordinary course of business, less estimated costs of completion and the estimated costs necessary to make the sale.
Financial instruments
A financial instrument is a contract that gives rise to a financial asset of one entity and a financial liability or equity instrument of another entity. Current financial assets include trade receivables, derivative financial instruments, other current financial assets and cash and cash equivalents. Investments and other financial assets include investments accounted for using the equity method and non-current financial assets. Financial liabilities include debt and borrowings from banks, trade payables and other financial liabilities, which mainly include derivative financial instruments.
Financial assets
Financial assets are classified on the basis of the impairment model introduced by IFRS 9Financial instruments, at initial recognition, as subsequently measured at amortized cost, fair value through other comprehensive income (OCI), and fair value through profit or loss. The Group initially measures a financial asset at its fair value plus transaction costs, in the case of a financial asset not at fair value through profit or loss. With the exception of trade receivables that do not contain a significant financing component or for which the Group has applied a simplified approach in calculating ECLs (Expected Credit Loss). Therefore, the Group does not track changes in credit risk, but instead recognizes a loss allowance based on lifetime ECLs at each reporting date, based on its historical credit loss experience, adjusted for forward-looking factors specific to the debtors and the economic environment. The amount of receivables is reported in the statement of financial position net of the relevant bad debt provisions. The impairment losses reported pursuant to IFRS 9 (including reversals of impairment losses or impairment gains) are recognized in the consolidated income statement within the line item Selling and Marketing expenses.
Financial assets are derecognized when the rights to receive cash flows from the instrument have expired and the Group has transferred substantially all risks and rewards of ownership.
Financial assets measured at amortized cost
This category includes financial assets that meet the following requirements: (i) the financial asset is held within a business model whose objective is to hold financial assets to collect their contractual cash flows; and
F-18
(ii) the contractual terms of the financial asset give rise to cash flows that are solely payments of principal and interest on the principal amount outstanding.
Financial assets at amortized cost are subsequently measured using the effective interest (EIR) method and are subject to impairment. Gains and losses are recognized in profit or loss when the asset is derecognized, modified or impaired.
Financial assets at fair value through OCI (debt instruments)
For debt instruments at fair value through OCI, interest income, foreign exchange revaluation and impairment losses or reversals are recognized in the statement of profit or loss and computed in the same manner as for financial assets measured at amortized cost. The remaining fair value changes are recognized in OCI. Upon derecognition, the cumulative fair value change recognized in OCI is recognized in profit or loss.
Financial assets at fair value through consolidated profit or loss (FVTPL)
Financial assets at fair value through profit or loss are carried in the statement of financial position at fair value with net changes in fair value recognized in the statement of profit or loss. This category includes financial assets not classified in any of the previous categories and derivative instruments and equity investments which the Group has not irrevocably elected to classify at fair value through OCI.
Financial liabilities
Financial liabilities are classified, at initial recognition, as financial liabilities at fair value through profit or loss, loans and borrowings, payables, or as derivatives designated as hedging instruments in an effective hedge, as appropriate. All financial liabilities are recognized initially at fair value and, in the case of loans and borrowings and payables, net of directly attributable transaction costs. The Groups financial liabilities include trade and other payables, loans and borrowings including bank overdrafts, and derivative financial instruments.
For purposes of subsequent measurement, financial liabilities are classified in financial liabilities at fair value through profit or loss and financial liabilities at amortized cost (loans and borrowings).
Financial liabilities at fair value through profit or loss include financial liabilities held for trading and financial liabilities designated upon initial recognition as at fair value through profit or loss. The Group has not designated any financial liability as at fair value through profit or loss.
Financial liabilities at amortized cost is the category most relevant to the Group. After initial recognition, interest-bearing loans and borrowings are subsequently measured at amortized cost using the EIR method. Gains and losses are recognized in profit or loss when the liabilities are derecognized as well as through the EIR amortization process.
Amortized cost is calculated by considering any discount or premium on acquisition and fees or costs that are an integral part of the EIR. The EIR amortization is included as interest expense in the statement of profit or loss.
A financial liability is derecognized when the obligation under the liability is discharged or cancelled or expires. When an existing financial liability is replaced by another from the same lender on substantially different terms, or the terms of an existing liability are substantially modified, such an exchange or modification is treated as the derecognition of the original liability and the recognition of a new liability. The difference in the respective carrying amounts is recognized in the statement.
Borrowings are classified among current liabilities, unless the Group has an unconditional right to defer their payment for at least twelve months after the reporting date.
F-19
Derivative financial instruments are accounted for in accordance with IFRS 9. At the inception of the contract, derivative instruments are initially recognized at fair value as financial assets at FVTPL when the fair value is positive, or financial liabilities at FVTPL when the fair value is negative.
When a derivative financial instrument is designated as a hedge of the exposure to variability in future cash flows or highly probable forecasted transactions, the effective portion of the gain or loss on the hedging instrument is recognized in OCI in the cash flow hedge reserve, while any ineffective portion is recognized immediately in the statement of profit or loss. The Group uses IRS contract (Interest Rate Swap) as hedges of its exposure to financial interest of loans. The cash flow hedge reserve is adjusted to the lower of the cumulative gain or loss on the hedging instrument and the cumulative change in fair value of the hedged item.
The Group uses forward currency and collar contracts as hedges of its exposure to foreign currency risk in forecast transactions and firm commitments, for its exposure to volatility of exchange rates. The ineffective portion is recognized in financial income or expenses.
Impairment of non-financial assets
The Group tests whether there is an indication that an asset may be impaired. If there is evidence of impairment, book value is written down to the related recoverable amount. An assets recoverable amount is the higher of an assets or CGUs fair value less costs of disposal and its value in use. If it is not possible to estimate the recoverable amount of an individual asset, the Group assesses whether the cash-generating unit to which it belongs is impaired. When the carrying amount of an asset or CGU exceeds its recoverable amount, the asset is considered impaired and is written down to its recoverable amount.
For assets excluding goodwill, an assessment is made at each reporting date to determine whether there is an indication that previously recognized impairment losses no longer exist or have decreased. If such indication exists, the Group estimates the assets or CGUs recoverable amount. A previously recognized impairment loss is reversed only if there has been a change in the assumptions used to determine the assets recoverable amount since the last impairment loss was recognized.
Cash and cash equivalents
Cash and cash equivalents in the statement of financial position comprise cash on hand and at bank, carried at nominal amount, equal to fair value. Cash equivalents are short-term, highly liquid investments that are readily convertible to known amounts of cash and which are subject to an insignificant risk of changes in value.
Equity
Retained earnings and other reserves include undistributed earnings of the Group, the accumulated amount of items recognized in other comprehensive income (such as actuarial gains and losses, cash-flow hedge reserves, etc.) and other reserves (translation differences). Dividends are deducted from equity when they are approved by the Shareholders Meeting.
Non-controlling interests represent the portion of the net assets and net profit of a consolidated entity that is not attributable to the Group, directly or indirectly.
Provisions
Provisions for risks are recognized when (i) the Group has a present obligation, legal or constructive, as a result of a past event; (ii) it is probable that the outflow of resources will be required; (iii) the amount of the obligation can be reliably estimated. Provisions are determined by the Group based on facts and circumstances,
F-20
historical risk data and the information available at the balance sheet date. When the Group expects some or all of a provision to be reimbursed, for example, under an insurance contract, the reimbursement is recognized as a separate asset, but only when the reimbursement is virtually certain. Where the effect of the time value of money is material and the date of extinguishing the liability can be reasonably estimated, provisions are stated at the present value of the expected expenditure, using a discount rate that reflects current market assessments of the time value of money and the risks specific to the liability. When discounting is used, the increase in the provision due to the passage of time is recognized as an interest expense. Contingencies for which the probability of a liability is remote are disclosed in the notes, but no provision is recognized.
Employee benefits
Employee severance indemnity, mandatory for Italian companies pursuant to Article 2120 of the Italian Civil Code, is deferred compensation and is based on the employees years of service and the compensation earned by the employee during the service period. Under IAS 19Employee Benefits, the employee severance indemnity as calculated is considered a Defined benefit plan and the related liability recognized in the statement of financial position (Employees Benefits) is determined by actuarial calculations.
The remeasurements of actuarial gains and losses are recognized in other components of the Consolidated Statements of Comprehensive income. Service cost of Italian companies that employ less than 50 employees, as well as interest expenses related to the time value component of the actuarial calculations (the latter classified as Finance expenses), are recognized in the separate consolidated income statements.
Starting from January 1, 2007, Italian Law gave employees the choice to direct their accruing indemnity either to supplementary pension funds or leave the indemnity as an obligation of the Company. Companies that employ at least 50 employees should transfer the employee severance indemnity to the Treasury fund managed by INPS, the Italian Social Security Institute. Consequently, the Groups obligation to INPS and the contributions to supplementary pension funds take the form, under IAS 19, of a Defined contribution plan.
Net interest is calculated by applying the discount rate to the net defined benefit liability or asset. The Group recognizes the following changes in the net defined benefit obligation under expenses in the consolidated statement of profit or loss:
| the service costs are recognized in the consolidated income statement by function and presented in the relevant line items (Cost of sales, Selling and Marketing expenses, General and Administrative expenses, Research and Development expenses); |
| the net interest on the defined benefit liability is recognized in the consolidated income statement as net Financial income/ (expenses), and is determined by multiplying the net liability/ (asset) by the discount rate used to discount obligations taking into account the effect of contributions and benefit payments made during the year; |
| the remeasurement components of the net obligations, which comprise actuarial gains and losses and any change in the effect of the asset ceiling are recognized immediately in other comprehensive income/ (loss). |
Other long-term employee benefit obligations
The Group also has liabilities for cash-settled awards based on Groups performance indicators that are not expected to be settled wholly within 12 months after the end of the period in which the employees and directors render the related service. These obligations are therefore measured as the present value of expected future payments to be made in respect of services provided by employees and directors up to the end of the reporting period, using the projected unit credit method. Expected future payments are discounted using market yields at the end of the reporting period of high-quality corporate bonds with terms and currencies that match, as closely
F-21
as possible, the estimated future cash outflows. Remeasurements as a result of experience adjustments and changes in actuarial assumptions are recognized in profit or loss.
Trade payables and other payables
Trade payables are obligations to pay for goods or services that have been acquired in the ordinary course of business from suppliers. Trade payables are classified as current liabilities if payment is due within one year or less from the reporting date. If not, they are presented as non-current liabilities. Trade payables are initially recognized at fair value and subsequently measured at amortized cost.
Other current and non-current liabilities
Other current and non-current liabilities include, among the others, liabilities related to put options over non-controlling interests and other liabilities related to financial investments.
When a put option is granted to non-controlling shareholders of a subsidiary, if the option provides for settlement in cash, a liability is recognized for the present value of the exercise price of the option. This liability is classified as non-current financial liabilities or current financial liabilities in the consolidated statement of financial position based on its due date. Subsequent changes in the liabilitys fair value are recognized through profit or loss.
The Group recognizes liabilities from other taxes and social security and other non-financial liabilities at amount payable on the maturity date. Pre-payments received on orders as well as the liability balance from constructions contracts are reported as contract liabilities.
Use of estimates
The Consolidated Financial Statements are prepared in accordance with IFRS which require Managements use of estimates and assumptions that may affect the carrying amount of assets, liabilities, income and expenses in the financial statements, as well as the disclosures in the notes concerning contingent assets and liabilities at the balance sheet date. Uncertainty about these assumptions and estimates could result in outcome that require a material adjustments to the carrying amount of assets or liabilities affected in future periods.
Estimates are based on historical experience and other factors. The resulting accounting estimates could differ from the related actual results. Estimates are periodically reviewed and the effects of each change are reflected in the consolidated statement of profit or loss or in the consolidated statement of comprehensive income in the period in which the change occurs.
Revenue Recognition
The Group operates in several jurisdictions and assesses whether contracts with customers provide it with the right to consideration for the performance fulfilled based on legal assessment of applicable contracts and other source of enforceable rights and obligations (i.e., local regulations). As regards revenue from contracts with customers for contract work and contract assets and liabilities, application of the cost-to-cost method requires a prior estimate of the entire lifetime costs of individual projects, updating them at each balance sheet date. This requires assumptions, those can be affected by multiple factors, such as the time over which some projects are developed, their high level of technology and innovative content, the possible presence of price variations and revisions, and machinery performance guarantees, including an estimate of contractual risks, where applicable. These facts and circumstances make it difficult to estimate the projects costs to complete and, consequently, to estimate the value of contract work in progress at the balance sheet date. The Group estimates variable considerations to be included in the transaction price for the sale of products with rights of return and volume rebates. The Group forecasts sales returns using the historical return data to come up with expected return
F-22
percentages. These percentages are applied to determine the expected value of the variable consideration. The Group also receives amounts from third parties that may or may not be collected in a seller-customer relationship. The Group assesses whether these amounts represent consideration for goods or services that have been or will be provided and accordingly identifies the pattern of recognition of revenue.
Recoverable amount of goodwill
The impairment test on goodwill is carried out by comparing the carrying amount of cash-generating units and their recoverable amount. The recoverable amount of a cash-generating unit is the higher of fair value, less costs to sell, and its value in use. This complex valuation process entails the use of methods such as the discounted cash flow method which uses assumptions to estimate cash flows. The recoverable amount depends significantly on the discount rate used in the discounted cash flow model as well as the expected future cash flows and the growth rate used for the extrapolation. The key assumptions used to determine the recoverable amount for the different cash-generating units, including a sensitivity analysis, are detailed in the Note 16;
Development costs
The amortization of development costs requires management to estimate the lifecycle of the related product. Any changes in such assumptions would impact the amortization charge recorded and the carrying amount of capitalized development costs. The periodic amortization charge is derived after determining the expected lifecycle of the related product. Increasing an assets expected lifecycle or its residual value would result in a reduced amortization charge in the consolidated income statement. The useful lives of our development costs are determined by management at the time of capitalization and reviewed annually for appropriateness and recoverability;
Employee benefit liabilities
Employee benefit liabilities: employee benefits, especially the provision for employee severance indemnities and other long term incentives, are calculated using actuarial assumptions; changes in such assumptions could have a material impact on such liabilities;
Leases
The Group cannot readily determine the interest rate implicit in the lease, therefore, it uses its incremental borrowing rate (IBR) to measure lease liabilities. The IBR is the rate of interest that the Group would have to pay to borrow over a similar term, and with a similar security, the funds necessary to obtain an asset of a similar value to the right-of-use asset in a similar economic environment. The IBR therefore reflects what the Group would have to pay, which requires estimation when no observable rates are available (such as for subsidiaries that do not enter into financing transactions) or when they need to be adjusted to reflect the terms and conditions of the lease (for example, when leases are not in the subsidiarys functional currency). The Group estimates the IBR using observable inputs (such as market interest rates) when available and is required to make certain entity-specific estimates (such as the subsidiarys stand-alone credit rating). The Group determines the lease term as the non-cancellable term of the lease, together with any periods covered by an option to extend the lease if it is reasonably certain to be exercised, or any periods covered by an option to terminate the lease, if it is reasonably certain not to be exercised. The Group applies judgment in evaluating whether it is reasonably certain whether or not to exercise the option to renew or terminate the lease. That is, it considers all relevant factors that create an economic incentive for it to exercise either the renewal or termination;
Provision for expected credit losses of trade receivables and contract assets
The Group uses a simplified approach in calculating ECLs for trade receivables and contract assets, initially based on the Groups historical observed default rates. The Group will adjust the historical credit loss experience
F-23
with forward-looking information. At every reporting date, the historical observed default rates are updated and changes in the forward-looking estimates are analyzed. The assessment of the correlation between historical observed default rates, forecast economic conditions and ECLs is a significant estimate. The amount of ECLs is sensitive to changes in circumstances and of forecast economic conditions. The Groups historical credit loss experience and forecast of economic conditions may also not be representative of customers actual default in the future.
Income tax expense (current and deferred)
The Group is subject to different tax jurisdictions. The determination of tax liabilities for the Group requires the use of assumptions with respect to transactions whose fiscal consequences are not yet certain at the end of the reporting period. Calculation of taxes on a global scale requires the use of estimates and assumptions based on the information available at the balance sheet date. The deferred tax assets realization is dependent upon the generation of future taxable income during the periods in which those temporary differences become deductible and the tax loss carried forwards are utilized. Estimating future taxable income requires estimates about matters that are inherently uncertain and requires significant management judgment, and different estimates can have a significant impact on the outcome of the analysis.
2.4 First-time adoption of IFRS
For periods up to and including the year ended December 31, 2019, the Group prepared its financial statements in accordance with Italian generally accepted accounting principles (Local GAAP). Financial Statements for the year ended December 31, 2020 will be the first the Group prepares in accordance with IFRS and will be included in the Form F-1 of the Company at the time the registration statement becomes effective.
Therefore, current set of financial statements as of and for the year ended December 31, 2019 does not include the 2018 comparatives that are required under IAS 1. In preparing the financial statements, the Groups opening statement of financial position was prepared as at January 1, 2019, the Groups date of transition to IFRS. This note explains the principal adjustments made by the Group in restating its Local GAAP financial statements, including the statement of financial position as at January 1, 2019 and the financial statements as of, and for, the year ended December 31, 2019.
Exemptions applied
IFRS 1 allows first-time adopters certain exemptions from the retrospective application of certain requirements under IFRS. The Group has applied the following exemptions:
| IFRS 3Business Combinations has not been applied to either acquisitions of subsidiaries that are considered businesses under IFRS, or acquisitions of interests in associates and joint ventures that occurred before January 1, 2019. Use of this exemption means that the Local GAAP carrying amounts of assets and liabilities, that are required to be recognized under IFRS, are their deemed cost at the date of the acquisition. After the date of the acquisition, measurement is in accordance with IFRS. Assets and liabilities that do not qualify for recognition under IFRS are excluded from the opening IFRS statement of financial position; |
| IFRS 1 also requires that the Local GAAP carrying amount of goodwill must be used in the opening IFRS statement of financial position (apart from adjustments for goodwill impairment and recognition or derecognition of intangible assets). In accordance with IFRS 1, the Group has tested goodwill for impairment at the date of transition to IFRS. There was no impairment recognized on goodwill at January 1, 2019; |
| The Group assessed all contracts existing at January 1, 2019 to determine whether a contract contains a lease based upon the conditions in place as at January 1, 2019; |
F-24
| Lease liabilities are measured at the present value of the remaining lease payments, discounted using the lessees incremental borrowing rate at January 1, 2019. Right of Use assets are measured at the amount equal to the lease liabilities, adjusted by the amount of any prepaid or accrued lease payments relating to that lease recognized in the statement of financial position immediately before January 1, 2019. In case of the Group is required to restore a leased assets at the end of the lease period, Right of Use assets are increased for the estimated decommissioning costs and a provision is recognized for the same amount. The lease payments associated with leases for which the lease term ends within 12 months of the date of transition to IFRS and leases for which the underlying asset is of low value have been recognized as an expense on either a straight-line basis over the lease term or another systematic basis; |
| The Group has designated investments in equity instruments including unquoted equity instruments as equity instruments at fair value through profit or loss on the basis of the facts and circumstances that exist at January 1, 2019. |
Estimates
The estimates at January 1, 2019 and at December 31, 2019 are consistent with those made for the same dates in accordance with Local GAAP (after adjustments to reflect any differences in accounting policies) apart from the following items where application of Local GAAP did not require estimation:
| Pensions and other post-employment benefits |
| Cash settled awards |
| Investments in equity instrumentsunquoted equity shares |
The estimates used by the Group to present these amounts in accordance with IFRS reflect conditions at January 1, 2019, the date of transition to IFRS and as at December 31, 2019.
F-25
Notes | Local GAAP as at January 1, 2019 |
Reclassification and remeasurements |
IFRS as at January 1, 2019 |
|||||||||||||
(EUR thousand) | ||||||||||||||||
Assets |
||||||||||||||||
Non-current assets |
||||||||||||||||
Goodwill |
47,243 | | 47,243 | |||||||||||||
Other intangible assets |
A, B | 39,429 | (4,919 | ) | 34,510 | |||||||||||
Right of Use assets |
C | | 20,804 | 20,804 | ||||||||||||
Property, plant and equipment |
D | 248,641 | (3,014 | ) | 245,627 | |||||||||||
Investments in an associate |
2,179 | | 2,179 | |||||||||||||
Financial assetsinvestments FVTPL |
F | 908 | 1,049 | 1,957 | ||||||||||||
Other non-current financial assets |
F | 5,970 | 9 | 5,979 | ||||||||||||
Deferred tax assets |
R | 23,908 | 4,488 | 28,396 | ||||||||||||
|
|
|
|
|
|
|||||||||||
368,278 | 18,417 | 386,695 | ||||||||||||||
Current assets |
||||||||||||||||
Inventories |
E | 81,911 | 16,700 | 98,611 | ||||||||||||
Contract assets |
E | 79,981 | (55,561 | ) | 24,420 | |||||||||||
Trade receivables |
G | 132,117 | (894 | ) | 131,223 | |||||||||||
Other current financial assets |
40,337 | | 40,337 | |||||||||||||
Tax receivables |
30,009 | (9,314 | ) | 20,695 | ||||||||||||
Other receivables |
5,719 | (639 | ) | 5,080 | ||||||||||||
Cash and cash equivalents |
74,519 | | 74,519 | |||||||||||||
|
|
|
|
|
|
|||||||||||
444,593 | (49,708 | ) | 394,885 | |||||||||||||
|
|
|
|
|
|
|||||||||||
Total assets |
812,872 | (31,292 | ) | 781,580 | ||||||||||||
|
|
|
|
|
|
|||||||||||
Equity and liabilities |
||||||||||||||||
Equity |
||||||||||||||||
Share capital |
20,002 | | 20,002 | |||||||||||||
Reserves and Retained Earnings |
H, I, L, M | 190,998 | (20,846 | ) | 170,152 | |||||||||||
Net profit attributable to equity holders of the parent |
H, I | 40,835 | 574 | 41,409 | ||||||||||||
|
|
|
|
|
|
|||||||||||
Equity attributable to equity holders of the parent |
251,835 | (20,272 | ) | 231,563 | ||||||||||||
Non-controlling interests |
A, H, I | 3,148 | (3,314 | ) | (166 | ) | ||||||||||
|
|
|
|
|
|
|||||||||||
Total equity |
254,983 | (23,585 | ) | 231,397 | ||||||||||||
|
|
|
|
|
|
|||||||||||
Non-current liabilities |
||||||||||||||||
Non-current financial liabilities |
C, I | 245,185 | 22,507 | 267,692 | ||||||||||||
Employees Benefits |
J, K, L | 7,648 | 16,864 | 24,512 | ||||||||||||
Provisions |
C, M , N | 9,402 | (6,342 | ) | 3,060 | |||||||||||
Deferred tax liabilities |
R | 15,169 | (4,279 | ) | 10,890 | |||||||||||
Other non-current liabilities |
125 | | 125 | |||||||||||||
|
|
|
|
|
|
|||||||||||
277,529 | 28,749 | 306,278 | ||||||||||||||
Current liabilities |
||||||||||||||||
Current financial liabilities |
C | 56,718 | 1,186 | 57,904 | ||||||||||||
Trade payables |
E | 97,510 | (5,738 | ) | 91,772 | |||||||||||
Contract Liabilites |
E | | 7,851 | 7,851 | ||||||||||||
Advances from customers |
E | 75,815 | (37,914 | ) | 37,901 | |||||||||||
Tax payables |
21,838 | (8,752 | ) | 13,086 | ||||||||||||
Other liabilities |
28,478 | 6,913 | 35,391 | |||||||||||||
|
|
|
|
|
|
|||||||||||
280,359 | (36,455 | ) | 243,904 | |||||||||||||
|
|
|
|
|
|
|||||||||||
Total liabilities |
557,889 | (7,706 | ) | 550,183 | ||||||||||||
|
|
|
|
|
|
|||||||||||
Total equity and liabilities |
812,872 | (31,292 | ) | 781,580 | ||||||||||||
|
|
|
|
|
|
F-26
Notes | Local GAAP for the year ended December 31, 2019 |
Reclassification and remeasurements |
IFRS for the year ended December 31, 2019 |
|||||||||||
(EUR thousand) | ||||||||||||||
Revenues |
E, P | 565,038 | (28,499 | ) | 536,539 | |||||||||
Cost of sales |
C, E, P | 415,513 | (16,995 | ) | 398,518 | |||||||||
|
|
|
|
|
|
|||||||||
Gross profit |
149,525 | (11,504) | 138,021 | |||||||||||
Other operating income |
540 | 8,197 | 8,737 | |||||||||||
Selling and Marketing expenses |
C, G, P | 24,841 | 1,303 | 26,144 | ||||||||||
Research and Development expenses |
A, C | 7,138 | 688 | 7,826 | ||||||||||
General and Administrative expenses |
B, C, F, J, K, L, N, O, P |
56,339 | (5,771 | ) | 50,568 | |||||||||
|
|
|
|
|
|
|||||||||
Operating profit |
61,747 | 473 | 62,220 | |||||||||||
Finance income |
C, F | 7,966 | 40 | 8,006 | ||||||||||
Finance expense |
C, D, I, J, K, L |
12,921 | 2,330 | 15,250 | ||||||||||
Share of profit of an associate |
Q | 375 | (113 | ) | 262 | |||||||||
|
|
|
|
|
|
|||||||||
Profit before tax |
56,417 | (1,704 | ) | 54,714 | ||||||||||
Income taxes |
16,491 | (483 | ) | 16,007 | ||||||||||
|
|
|
|
|
|
|||||||||
Net Profit |
39,926 | (1,221 | ) | 38,707 | ||||||||||
|
|
|
|
|
|
|||||||||
Other comprehensive income |
||||||||||||||
Results from the remeasurement of emplyee defined benefit plans |
L | | (377 | ) | (377 | ) | ||||||||
Results from the actuarial valuation funds |
M | | (29 | ) | (29 | ) | ||||||||
Tax effect relating to that components of OCI |
| 86 | 86 | |||||||||||
|
|
|
|
|
|
|||||||||
Other comprehensive income that will not be classified subsequently to profit or loss |
| (320 | ) | (320 | ) | |||||||||
|
|
|
|
|
|
|||||||||
Currency translation |
2,535 | | 2,535 | |||||||||||
Changes in the fair value of cash flow hedging instruments |
(900 | ) | | (900 | ) | |||||||||
Tax effect relating to that components of OCI |
216 | | 216 | |||||||||||
|
|
|
|
|
|
|||||||||
Other comprehensive income that will be classified subsequently to profit or loss |
1,851 | | 1,851 | |||||||||||
|
|
|
|
|
|
|||||||||
Other comprehensive income attributabile to non-controlling interests |
13 | (0 | ) | 13 | ||||||||||
Other comprehensive income attributabile to equity holders of the pare |
L. M | 1,838 | (320 | ) | 1,519 | |||||||||
|
|
|
|
|
|
|||||||||
Total other comprehensive income, net of tax |
1,851 | (320 | ) | 1,531 | ||||||||||
|
|
|
|
|
|
|||||||||
Total Comprehensive Income |
41,777 | (1,541 | ) | 40,238 | ||||||||||
|
|
|
|
|
|
|||||||||
Attributable to: |
||||||||||||||
Equity holders of the parent |
39,435 | 1,285 | 40,720 | |||||||||||
Non-controlling interests |
492 | (974 | ) | (482 | ) | |||||||||
|
|
|
|
|
|
|||||||||
39,927 | 311 | 40,238 | ||||||||||||
|
|
|
|
|
|
F-27
Notes | Local GAAP as at December 31, 2019 |
Reclassification and remeasurements |
IFRS as at December 31, 2019 |
|||||||||||||
(EUR thousand) | ||||||||||||||||
Assets |
||||||||||||||||
Non-current assets |
||||||||||||||||
Goodwill |
O | 41,147 | 6,096 | 47,243 | ||||||||||||
Other intangible assets |
A, B | 40,305 | (5,482 | ) | 34,823 | |||||||||||
Right of Use assets |
C | | 26,339 | 26,339 | ||||||||||||
Property, plant and equipment |
D, P | 286,217 | (5,630 | ) | 280,587 | |||||||||||
Investments in an associate |
Q | 1,804 | 113 | 1,917 | ||||||||||||
Financial assetsinvestments FVTPL |
F | 908 | 1,070 | 1,978 | ||||||||||||
Other non-current financial assets |
F | 6,590 | 20 | 6,610 | ||||||||||||
Deferred tax assets |
R | 30,746 | 2,353 | 33,099 | ||||||||||||
|
|
|
|
|
|
|||||||||||
407,717 | 24,878 | 432,595 | ||||||||||||||
Current assets |
||||||||||||||||
Inventories |
E | 109,537 | 22,345 | 131,882 | ||||||||||||
Contract assets |
E | 115,164 | (82,628 | ) | 32,536 | |||||||||||
Trade receivables |
G | 130,296 | (2,254 | ) | 128,042 | |||||||||||
Other current financial assets |
41,306 | | 41,306 | |||||||||||||
Tax receivables |
37,725 | (11,369 | ) | 26,356 | ||||||||||||
Other receivables |
4,224 | (149 | ) | 4,075 | ||||||||||||
Cash and cash equivalents |
85,358 | 28 | 85,386 | |||||||||||||
|
|
|
|
|
|
|||||||||||
523,610 | (74,026 | ) | 449,584 | |||||||||||||
|
|
|
|
|
|
|||||||||||
Total assets |
931,327 | (49,148 | ) | 882,179 | ||||||||||||
|
|
|
|
|
|
|||||||||||
Equity and liabilities |
||||||||||||||||
Equity |
||||||||||||||||
Share capital |
20,002 | | 20,002 | |||||||||||||
Reserves and Retained Earnings |
|
A, B, G, I, L, M |
227,828 | (21,541 | ) | 206,287 | ||||||||||
Net income attributable to equity holders of the parent |
39,435 | (234 | ) | 39,201 | ||||||||||||
|
|
|
|
|
|
|||||||||||
Equity attributable to equity holders of the parent |
287,265 | (21,775 | ) | 265,490 | ||||||||||||
Non-controlling interests |
A, I | 2,758 | (2,808 | ) | (50 | ) | ||||||||||
|
|
|
|
|
|
|||||||||||
Total equity |
290,023 | (24,584 | ) | 265,439 | ||||||||||||
|
|
|
|
|
|
|||||||||||
Non-current liabilities |
||||||||||||||||
Non-current financial liabilities |
C, I | 289,334 | 22,805 | 312,139 | ||||||||||||
Employees Benefits |
J, K, L | 8,389 | 18,156 | 26,545 | ||||||||||||
Provisions |
|
C, F, M, N |
12,534 | (8,588 | ) | 3,946 | ||||||||||
Deferred tax liabilities |
R | 17,428 | (6,999 | ) | 10,429 | |||||||||||
Other non-current liabilities |
739 | | 739 | |||||||||||||
|
|
|
|
|
|
|||||||||||
328,424 | 25,373 | 353,797 | ||||||||||||||
Current liabilities |
||||||||||||||||
Current financial liabilities |
C | 70,324 | 3,593 | 73,917 | ||||||||||||
Trade payables |
E | 110,358 | (15,307 | ) | 95,051 | |||||||||||
Contract Liabilites |
E | | 5,623 | 5,623 | ||||||||||||
Advances from customers |
E | 84,248 | (42,356 | ) | 41,892 | |||||||||||
Tax payables |
16,500 | (10,808 | ) | 5,692 | ||||||||||||
Other liabilities |
31,450 | 9,316 | 40,766 | |||||||||||||
|
|
|
|
|
|
|||||||||||
312,880 | (49,938 | ) | 262,942 | |||||||||||||
Total liabilities |
641,304 | (24,565 | ) | 616,739 | ||||||||||||
|
|
|
|
|
|
|||||||||||
Total equity and liabilities |
931,327 | (49,148 | ) | 882,179 | ||||||||||||
|
|
|
|
|
|
F-28
Notes to the reconciliation of equity as at January 1, 2019 and December 31, 2019 and total comprehensive income for the year ended December 31, 2019
A Research costs
Under Local GAAP, the Group capitalized the research costs related a project related to a new Drug Delivery System. As such costs do not qualify for recognition as assets under IFRS, such assets are derecognized against retained earnings.
B Start-up costs
Under Local GAAP, the Group capitalized the cost of incorporation of a new subsidiary, depreciated on a straight-line basis over five years. As such costs do not qualify for recognition as assets under IFRS, these assets are derecognized against retained earnings.
C Leases
Under Local GAAP, a lease is classified as a finance lease or an operating lease. Operating lease payments are recognized as an operating expense in the statement of profit or loss on a straight-line basis over the lease term. Under IFRS, a lessee applies a single recognition and measurement approach for all leases, except for short-term leases and leases of low-value assets and recognizes lease liabilities to make lease payments and Right of Use assets representing the right to use the underlying assets. At the date of transition to IFRS, the Group applied the transitional provision and measured lease liabilities at the present value of the remaining lease payments, discounted using the lessees incremental borrowing rate at the date of transition to IFRS. Right of Use assets were measured at the amount equal to the lease liabilities adjusted by the amount of any prepaid or accrued lease payments. When the Group is required to restore a leased assets at the end of the lease period, Right of Use assets are increased for the estimated decommissioning costs and a provision is recognized for the same amount. As a result, at the date of the transition to IFRS, the Group recognized an increase of EUR 18,456 thousand (December 31, 2019: EUR 19,820 thousand) of lease liabilities included under financial liabilities and EUR 18,972 thousand (December 31, 2019: EUR 19,971 thousand) of Right of Use assets.
Under Local GAAP, assets held under finance leases are capitalized and included in property, plant and equipment. Under IFRS, they are presented in Right of Use assets. At the date of transition to IFRS, EUR 1,833 thousand (December 31, 2019: EUR 6,368 thousand) was reclassified from property, plant and equipment to Right of Use assets. Additionally, depreciation increased by EUR 3,938 thousand (EUR 1,189 thousand was included in Cost of sales, EUR 2,462 thousand was included in General and Administrative expenses, EUR 260 thousand was included in Selling and Marketing expenses and EUR 27 thousand was included in Research and Development expenses) and interest expenses increased by EUR 589 thousand for the year ended December 31, 2019.
D Borrowing costs
Under Local GAAP the Group expensed borrowing costs as incurred. At the date of transition, the Group elected to capitalize borrowing costs only in respect of qualifying assets for which the commencement date for capitalization was on or after the date of transition.
E Revenue recognition
Under Local GAAP when the outcome of the contract can be estimated reliably, revenue and costs must be recognized by reference to the stage of completion of the contract activity at the balance sheet date. If Groups obligation to produce a customized product does not meet one of the criteria in IFRS 15 par. 35 for revenue recognition over time (e.g. the entitys performance does not create an asset with an alternative use, and the entity has an enforceable right to payment for performance completed to date), revenue may be recognized at a
F-29
point in time. As a result, the Group recognized an increase of EUR 16,700 thousand (December 31, 2019: EUR 22,345 thousand) of inventories, a decrease of EUR 55,561 thousand (December 31, 2019: EUR 82,628 thousand) of contract assets and a decrease of EUR 5,747 thousand (December 31, 2019: EUR 15,317 thousand) of trade payables and advances from customers. Additionally, net income for the year ended December 31, 2019 was reduced by EUR 3,023 thousand.
F Financial assetsinvestment FVTPL
Under Local GAAP, the Group accounted for investments in unquoted equity shares as financial instruments measured at cost. Under IFRS, the Group has designated such investments as an equity instrument as at fair value through profit or loss. At the date of transition to IFRS, the fair value of these assets is EUR 1,940 thousand and their previous Local GAAP carrying amount was EUR 892 thousand. The EUR 22 thousand difference between the instruments fair value and Local GAAP carrying amount has been recognized through profit or loss for the year ended December 31, 2019.
G Trade and other receivables
The adoption of IFRS has fundamentally changed the Groups accounting for impairment losses for financial assets by replacing incurred loss approach under Local GAAP with a forward-looking expected credit loss (ECL) approach. IFRS requires the Group to recognize an allowance for ECLs for all debt instruments not held at fair value through profit or loss and contract assets. At the date of transition to IFRS, the Group recognized additional impairment on its trade receivables of EUR 894 thousand (December 31, 2019: EUR 2,254 thousand), which resulted in a decrease in retained earnings by the same amount.
H Equity instruments issued by a subsidiary
Under Local GAAP the Group classified the equity instruments issued by a subsidiary to other parties by reference to its legal form. IAS 32 requires the issuer of a financial instrument to classify by reference to its substantive rights rather than its legal form and the key determinant of whether an instrument is a financial liability or an equity instrument of the issuer is whether the terms of instrument give the holder a contractual right to receive cash or other financial assets. At the date of transition to IFRS, the Group reclassified non-controlling interests of EUR 1,348 thousand.
I Put and call option over non-controlling interests
Local GAAP give no guidance a show to account call and put options over non-controlling interests in a business combination. Under IFRS a combination of put and call option over non-controlling interests means that the instrument is highly likely to exercised and it gives rise to a financial liability measured at the present value of redemption amount. If the terms of the transaction do not provide a present ownership interest, the Group will only recognize a financial liability for the non-controlling interest put and not recognize a non-controlling interest. Subsequently the financial liability is measured in accordance with IFRS 9 and the changes are recognized in income statement.
At the date of transition to IFRS, the Group recognized a financial liability of EUR 5,275 thousand (December 31, 2019: EUR 6,698 thousand), which resulted in a decrease in retained earnings by EUR 3,959 thousand and a decrease of non-controlling interest of EUR 1,314 thousand (December 31, 2019: EUR 2,086 thousand).
J Cash settled awards
Under Local GAAP, the Group recognized only the cost for the cash settled awards on a cash basis. IFRS require these obligations to be measured as the present value of expected future payments to be made in respect
F-30
of services provided by employees and directors up to the end of the reporting period, using the projected unit credit method in accordance to IAS 19. At the date of transition to IFRS, the Group recognized an additional liability as Employee Benefits of EUR 17,382 thousand (December 31, 2019: EUR 18,893 thousand). An additional expense of EUR 1,510 thousand has been recognized in profit or loss for the year ended December 31, 2019.
K Long-term Incentive Plan
Under Local GAAP, the Group recognized costs related to the Long-term Incentive Plan in full on an accrual basis. Under IFRS, Long-term Incentive Plan is considered as Other Long-term employee benefits and is recognized and measured using the projected unit credit method according to IAS 19. At the date of transition to IFRS, the Group remeasured the liability as Employee Benefits with a reduction of EUR 64 thousand (December 31, 2019: EUR 446 thousand). A decrease in expenses of EUR 286 thousand has been recognized in profit or loss for the year ended December 31, 2019.
L Severance Pay
Under Local GAAP the Group has accrued the undiscounted vested obligation for severance pay (TFR) as if all the employees left at the balance sheet date. Under IFRS, defined benefit plan obligations are recognized and measured using the projected unit credit method according to IAS 19. At the date of transition to IFRS, the Group remeasured the liability as Employee Benefits with an increase of EUR 393 thousand (December 31, 2019: EUR 699 thousand). A reduction in expenses of EUR 23 thousand has been recognized in profit or loss for the year ended December 31, 2019 (EUR 377 thousand has been recognized as a loss on the 2019 other comprehensive income).
M Agent termination plan and non-competition agreement
Under Local GAAP the Group has accrued the obligation for agent termination plan and non-competition agreements as if all the contracts were terminated at the balance sheet date. Under IFRS, the obligations are recognized and measured according to IAS 37. At the date of transition to IFRS, the Group remeasured the provision with a reduction of EUR 74 thousand (December 31, 2019: EUR 45 thousand). An actuarial loss of EUR 29 thousand has been recognized on the 2019 other comprehensive income.
N Dismantling costs
Under Local GAAP a dismantling costs provision has been recorded relating to restore certain leased sites for the effect of the Groups operations. The provision does not qualify for recognition as a liability according to IAS 37, and has been derecognized against retained earnings and, as a result, the restoration costs have been considered in the calculation of Right of Use assets according to IFRS 16 and the related provision recalculated accordingly. At the date of transition to IFRS, the Group remeasured the provision with a decrease of EUR 155 thousand (December 31, 2019: EUR 211 thousand). A reduction in expenses of EUR 53 thousand has been recognized in profit or loss for the year ended December 31, 2019.
O Amortization of goodwill
Under Local GAAP amortization of the goodwill recognized on the investments accounted for using the equity method was recognized in profit or loss on a straight-line basis over the estimated useful live of goodwill. Under IFRS, after initial recognition, goodwill is measured at cost less any accumulated impairment losses at a level that reflects the way an entity manages its operations. For the purpose of impairment testing, goodwill acquired in a business combination is, from the acquisition date, allocated to each of the Groups cash-generating units that are expected to benefit from the combination and annually being tested for impairment. As result amortization of goodwill for the year ended December 31, 2019 was reduced by EUR 6,096 thousand.
F-31
P Depreciation
Under Italian law depreciation of the assets can be reduced up to 50% during the first year of utilization. IAS 16 requires the depreciation of an asset begins when it is available for use, i.e., when it is in the location and condition necessary for it to be capable of operating in the manner intended by management. As result, depreciation for the year ended December 31, 2019 was decreased by EUR 822 thousand.
Q Investments in an associate
Under Local GAAP the goodwill recognized on the acquisition of its interests in the associate was depreciated in profit or loss on a straight-line basis over the estimated useful live of goodwill. Under IFRS, goodwill should be tested for impairment in accordance with IAS 36. As result amortization of goodwill for the year ended December 31, 2019 was reduced by EUR 192 thousand.
R Deferred tax
The various transitional adjustments resulted in various temporary differences. According to the accounting policies in Note 2.3, the Group has to recognize the tax effects of such differences. Deferred tax adjustments are recognized in correlation to the underlying transaction either in retained earnings or a separate component of equity.
S Statement of cash flows
Under Local GAAP, a lease is classified as a finance lease or an operating lease. Cash flows arising from operating lease payments are classified as operating activities. Under IFRS, a lessee generally applies a single recognition and measurement approach for all leases and recognizes lease liabilities. Cash flows arising from payments of principal portion of lease liabilities are classified as financing activities. Therefore, cash outflows from operating activities decreased by EUR 4,741 thousand and cash outflows from financing activities increased by the same amount for the year ended December 31, 2019.
3. Changes in accounting policies and disclosures
New accounting standards
The principles and standards utilized in preparing these consolidated financial statements have been consistently applied through all periods presented, with the exception of the new standards and interpretations that are effective for reporting periods beginning on January 1, 2020, described below.
New endorsed standards, amendments and interpretations:
The Group adopted the following amendments and interpretations and effective for annual periods beginning on January 1, 2020 but did not require changes to accounting policies or retrospective adjustments.
| Amendments to References to the Conceptual Framework in IFRS standards |
| Amendments to IAS 1 Presentation of Financial Statements and IAS 8 Accounting policies, Changes in accounting estimates and ErrorsDefinition of Material |
| Amendments to IFRS 3 Business CombinationsDefinition of a Business |
| Amendments to IFRS 9 Financial Instruments, IAS 39 Financial Instruments: Recognition and Measurement and IFRS 7 Financial Instruments: DisclosuresInterest Rate Benchmark Reform |
| Amendment to IFRS 16 Leases Covid 19Related Rent Concessions (issued in May 28, 2020) |
F-32
Conceptual Framework for Financial Reporting
The Conceptual Framework is not a standard, and none of the concepts contained therein override the concepts or requirements in any standard. The purpose of the Conceptual Framework is to assist the IASB in developing standards, to help preparers develop consistent accounting policies where there is no applicable standard in place and to assist all parties to understand and interpret the standards. This will affect those entities which developed their accounting policies based on the Conceptual Framework. The revised Conceptual Framework includes some new concepts, updated definitions and recognition criteria for assets and liabilities and clarifies some important concepts. These amendments had no impact on the consolidated financial statements of the Group.
Amendments to IAS 1 and IAS 8 Accounting policies, Changes in accounting estimates and ErrorsDefinition of Material
The amendments to IAS 1 and IAS 8 are intended to clarify the definition of materiality and its application. According to the new standard, information is material if omitting, misstating or obscuring it could reasonably be expected to influence the decisions that the primary users of general purpose financial statements make on the basis of those financial statements, which provide financial information about a specific reporting entity. The amendments clarify that materiality will depend on the nature or magnitude of information, either individually or in combination with other information, in the context of the financial statements. A misstatement of information is material if it could reasonably be expected to influence decisions made by the primary users. These amendments had no impact on the consolidated financial statements of, nor is there expected to be any future impact to the Group.
Amendments to IFRS 3: Definition of a Business
The main changes to IFRS 3 refer to updating the business definition, an integrated set of activities and assets must include, at a minimum, an input and a substantive process that, together, significantly contribute to the ability to create output. Furthermore, it clarifies that a business can exist without including all of the inputs and processes needed to create outputs. These amendments had no impact on the consolidated financial statements of the Group, but may impact future periods should the Group enter into any business combinations.
Amendments to IFRS 7, IFRS 9 and IAS 39 Interest Rate Benchmark Reform
The amendments to IFRS 9 and IAS 39Financial Instruments: Recognition and Measurement provide a number of reliefs, which apply to all hedging relationships that are directly affected by interest rate benchmark reform. A hedging relationship is affected if the reform gives rise to uncertainty about the timing and/or amount of benchmark-based cash flows of the hedged item or the hedging instrument. These amendments have no impact on the consolidated financial statements of the Group as it does not have any interest rate hedge relationships impacted by the reform.
Amendments to IFRS 16 Covid-19 Related Rent Concessions
In May 28, 2020, the IASB issued Covid-19-Related Rent Concessionsamendment to IFRS 16 Leases. The amendments provide relief to lessees from applying IFRS 16 guidance on lease modification accounting for rent concessions arising as a direct consequence of the Covid-19 pandemic. As a practical expedient, a lessee may elect not to assess whether a Covid-19 related rent concession from a lessor is a lease modification. A lessee that makes this election accounts for any change in lease payments resulting from the Covid-19 related rent concession the same way it would account for the change under IFRS 16, if the change were not a lease modification. These amendments had no impact on the consolidated financial statements of the Group.
F-33
New standards, amendments and interpretations not yet effective
Amendments to IAS 1Classification of Liabilities as Current or Non-current
In January 2020, the IASB issued amendments to paragraphs 69 to 76 of IAS 1 to specify the requirements for classifying liabilities as current or non-current. The amendments clarify:
| What is meant by a right to defer settlement. |
| That a right to defer must exist at the end of the reporting period. |
| That classification is unaffected by the likelihood that an entity will exercise its deferral right. |
| That only if an embedded derivative in a convertible liability is itself an equity instrument would the terms of a liability not impact its classification. |
The amendments are effective for annual reporting periods beginning on or after January 1, 2023 and must be applied retrospectively. The Group is currently assessing the impact the amendments will have on current practice, monitoring the IFRS Interpretations Committees discussions, and whether existing loan agreements may require renegotiation.
Amendments to IFRS 3Reference to the Conceptual Framework
In May 2020, the IASB issued Amendments to IFRS 3Business CombinationsReference to the Conceptual Framework. The amendments are intended to replace a reference to the Framework for the Preparation and Presentation of Financial Statements, issued in 1989, with a reference to the Conceptual Framework for Financial Reporting issued in March 2018 without significantly changing its requirements. The Board also added an exception to the recognition principle of IFRS 3 to avoid the issue of potential day 2 gains or losses arising for liabilities and contingent liabilities that would be within the scope of IAS 37 or IFRIC 21Levies, if incurred separately. At the same time, the Board decided to clarify existing guidance in IFRS 3 for contingent assets that would not be affected by replacing the reference to the Framework for the Preparation and Presentation of Financial Statements. The amendments are effective for annual reporting periods beginning on or after January 1, 2022 and apply prospectively.
Amendments to IAS 16Property, Plant and Equipment: Proceeds before Intended Use
In May 2020, the IASB issued IAS 16Property, Plant and EquipmentProceeds before Intended Use, which prohibits entities deducting from the cost of an item of property, plant and equipment, any proceeds from selling items produced while bringing that asset to the location and condition necessary for it to be capable of operating in the manner intended by management. Instead, an entity recognizes the proceeds from selling such items, and the costs of producing those items, in profit or loss. The amendment is effective for annual reporting periods beginning on or after 1 January 2022 and must be applied retrospectively to items of property, plant and equipment made available for use on or after the beginning of the earliest period presented when the entity first applies the amendment. The amendments are not expected to have a material impact on the Group.
Amendments to IAS 37Onerous ContractsCosts of Fulfilling a Contract
In May 2020, the IASB issued amendments to IAS 37 to specify which costs an entity needs to include when assessing whether a contract is onerous or loss-making. The amendments apply a directly related cost approach. The costs that relate directly to a contract to provide goods or services include both incremental costs and an allocation of costs directly related to contract activities. General and Administrative costs do not relate directly to a contract and are excluded unless they are explicitly chargeable to the counterparty under the contract. The amendments are effective for annual reporting periods beginning on or after January 1, 2022. The Group will apply these amendments to contracts for which it has not yet fulfilled all its obligations at the beginning of the annual reporting period in which it first applies the amendments.
F-34
Amendments to IAS 8Accounting Policies, Changes to Accounting Estimates and Errors
On 12 February 2021, the IASB issued amendments to IAS 8 Accounting Policies, Changes to Accounting Estimates and Errors, in which it introduces a new definition of accounting estimates. The amendments are designed to clarify the distinction between changes in accounting estimates and changes in accounting policies and the correction of errors. The amendments become effective for annual reporting periods beginning on or after 1 January 2023 and apply to changes in accounting policies and changes in accounting estimates that occur on or after the start of that period. The amendments are not expected to have a material impact on the Group.
Amendments to IAS 1Presentation of Financial Statements
In February 2021, the IASB issued amendments to IAS 1 Presentation of Financial Statements in which it provides guidance and examples to help entities apply materiality judgements to accounting policy disclosures. The IASB also issued amendments to IFRS Practice Statement 2 Making Materiality Judgements (the PS) to support the amendments in IAS 1 by explaining and demonstrating the application of the four-step materiality process to accounting policy disclosures. The amendments aim to help entities provide accounting policy disclosures that are more useful by replacing the requirement for entities to disclose their significant accounting policies with a requirement to disclose their material accounting policies and adding guidance on how entities apply the concept of materiality in making decisions about accounting policy disclosures. The amendments to IAS 1 are applicable for annual periods beginning on or after 1 January 2023. The amendments are not expected to have a material impact on the Group.
4. Scope of consolidation
Stevanato Group S.p.A. is the parent company of the Group and it holds, directly and indirectly, interests in the Groups main operating companies. The Groups scope of consolidation at December 31, 2020 and 2019 is as follows:
Subsidiaries and associate
The consolidated financial statement of the Group includes the following list of company directly or indirectly controlled:
Name |
Segment |
Description |
Country of incorporation |
Type of control |
% equity interest | |||||||||||
2020 | 2019 | |||||||||||||||
Nuova Ompi S.r.l. |
Biopharmaceutical | Production of container closure systems and development of integrated solutions for the pharmaceutical industry | Italy | Direct | 100 | % | 100 | % | ||||||||
Spami S.r.l. |
Engeneering | Production plant and machinery | Italy | Direct | 100 | % | 100 | % | ||||||||
Stevanato Group International a.s. |
Biopharmaceutical | Service/Subholding company | Slovakia | Direct | 100 | % | 100 | % | ||||||||
Medical Glass a.s. |
Biopharmaceutical | Production of container closure systems | Slovakia | Indirect | 100 | % | 100 | % | ||||||||
Stevanato Group N.A. S. de RL de CV |
Biopharmaceutical | Service company | Mexico | Indirect | 100 | % | 100 | % | ||||||||
Ompi N.A. S. de RL de CV |
Biopharmaceutical | Production of container closure systems | Mexico | Direct | 30.76 | % | 30.76 | % | ||||||||
Indirect | 69.24 | % | 69.24 | % | ||||||||||||
Ompi of America inc. |
Biopharmaceutical | Sale of container closure systems | USA | Indirect | 100 | % | 100 | % |
F-35
Name |
Segment |
Description |
Country of incorporation |
Type of control |
% equity interest | |||||||||||
2020 | 2019 | |||||||||||||||
Ompi do Brasil Industria e Comercio de Embalagens Farmaceutica Ltda |
Biopharmaceutical | Production of container closure systems | Brazil | Direct | 79 | % | 71.08 | % | ||||||||
Indirect | 21 | % | 28.92 | % | ||||||||||||
Ompi Pharma.Packing Techn. Co. Ltd |
Biopharmaceutical | Production of container closure systems | China | Indirect | 100 | % | 100 | % | ||||||||
Innoscan A/S |
Engeneering | Production plant and machinery | Denmark | Indirect | 100 | % | 100 | % | ||||||||
SVM Automatik A/S |
Engeneering | Production plant and machinery | Denmark | Indirect | 65 | %* | 65 | %* | ||||||||
Medirio SA |
Biopharmaceutical | Research and development | Switzerland | Indirect | 100 | % | 72 | % | ||||||||
Balda Medical Gmbh |
Biopharmaceutical | Production of in-vitro diagnostic solutions | Germany | Direct | 100 | % | 100 | % | ||||||||
Balda C. Brewer Inc. |
Biopharmaceutical | Production of in-vitro diagnostic solutions | USA | Indirect | 100 | % | 100 | % | ||||||||
Balda Precision Inc. |
Biopharmaceutical | Production metal components | USA | Indirect | 100 | % | 100 | % | ||||||||
Ompi of Japan Co., Ltd. |
Biopharmaceutical | Sale of container closure systems | Japan | Direct | 51 | % | 51 | % | ||||||||
SG Technology Excellence Center Inc. |
Biopharmaceutical | Provision of analysis and laboratory testing servi | USA | Direct | 0 | %** | 100 | % |
* | Not included in minority interests as there is a put and call option for full acquisition (the minority interests would have amounted to 35%). |
** | Following subsequent evaluations, the business of Technology Center will be carried out by Ompi of America, therefore the newly established company SG Technology Excellence Center Inc. was liquidated on October 16, 2020, after repayment of share capital (USD 100 thousand). |
Name |
Division |
Description |
Country of |
Type of |
% equity interest | |||||||
2020 | 2019 | |||||||||||
Swissfillon AG |
Biopharmaceutical | Sterile filling services company | Switzerland | Associate | 26.94% | 26.94% |
Non-controlling interests
The non-controlling interests as at December 31, 2020 and the net profit attributable to non-controlling interests for the years ended December 31, 2020 relate to Ompi of Japan Co., Ltd. and Medical Glass a.s.. On December 10, 2020 the Group purchased the residual shares of Medirio SA and acquired full control of the company. For further details refer to Note 37.
5. Segment Information
Stevanato Group business operations are organized into two reportable segments, based on their specific products and services:
| Biopharmaceutical and Diagnostic Solutions, which includes containment solutions, drug delivery systems, medical devices and diagnostic & analytical services; |
| Engineering, which covers visual inspection, assembly packaging and glass forming machines. |
In 2020, Stevanato Group generated approximately 85% of total sales from the Biopharmaceutical and Diagnostic Solutions segment (85% in 2019), and approximately 15% from the Engineering segment (15% in 2019).
F-36
Biopharmaceutical and Diagnostic Solutions Segment deals mainly with the design and production of glass containers and packaging solutions, based on sophisticated technical and industrial processes, which involve the use of heavy equipment. The production of Container Closure Systems (CCS) accounts for more than 50% of total sales and represents the Group core business. Glass manufacturing process is particularly complex as it is based on multiple sophisticated industrial processes, to form, treat, inspect and package drug containment and delivery products. The critical phases of Stevanato Group business model are managed internally while only the production of glass tubes (which serve as the starting point of the internal production process) and the sterilization process for the final products are outsourced to a trusted network of third parties suppliers. Container Closure Systems includes ampoules, vials, ready-to-fill containers, cartridges and pre-fillable syringes.
Within the same segment there is also the production of In-Vitro Diagnostic (IVD) Solutions and Drug Delivery Systems (DDS). This sector is particularly complex as it requires constant cooperation with each customer for the development of the specific products they need. The production of plastic products requires development of specific molds based on each customers requirements and specifications, which molds are then used for stamping of the final product. The product portfolio is highly diversified and includes different products for pharmaceutical, medical and diagnostic industries.
Additionally, the Group has recently entered the drug delivery system business offering pen injectors, dry powder inhalers, auto-injectors and wearable injectors.
Stevanato Group provides also analytical services and regulatory support exclusively to its customers, as ancillary services to the supply of CCS. Stevanato Group analytical testing facilities in Piombino Dese, Italy, focus on investigating physic-chemical properties of primary packaging materials and components and studying the interactions between container closure system and drugs. The Analytical Services provided include chemical analysis, surface characterization, container performance and interaction, testing on drug delivery systems and customized testing based on the specific need of each client.
Engineering Segment deals with the design, development and production of equipment and machinery for both in-house use and sale to customers (which include some of Stevanato Group competitors). Stevanato Group is driving continuous technological advancements so that its equipment can consistently meet the clients stringent specification requirements. The Group assembles equipment and machinery and develops the software necessary for its functioning beyond working closely with the customers to install the machinery and equipment in their production sites, ensuring they are correctly calibrated and properly functioning. Engineering products include glass converting machinery, visual inspection machinery, assembly platforms, secondary packaging machinery. The after-sales services, mainly consists in the provision of spare parts for our machinery and equipment other than maintenance activity on the machines sold.
The Group also provides professional project management services, supporting its customers in designing their plant layout for the production of bulk and ready-to-use pharmaceutical primary packaging.
F-37
The criteria applied to identify the operating segments are consistent with the information reviewed by the Chief Executive Officer (the Groups Chief Operating Decision Maker) in making decisions regarding the allocation of resources and to assess performance.
As at and for the year ended December 31, 2020 | ||||||||||||||||||||
Biopharmaceutical and Diagnostic Solutions |
Engineering | Total segments |
Adjustments, eliminations and unallocated items |
Consolidated | ||||||||||||||||
(EUR thousand) | ||||||||||||||||||||
External Customers |
564,931 | 97,106 | 662,037 | | 662,037 | |||||||||||||||
Inter-Segment |
1,096 | 56,327 | 57,423 | (57,423 | ) | | ||||||||||||||
Total Revenues |
566,027 | 153,433 | 719,460 | (57,423 | ) | 662,037 | ||||||||||||||
Cost of Sales |
398,411 | 121,332 | 519,743 | (51,882 | ) | 467,861 | ||||||||||||||
|
|
|
|
|
|
|
|
|
|
|||||||||||
Gross Profit |
167,616 | 32,101 | 199,717 | (5,541 | ) | 194,176 | ||||||||||||||
|
|
|
|
|
|
|
|
|
|
|||||||||||
Other operating income |
5,193 | 31 | 5,224 | 7 | 5,230 | |||||||||||||||
Selling and Marketing expenses |
9,762 | 2,842 | 12,605 | 7,439 | 20,044 | |||||||||||||||
Research and Development expenses |
12,080 | 3,056 | 15,136 | 2,254 | 17,390 | |||||||||||||||
General and Administrative expenses |
48,324 | 9,641 | 57,965 | 899 | 58,863 | |||||||||||||||
|
|
|
|
|
|
|
|
|
|
|||||||||||
Operating Profit |
102,643 | 16,593 | 119,236 | (16,127 | ) | 103,109 | ||||||||||||||
|
|
|
|
|
|
|
|
|
|
|||||||||||
Total assets |
776,832 | 188,751 | 965,583 | 2,396 | 967,979 | |||||||||||||||
|
|
|
|
|
|
|
|
|
|
|||||||||||
Total liabilities |
330,624 | 109,325 | 439,949 | 217,890 | 657,839 | |||||||||||||||
|
|
|
|
|
|
|
|
|
|
As at and for the year ended December 31, 2019 | ||||||||||||||||||||
Biopharmaceutical and Diagnostic Solutions |
Engineering | Total segments |
Adjustments, eliminations and unallocated items |
Consolidated | ||||||||||||||||
(EUR thousand) | ||||||||||||||||||||
External Customers |
455,041 | 81,499 | 536,539 | | 536,539 | |||||||||||||||
Inter-Segment |
881 | 45,625 | 46,506 | (46,506 | ) | | ||||||||||||||
Total Revenues |
455,922 | 127,122 | 583,044 | (46,505 | ) | 536,539 | ||||||||||||||
Cost of Sales |
333,539 | 104,291 | 437,829 | (39,311 | ) | 398,518 | ||||||||||||||
|
|
|
|
|
|
|
|
|
|
|||||||||||
Gross Profit |
122,383 | 22,832 | 145,215 | (7,194 | ) | 138,021 | ||||||||||||||
|
|
|
|
|
|
|
|
|
|
|||||||||||
Other operating income |
8,737 | | 8,737 | | 8,737 | |||||||||||||||
Selling and Marketing expenses |
13,776 | 3,113 | 16,888 | 9,255 | 26,144 | |||||||||||||||
Research and Development expenses |
5,442 | 1,549 | 6,991 | 836 | 7,826 | |||||||||||||||
General and Administrative expenses |
43,167 | 8,157 | 51,324 | (757 | ) | 50,568 | ||||||||||||||
|
|
|
|
|
|
|
|
|
|
|||||||||||
Operating Profit |
68,735 | 10,013 | 78,748 | (16,529 | ) | 62,220 | ||||||||||||||
|
|
|
|
|
|
|
|
|
|
|||||||||||
Total assets |
668,076 | 160,689 | 828,765 | 53,413 | 882,179 | |||||||||||||||
|
|
|
|
|
|
|
|
|
|
|||||||||||
Total liabilities |
294,717 | 105,112 | 399,829 | 216,911 | 616,739 | |||||||||||||||
|
|
|
|
|
|
|
|
|
|
F-38
Inter-segment revenues and costs are eliminated upon consolidation and reflected in the adjustments, elimination and unallocated items column. The most relevant adjustment in revenues relates to the sales of the Engineerings equipment to the Biopharmaceutical and Diagnostic Solutions.
The Biopharmaceutical and Diagnostic Solutions segment has only one external customer with more than 10% of groups revenue as of December 31, 2019 (EUR 54.2 million). As of December 31, 2020, no external customer exceeds 10% of groups revenue.
Revenues increase by 24.1% (EUR 110.1 million) in Biopharmaceutical and Diagnostic Solutions segment is mainly driven by the growth in high-value solution. Gross profit of this segment increases from 26.8% in 2019 to 29.6% in 2020 due to the favourable mix of products sold, unit sales price increase for high-value solution and production efficiencies.
With reference to Engineering segment, the EUR 26.3 million increase in revenues (+20.7%) is mainly due to the growth in visual inspection machinery sales. The greater integration and the synergies within the companies of the Engineering segment led to a gross profit increase from 18.0% in 2019 to 20.9% in 2020.
6. Revenues from contract with customers
Disaggregated revenue information
The table below shows the disaggregation of the Groups revenue from contracts with external customers:
For the year ended December 31, 2020 | ||||||||||||
Biopharmaceutical and Diagnostic Solutions |
Engineering | Total | ||||||||||
(EUR thousand) | ||||||||||||
Type of goods or service |
||||||||||||
Revenues from high-value solutions |
146,332 | | 146,332 | |||||||||
Revenues from other containment and delivery solutions |
418,599 | | 418,599 | |||||||||
Revenues from engineering |
| 97,106 | 97,106 | |||||||||
|
|
|
|
|
|
|||||||
Total revenue from contracts with customers |
564,931 | 97,106 | 662,037 | |||||||||
|
|
|
|
|
|
|||||||
Geographical markets |
||||||||||||
EM EA |
338,564 | 59,574 | 398,139 | |||||||||
APAC |
54,433 | 12,702 | 67,135 | |||||||||
North America |
151,418 | 23,501 | 174,920 | |||||||||
South America |
20,516 | 1,328 | 21,843 | |||||||||
|
|
|
|
|
|
|||||||
Total revenue from contracts with customers |
564,931 | 97,106 | 662,037 | |||||||||
|
|
|
|
|
|
|||||||
Timing of revenue recognition |
||||||||||||
Goods and services transferred at a point in time |
553,789 | 38,417 | 592,207 | |||||||||
Goods and services transferred over time |
11,142 | 58,689 | 69,830 | |||||||||
|
|
|
|
|
|
|||||||
Total revenue from contracts with customers |
564,931 | 97,106 | 662,037 | |||||||||
|
|
|
|
|
|
F-39
For the year ended December 31, 2019 | ||||||||||||
Biopharmaceutical and Diagnostic Solutions |
Engineering | Total | ||||||||||
(EUR thousand) | ||||||||||||
Type of goods or service |
||||||||||||
Revenues from high-value solutions |
90,700 | | 90,700 | |||||||||
Revenues from other containment and delivery solutions |
364,341 | | 364,341 | |||||||||
Revenues from engineering |
| 81,499 | 81,499 | |||||||||
|
|
|
|
|
|
|||||||
Total revenue from contracts with customers |
455,041 | 81,499 | 536,539 | |||||||||
|
|
|
|
|
|
|||||||
Geographical markets |
||||||||||||
EM EA |
270,338 | 52,486 | 322,824 | |||||||||
APAC |
41,129 | 14,393 | 55,522 | |||||||||
North America |
119,054 | 13,381 | 132,435 | |||||||||
South America |
24,519 | 1,239 | 25,757 | |||||||||
|
|
|
|
|
|
|||||||
Total revenue from contracts with customers |
455,040 | 81,499 | 536,539 | |||||||||
|
|
|
|
|
|
|||||||
Timing of revenue recognition |
||||||||||||
Goods and services transferred at a point in time |
455,041 | 33,685 | 488,725 | |||||||||
Goods and services transferred over time |
| 47,814 | 47,814 | |||||||||
|
|
|
|
|
|
|||||||
Total revenue from contracts with customers |
455,041 | 81,499 | 536,539 | |||||||||
|
|
|
|
|
|
The Group revenues are divided into two main segments:
| Biopharmaceutical and Diagnostic Solutions: this segment includes all the products and services developed and provided for containment and delivery of pharmaceutical drugs and diagnostic reagents. This segment is further divided into two sub-categories: |
| High-value solutions: wholly owned, internally developed products, processes and services for which the Group hold intellectual property rights or have strong proprietary know-how and are characterized by particular complexity or high performance; |
| Other containment and delivery solutions. |
| Engineering: this segment includes all the equipment and technologies developed and provided to support the end-to-end pharmaceutical and diagnostic manufacturing processes. |
Consolidated revenues increase by EUR 125.5 million in 2020.
With reference to Biopharmaceutical and Diagnostic Solutions segment, revenues in high-value solution increase from EUR 90,700 thousand in 2019 to EUR 146,332 thousand in 2020 (+61.3% or EUR 55,632 thousand), while revenues in other containment and delivery solution increased from EUR 364,341 thousand in 2019 to EUR 418,599 thousand in 2020 (+14.9 or EUR 54,258 thousand).
Engineering segment revenues increase to EUR 97,106 thousand compared to EUR 81,499 thousand in 2019 (+19.1% or EUR 15,607 thousand).
Revenues showed higher growth in the APAC market (+20.9%), especially for the Biopharmaceutical and Diagnostic Solutions segment. Revenues increase by 32.1% in North America and by 23.3% in Europe, the Group traditional market. Revenues in South America remained essentially flat.
Revenues related to goods and services transferred over time increase by EUR 11,142 thousand in the in-vitro diagnostic business. Revenues recognized over time increase also in the engineering segment by EUR
F-40
10,875 thousand mainly because of the sale orders increase in the second half of 2020 and not yet delivered at the year end.
Contract balances
The following table provides information on contractual asset from contracts with customer:
At December 31, 2020 |
At December 31, 2019 |
At January 1, 2019 |
||||||||||
(EUR thousand) | ||||||||||||
Trade Receivables |
127,818 | 128,042 | 131,223 | |||||||||
Contract Assets |
39,430 | 32,536 | 24,420 | |||||||||
Contract Liabilities |
(5,031 | ) | (5,623 | ) | (7,851 | ) | ||||||
Advances From Customers |
(48,361 | ) | (41,892 | ) | (37,901 | ) | ||||||
|
|
|
|
|
|
|||||||
Total |
113,856 | 113,063 | 109,891 | |||||||||
|
|
|
|
|
|
The contract assets mainly relate to the Groups right to consideration for productions from construction contract not yet invoiced as of the balance sheet date. The amount recognized as contract assets are reclassified to trade receivable as soon as the Groups has an unconditional right to consideration.
Revenue recognized in the current reporting period relates to carried-forward contract liabilities amount to EUR 19,765 thousand in 2020 (EUR 17,218 in 2019). As of December 31, 2020, the aggregate amount of the transaction price allocated to the remaining performance obligation is EUR 56,417 thousand (EUR 39,861 thousand in 2019) and the Group will recognise this revenue as projects are completed, which is expected to occur over the next 1218 months.
7. Cost of sales
Cost of sales are detailed as follows:
For the years ended December 31, |
||||||||
2020 | 2019 | |||||||
(EUR thousand) | ||||||||
Purchases |
226,997 | 175,816 | ||||||
Change in inventories |
(1,739 | ) | (6,534 | ) | ||||
Direct industrial labour |
107,959 | 102,669 | ||||||
Indirect industrial labour |
42,794 | 33,798 | ||||||
Industrial depreciation |
45,296 | 38,497 | ||||||
Other costs of sales |
46,554 | 54,272 | ||||||
|
|
|
|
|||||
Total Cost of sales |
467,861 | 398,518 | ||||||
|
|
|
|
Cost of sales as of December 31, 2020 amount to EUR 467,861 thousand (EUR 398,518 thousand in 2019), consisting mainly in the cost of materials, components and labour expense related to the production and distribution of goods and services. Cost of sales also include depreciation and amortization of EUR 45,296 thousand (EUR 38,497 thousand in 2019). Cost of sales increased by 17.4%, less than proportionally to revenues mainly by means of efficiency maximization.
8. Other operating income
Other operating income as of December 31, 2020 amounts to EUR 5,230 thousand (EUR 8,737 thousand in 2019), of which EUR 4,958 thousand are related to feasibility study, design, development and industrialization of new products, contract cancellation fees. As of December 31, 2019 this type of operating income amounted to EUR 8,197 thousand in 2019.
F-41
As of December 31, 2020 other operating income include also EUR 272 thousand related to grants received by Nuova Ompi:
| EUR 244 thousand from the so-called Sustainable Growth Fund promoted by the Ministry for Productive Activities, in relation to an innovative research project for the development of a series of prototype solutions of innovative glass containers (called Alba) for the primary packaging of parental drugs characterized by the presence of an internal coating; |
| EUR 28 thousand as tax credit for sanification connected to Covid-19. |
As at December 31, 2019 the grants received by Nuova Ompi amounted to EUR 540 thousand are broken down as follows:
| EUR 233 thousand from the so-called Sustainable Growth Fund; |
| EUR 307 thousand from Cassa per i Servizi Energetici e Ambientali as facilities for energy-intensive businesses. |
9. Expenses
Expenses are detailed as follows:
For the years ended December 31, |
||||||||
2020 | 2019 | |||||||
(EUR thousand) | ||||||||
Selling and Marketing expenses |
20,044 | 26,144 | ||||||
Research and Development expenses |
17,390 | 7,826 | ||||||
General and Administrative expenses |
58,863 | 50,568 | ||||||
|
|
|
|
|||||
Total Expenses |
96,297 | 84,538 | ||||||
|
|
|
|
As at December 31, 2020 Selling and Marketing expenses amount to EUR 20,044 thousand (EUR 26,144 thousand in 2019). These expenses are mainly related to personnel expenses for sales organizations. They include also depreciation for EUR 844 thousand (EUR 702 thousand in 2019) and provision for bad and doubtful debts for EUR 1,084 thousand (EUR 3,859 thousand in 2019) of which EUR 1,079 thousand as expected credit loss and EUR 5 thousand as write off (respectively EUR 3,656 thousand and EUR 203 thousand in 2019).
Selling and Marketing expenses decrease by EUR 6,100 thousand is due to the reduction in travel expenses and cancellation of trade fairs, as a consequence of the Covid-19 pandemic, and to the decrease in marketing activities and business consultancies. 2019 was also affected by una tantum expenses related to the 70th Anniversary from the Group founding, not present in 2020.
Research and Development expenses amounting to EUR 17,390 thousand (EUR 7,826 thousand in 2019) include costs for research and development activities to support the innovation of product range and components and include amortization of capitalized development costs for EUR 2,580 thousand (EUR 930 thousand in 2019).
Research and Development expenses increase by EUR 9,564 thousand is primarily due to the development of proprietary products drug delivery systems, high value products, engineering solutions and analytical services set-up.
General and Administrative expenses amount to EUR 58,863 thousand (EUR 50,568 thousand in 2019) and mainly comprise personnel expenses for administrative functions as well as, depreciation and amortization for EUR 5,383 thousand (EUR 6,088 thousand in 2019), of which amortization of fair value adjustments from purchase price allocations amount to EUR 1,039 thousand (same amount in 2019).
F-42
General and Administrative expenses increase by EUR 8,295 thousand of which EUR 2,821 thousand related to non-recurring litigation costs arising from a lawsuit raised by Clere BSD GmbH in connection with the acquisition of the operational business of Balda AG and more specifically to certain transfer fees paid by the defendant to a former vendor. The increase is also due to the business growth and the increase in personnel expenses for long term incentive and cash settled awards.
10. Other information by nature
The breakdown of the Selling, Research & Development and Administrative expenses by nature is as follows:
For the years ended December 31, |
||||||||
2020 | 2019 | |||||||
(EUR thousand) | ||||||||
Personnel |
43,731 | 37,187 | ||||||
Other Costs and Incomes |
42,676 | 35,772 | ||||||
Depreciation and Amortization |
8,807 | 7,720 | ||||||
Expected Credit Losses |
1,084 | 3,859 | ||||||
|
|
|
|
|||||
Total Expenses |
96,297 | 84,538 | ||||||
|
|
|
|
Depreciation and amortization can be broken down as follows:
For the years ended December 31, |
||||||||
2020 | 2019 | |||||||
(EUR thousand) | ||||||||
Cost of sales |
45,296 | 38,497 | ||||||
Selling and Marketing expenses |
844 | 702 | ||||||
Research and Development expenses |
2,580 | 930 | ||||||
General and Administrative expenses |
5,383 | 6,088 | ||||||
|
|
|
|
|||||
Total Depreciation & Amortization |
54,103 | 46,217 | ||||||
|
|
|
|
For further details on amortization and depreciation, reference should be made to the movements in property, plant and equipment, intangible assets and right of use assets. (Note 17 - 18 - 36).
11. Finance income
Finance income are as follows:
For the years ended December 31, |
||||||||
2020 | 2019 | |||||||
(EUR thousand) | ||||||||
Interest income from banks deposits |
352 | 158 | ||||||
Income from financial discounts |
17 | 398 | ||||||
Interest income on loans to associates |
20 | 17 | ||||||
Other financial income |
296 | 63 | ||||||
Foreign currency exchange rate gains |
11,585 | 4,789 | ||||||
Derivatives write-ups |
2,007 | 1,809 | ||||||
Other fair value adjustments |
650 | 773 | ||||||
|
|
|
|
|||||
Total finance income |
14,926 | 8,006 | ||||||
|
|
|
|
F-43
12. Finance expense
Finance expense are as follows:
For the years ended December 31, |
||||||||
2020 | 2019 | |||||||
(EUR thousand) | ||||||||
Interest on debts and borrowings |
5,333 | 4,109 | ||||||
Financial discounts and other expenses |
37 | 871 | ||||||
Interest on lease liabilities |
624 | 626 | ||||||
Financial component IAS 19 |
125 | 374 | ||||||
Foreign currency exchange losses |
12,033 | 5,334 | ||||||
Derivatives write-downs |
2,471 | 2,513 | ||||||
Other fair value adjustments |
1,225 | 1,423 | ||||||
|
|
|
|
|||||
Total finance expense |
21,848 | 15,250 | ||||||
|
|
|
|
Finance expense include bank interest on the Groups financial debt (recalculated using the amortized cost method) and interest on leases about the portion of financial expenses payable matured in the reporting period on the liabilities, recognized in accordance with IFRS 16Leases.
Foreign exchange differences are realized, and unrealized gains and losses incurred on transactions in currencies other than the functional currency of the Group; the net foreign currency exchange impact, given by the sum of gains and losses, amounts to EUR (448) thousand as of December 31, 2020 and EUR (545) thousand as of December, 31 2019.
13. Employee benefits expense
Employee benefits expense are detailed as follows:
For the years ended December 31, |
||||||||
2020 | 2019 | |||||||
(EUR thousand) | ||||||||
Included in Cost of sales: |
||||||||
Wages and salaries |
123,773 | 112,687 | ||||||
Social security costs |
22,720 | 19,815 | ||||||
Pension costs |
4,260 | 3,965 | ||||||
Included in Selling and Marketing expenses: |
||||||||
Wages and salaries |
11,522 | 11,033 | ||||||
Social security costs |
1,278 | 1,422 | ||||||
Pension costs |
363 | 350 | ||||||
Included in General and Administrative expenses: |
||||||||
Wages and salaries |
17,313 | 14,907 | ||||||
Social security costs |
2,900 | 2,796 | ||||||
Pension costs |
545 | 374 | ||||||
Cash settled awards |
2,394 | 1,284 | ||||||
Included in Research and Development expenses: |
||||||||
Wages and salaries |
6,327 | 4,184 | ||||||
Social security costs |
857 | 645 | ||||||
Pension costs |
232 | 194 | ||||||
|
|
|
|
|||||
Total employee benefits expense |
194,484 | 173,654 | ||||||
|
|
|
|
F-44
For the year ended December 31, 2020 personnel costs amount to EUR 194,484 thousand (EUR 173,654 thousand in 2019) including EUR 2,394 thousand (EUR 1,284 thousand in 2019) related to cash settled awards expenses. In the consolidated statement of profit or loss, cash settled awards expenses are mainly included into the General and Administrative line item.
Personnel costs increase by EUR 20,830 thousand and are mainly included in Cost of Sales as a consequence of the higher production hours in 2020 compared to 2019. Personnel costs increase also in Research and Development due to the significant increase in total number of headcounts. The increase in personnel costs included in General and Administrative expenses is mainly due to new managerial positions and the accrued costs for incentive plans.
The average size of the Groups workforce during the year is as follows:
For the years ended December 31, |
||||||||
2020 | 2019 | |||||||
Executives |
42 | 37 | ||||||
Managers |
113 | 124 | ||||||
Employees |
3,889 | 3,664 | ||||||
|
|
|
|
|||||
Total Workforce |
4,044 | 3,825 | ||||||
|
|
|
|
14. Income tax
Income tax expense is as follows:
For the years ended December 31, |
||||||||
2020 | 2019 | |||||||
(EUR thousand) | ||||||||
Current income tax: |
||||||||
Current Taxes |
28,604 | 18,883 | ||||||
Prior Years Taxes |
918 | 1,620 | ||||||
Deferred tax: |
||||||||
Deferred Taxes |
(11,840 | ) | (4,496 | ) | ||||
|
|
|
|
|||||
Income tax expense reported in the statement of profit or loss |
17,682 | 16,007 | ||||||
|
|
|
|
For the years ended December 31, |
||||||||
2020 | 2019 | |||||||
(EUR thousand) | ||||||||
Deferred tax related to items recognised in OCI during in the year: |
||||||||
Gains/(losses) from remeasurement of employee of defined benefit plans and actuarial valuation of funds |
15 | 86 | ||||||
Change in the fair value of hedging instruments |
173 | 216 | ||||||
|
|
|
|
|||||
Deferred tax charged to OCI |
188 | 302 | ||||||
|
|
|
|
F-45
The table below provides a reconciliation between actual income tax expense and the theoretical income tax expense, calculated on the basis of the applicable corporate tax rate in effect in Italy.
For the years ended December 31, |
||||||||
2020 | 2019 | |||||||
(EUR thousand) | ||||||||
Accounting profit before tax |
96,279 | 54,714 | ||||||
|
|
|
|
|||||
Accounting profit before income tax |
96,279 | 54,714 | ||||||
|
|
|
|
|||||
Statutory income tax rate of 27.9% |
26,862 | 15,265 | ||||||
Prior periods tax |
187 | 1,797 | ||||||
Unrecognized DTA on Tax losses |
(41 | ) | 720 | |||||
Taxes effect on unremitted earnings |
1,248 | 210 | ||||||
Utilization of tax losses carryforward not recognized on DTA |
| (1,759 | ) | |||||
Not deductible expenses |
| 535 | ||||||
Step up |
(7,926 | ) | | |||||
Change notional rate |
361 | | ||||||
Tax grants/not taxable items |
(1,415 | ) | (626 | ) | ||||
Different foreign tax rate effect |
(1,594 | ) | (135 | ) | ||||
|
|
|
|
|||||
At the effective income tax rate of 18.4% (29.3% in 2019) |
17,682 | 16,007 | ||||||
|
|
|
|
|||||
Income tax expense reported in the statement of profit or loss |
17,682 | 16,007 |
Effective groups tax rate significantly dropped from 2019, mainly due the following three factors:
| Nuova Ompi S.r.l. opted to step up the tax net book value of part of its machinery, by taking advantage from the August Decree. The law allows Italian companies to revalue the tax value of the assets, by paying a 3% one off tax on the higher value and deducting future depreciation at a notional tax rate; the tax saving amounts to EUR 7,926 thousand; |
| Nuova Ompi S.r.l. in 2020, after concluding a series of investments in machinery, started to fully benefit from the so called industry 4.0 hyper depreciation, an Italian tax contribution aimed at supporting companies investing in high technology equipment; |
| Ompi of China, in 2020, concluded the procedure to obtain the so called high tech license, a Chinese law that allows companies investing in R&D to benefit from a reduced corporate tax rate (15 % instead of the notional 25%). |
Unrecognized tax losses as at December 31, 2020 and as at December 31, 2019 amounts to EUR 8,794 thousand and to EUR 10,853 thousand respectively.
The breakdown on the timing of tax losses carryforwards is as follows:
At December 31, 2020 |
At December 31, 2019 |
|||||||
(EUR thousand) | ||||||||
Timing of unrecognized tax losses carryfoward |
||||||||
2022 |
15 | 15 | ||||||
2023 |
306 | 305 | ||||||
2024 |
336 | 334 | ||||||
2025 |
304 | 300 | ||||||
2026 |
262 | 303 | ||||||
2027 |
283 | | ||||||
Unlimited |
7,288 | 9,596 | ||||||
|
|
|
|
|||||
Total unrecognized tax losses |
8,794 | 10,853 | ||||||
|
|
|
|
F-46
The analysis of deferred tax assets and deferred tax liabilities as at December 31, 2020 and 2019 is as follows:
Consolidated statement of financial position |
||||||||||||
At December 31, 2020 |
At December 31, 2019 |
At January 1, 2019 |
||||||||||
(EUR thousand) | ||||||||||||
Other intangibles assets |
(3,914 | ) | (3,175 | ) | (2,276 | ) | ||||||
Tangible assets |
10,530 | 6,795 | 5,494 | |||||||||
Work in progress |
(4,581 | ) | (1,689 | ) | (1,726 | ) | ||||||
Profit in stock |
| 692 | 627 | |||||||||
Revaluations of investment properties to fair value |
9,104 | 223 | 223 | |||||||||
Expected credit losses of debt financial assets |
1,683 | 1,446 | 585 | |||||||||
Derivatives |
1,056 | 883 | 667 | |||||||||
Leases |
178 | 103 | | |||||||||
Long term incentives |
1,057 | 525 | 253 | |||||||||
Pension |
| 23 | 94 | |||||||||
Cash settled awards |
5,120 | 4,534 | 4,172 | |||||||||
Provisions |
5,413 | 5,207 | 4,498 | |||||||||
Accruals and other provisions |
906 | 1,171 | 181 | |||||||||
Tax losses carry forward |
8,636 | 6,343 | 4,725 | |||||||||
Dividends |
(1,200 | ) | (210 | ) | (294 | ) | ||||||
Other effects |
(59 | ) | (201 | ) | 283 | |||||||
Deferred tax assets, net |
33,929 | 22,669 | 17,506 | |||||||||
|
|
|
|
|
|
|||||||
Reflected in the statement of financial position as follows: |
||||||||||||
Deferred tax assets |
45,552 | 33,098 | 28,396 | |||||||||
Deferred tax liabilities |
(11,623 | ) | (10,429 | ) | (10,890 | ) | ||||||
|
|
|
|
|
|
|||||||
Deferred tax assets, net |
33,929 | 22,669 | 17,506 | |||||||||
|
|
|
|
|
|
Deferred taxes are calculated based on the global allocation criteria, taking into account the cumulative amount of all the temporary differences, based on the average expected rates in force when these temporary differences reverse.
Deferred tax assets are recorded if there is the reasonable certainty that the temporary differences will reverse in future years against assessable income not lower than the differences that will be reversed. In assessing the realizability of deferred tax assets, management considers whether it is probable that some portion or all of the deferred tax assets will not be realised. The ultimate realisation of deferred tax assets is dependent upon the generation of future taxable income during the periods in which those temporary differences become deductible and the tax loss carry-forwards are utilised.
The reconciliation of net deferred tax liabilities is as follows:
2020 | 2019 | |||||||
(EUR thousand) | ||||||||
As of January 1 |
22,669 | 17,506 | ||||||
Tax expense during the period recognised in profit or loss |
11,840 | 4,496 | ||||||
Tax income/(expense) during the period recognised in OCI |
188 | 302 | ||||||
Other effect |
(768 | ) | 365 | |||||
|
|
|
|
|||||
As at December 31 |
33,929 | 22,669 | ||||||
|
|
|
|
F-47
The other effect movement includes foreign exchange differences and minor reclassifications.
15. Earnings per Share
Basic earnings per share (EPS) is calculated by dividing into the profit attributable to equity holders of the parent by the weighted average number of common shares issued net of the treasury shares held by the Group and the vested awards under the 2012-2021 incentive plan. The Company gives consideration to all potentially dilutive impacts in calculating Diluted Earnings per Share and determined there are no dilution impacts as of December 31, 2020 and 2019, resulting in basic and diluted earnings per share being the same for all periods presented.
The shareholders meetings held on March 4, 2021 and on July 1, 2021 approved, respectively, two different share splits, as explained further in Note 41. The number of ordinary shares outstanding has been retrospectively adjusted as if such events had occurred at the beginning of the earliest period presented.
The following table reflects the income and share data used in the basic and diluted EPS calculation:
At December 31, 2020 |
At December 31, 2019 |
|||||||
(EUR thousand) | ||||||||
Profit attributable to ordinary equity holders of the parent |
78,513 | 39,201 | ||||||
Weighted average number of ordinary shares for basic EPS |
240,501,960 | 240,501,960 | ||||||
|
|
|
|
|||||
Weighted average number of ordinary shares adjusted for the effect of dilution |
|
240,501,960 |
|
240,501,960 | ||||
|
|
|
|
|||||
2020 | 2019 | |||||||
Basics earnings per common share (in EUR) |
0.33 | 0.16 | ||||||
Diluded earnings per common share (in EUR) |
0.33 | 0.16 |
16. Goodwill
In accordance with IAS 36Impairment of assets, Goodwill is tested for impairment annually, or more frequently if facts or circumstances indicate that the asset may be impaired. Impairment testing is performed by comparing the carrying amount and the recoverable amount of the CGU to which it is allocated. The recoverable amount of the CGU is the higher of its fair value less costs of disposal and its value in use.
Stevanato Group is organized in two main operating segments: Biopharmaceutical and Diagnostic Solutions and Engineering. Each segment comprehends different legal entities:
| the Biopharmaceutical and Diagnostic Solutions segment is focused on the production of container closure systems (syringes, pen and dental cartridges, vials for liquid and lyophilized drugs and ampoules) and the development and contract manufacturing of customer-specific, multi-component plastic products within pharma, diagnostics and medical. |
| the Engineering (Engineering System DivisionESD) segment is focused on advanced technologies and machinery for the transformation of glass tubing into containers for the pharmaceutical industry, for packaging & assembling of medical devices and for inspection of pharmaceutical products. |
For impairment test on goodwill purposes, the Management has identified two different cash-generating units (CGUs) within the Biopharmaceutical and Diagnostic Solutions segment, the Container Closure Systems (CCS) and the In-Vitro Diagnostic (IVD) consumables & Drug Delivery Systems (DDS) CGU, while within the ESD segment Stevanato Groups Management has not identified multiple CGUs.
F-48
Container closure systems offering includes a comprehensive portfolio of glass containers, pen and dental cartridges, vials for liquid and lyophilized drugs and ampoules. Syringes, cartridges and vials are produced both in bulk and sterilized formats. Furthermore, the Group offers a full range of analytical and testing services focused on investigating the physio-chemical properties of primary packaging materials and studying the interactions between container closure system and drugs. CCS has been considered as a CGU even if glass production plants are located in 5 different countries, because the production planning, marketing and selling is managed at a central level.
In-vitro diagnostic consumables & drug delivery systems offers CDMO and CMO to customer in the pharma, diagnostic and medical markets. The Groups business line provides integrated solutions from early development to lunched combination product. It offers a broad range of services, capabilities and technologies that are suited to support the device needs of biopharma companies. In-vitro diagnostic consumables & drug delivery systems has been considered as a CGU even if the group has two plants in two countries in the IVD & DDS, because the production is interchangeable: the Group can undertake the same production processes and plants/organizations cooperate in projects in order to provide the customer the same offering worldwide.
Engineering System DivisionESD offers machinery from the pharma sector including machinery for the transformation of glass tubing into containers, machinery for packaging and assembly of medical devices and machinery for inspection of pharmaceutical products. Engineering has been considered as a CGU because the product lines inside the engineering operations are strongly tied: shared teams work together in Italy and Denmark to produce the same machinery. Glass converting machines adopts packaging and assembly technologies to deliver the finished product. Furthermore, the three different types of machinery that the Group has in its product portfolio can be combined and offered to the customer as one single solution.
For the purpose of impairment testing, goodwill is allocated by CGU (cash generating unit) as follows:
At December 31, 2020 |
At December 31, 2019 |
At January 1, 2019 |
||||||||||
(EUR thousand) | ||||||||||||
Container Closure Systems |
4,976 | 4,976 | 4,976 | |||||||||
In-vitro Diagnostic Consumables & Drug Delivery Systems |
26,828 | 26,828 | 26,828 | |||||||||
Engineering Systems |
15,438 | 15,438 | 15,438 | |||||||||
Total Goodwill |
47,243 | 47,243 | 47,243 | |||||||||
The objective of the impairment test is to compare the recoverable amount of each CGU with their corresponding carrying amount of net assets including goodwill. The recoverable amount is the higher of an assets fair value less costs to sell and its value in use. The Group determines the value in use of the CGU to which the goodwill refers, meaning the present value of the future cash flows expected to be derived from continuous use of the assets; any cash flows arising from extraordinary events are therefore ignored.
In particular, value in use is determined by applying the discounted cash flow (DCF) method to forecast cash flows contained in plans prepared assuming realistic scenarios on the information available at the reporting date.
The growth rate in terminal values used for projecting beyond the explicit planning period (2021-2026) is 1% for all the CGUs, deemed representative of a precautionary growth rate in terminal values, given the potential future competition within the sector and the discount factor considered.
The cash flows and discount rate were determined net of tax. Future cash flows are discounted using the weighted average cost of capital (WACC); this is estimated with a beta factor derived on the basis of a peer group. The discount rate (6.40% for CCS and for IVD & DDS and 6.70% for ESD), used for the CGUs, reflects therefore current market assessments and the time value of money and takes account of the risks specific to the sector.
F-49
Recoverable amounts obtained through the value in use were however subject to sensitivity analysis, in order to establish how the value in use may alter based on a change in the profitability parameters utilised in the future cash flows or in the discount rate applied to such cash flows, considering each factor individually. Following these analyses, CGUs present expected cash flows would absorb normal changes in the parameters of the commonly used sensitivity analyses performed.
Finally, has been identified which discount rate and which alteration to the forecast EBITDA at Continuing Value within the impairment test would allow a value in use equal to the carrying amount of the net assets of the respective CGUs. This further sensitivity analysis resulted in the identification of breakeven for the CCS CGU with a WACC of 14.63%, or an average contraction of EBITDA at Continuing Value (everything else equal) of 39.66%. The same indicators for the IVD & DDS CGU were respectively 10.47% for the WACC and 32.90% for EBITDA at CV. With regards to the ESD CGU, these indicators equated to a reduction in the EBITDA at CV of 74.68% and a WACC of 20.40%.
The impairment test for the goodwill did not result in any need for impairment.
17. Intangible assets
Changes in intangible assets for the year ended December 31, 2020 are as follows:
Development costs |
Industrial patents and intellectual property rights |
Concessions, licences, trademarks and similar rights |
Intangible fixed assets in process and advances |
Other intangible assets |
Total | |||||||||||||||||||
(EUR thousand) | ||||||||||||||||||||||||
Cost |
||||||||||||||||||||||||
At January 1, 2019 |
4,968 | 10,588 | 24,198 | 10,316 | 9,538 | 59,607 | ||||||||||||||||||
Additions |
1,458 | 795 | 299 | 3,223 | 117 | 5,891 | ||||||||||||||||||
Disposal |
(423 | ) | (981 | ) | | | | (1,404 | ) | |||||||||||||||
Reclassifications |
7,422 | 880 | 466 | (9,883 | ) | 1,115 | | |||||||||||||||||
Exchange differences |
81 | 8 | 10 | (101 | ) | 81 | 79 | |||||||||||||||||
|
|
|
|
|
|
|
|
|
|
|
|
|||||||||||||
At December 31, 2019 |
13,505 | 11,290 | 24,973 | 3,554 | 10,851 | 64,174 | ||||||||||||||||||
Additions |
1,673 | 2,145 | 132 | 1,912 | 577 | 6,439 | ||||||||||||||||||
Reclassifications |
1,891 | 1,646 | 302 | (3,863 | ) | 24 | | |||||||||||||||||
Exchange differences |
44 | (222 | ) | (36 | ) | (15 | ) | (501 | ) | (731 | ) | |||||||||||||
|
|
|
|
|
|
|
|
|
|
|
|
|||||||||||||
At December 31, 2020 |
17,113 | 14,860 | 25,370 | 1,588 | 10,952 | 69,882 | ||||||||||||||||||
|
|
|
|
|
|
|
|
|
|
|
|
|||||||||||||
Amortisation |
||||||||||||||||||||||||
At January 1, 2019 |
3,233 | 7,678 | 9,143 | | 5,044 | 25,098 | ||||||||||||||||||
Amortisation |
1,592 | 1,419 | 1,843 | | 781 | 5,635 | ||||||||||||||||||
Disposal |
(423 | ) | (981 | ) | | | | (1,404 | ) | |||||||||||||||
Exchange differences |
| 7 | 1 | | 13 | 21 | ||||||||||||||||||
|
|
|
|
|
|
|
|
|
|
|
|
|||||||||||||
At December 31, 2019 |
4,401 | 8,123 | 10,987 | | 5,838 | 29,350 | ||||||||||||||||||
Amortisation |
2,569 | 1,622 | 1,837 | | 757 | 6,785 | ||||||||||||||||||
Exchange differences |
17 | (42 | ) | (6 | ) | | (122 | ) | (153 | ) | ||||||||||||||
|
|
|
|
|
|
|
|
|
|
|
|
|||||||||||||
At December 31, 2020 |
6,987 | 9,703 | 12,818 | | 6,472 | 35,982 | ||||||||||||||||||
|
|
|
|
|
|
|
|
|
|
|
|
|||||||||||||
Net book value |
||||||||||||||||||||||||
At December 31, 2020 |
10,125 | 5,156 | 12,552 | 1,588 | 4,479 | 33,901 | ||||||||||||||||||
|
|
|
|
|
|
|
|
|
|
|
|
|||||||||||||
At December 31, 2019 |
9,103 | 3,167 | 13,986 | 3,554 | 5,013 | 34,823 | ||||||||||||||||||
|
|
|
|
|
|
|
|
|
|
|
|
|||||||||||||
At January 1, 2019 |
1,735 | 2,910 | 15,055 | 10,316 | 4,494 | 34,510 | ||||||||||||||||||
|
|
|
|
|
|
|
|
|
|
|
|
F-50
Development costs are referred to costs for the study, design and prototype development for products which have been or are expected to be commercialised. Development expense is recognized in the consolidated income statement as Research and Development expenses.
Industrial patents and intellectual property rights increase in EUR 2,145 thousand due to the acquisition of licences for IT Systems and the capitalisation of costs associated with upgrading the ERP software.
Concessions, licences, trademarks and similar rights with a total carrying amount of EUR 12,552 thousand (EUR 13,986 thousand in 2019) mainly includes the tradenames related to Balda Group companies.
Intangible fixed assets in process and advances refer to ongoing projects which shall conclude in the subsequent years. The account includes development cost concerning the validation of new process and strategic products incurred before industrialization.
No impairment indicators have been identified for other intangible assets and therefore no impairment losses have been accounted for. No changes in the useful life of intangible assets have occurred in all periods presented.
18. Property, plant and equipment
Changes in items of property, plant and equipment in 2020 are as follows:
Land and buildings |
Plant and machinery |
Industrial and commercial equipment |
Other tangible assets |
Assets under construction and advances |
Total | |||||||||||||||||||
(EUR thousand) | ||||||||||||||||||||||||
Cost |
||||||||||||||||||||||||
At January 1, 2019 |
130,386 | 279,952 | 28,147 | 10,175 | 54,587 | 503,247 | ||||||||||||||||||
Additions |
5,316 | 41,578 | 2,688 | 1,271 | 18,504 | 69,358 | ||||||||||||||||||
Disposals |
(256 | ) | (3,247 | ) | | (538 | ) | (20 | ) | (4,062 | ) | |||||||||||||
Reclassifications |
11,655 | 33,636 | 2,487 | 145 | (47,922 | ) | | |||||||||||||||||
Exchange differences |
771 | 2,052 | 182 | 59 | 35 | 3,099 | ||||||||||||||||||
|
|
|
|
|
|
|
|
|
|
|
|
|||||||||||||
At December 31, 2019 |
147,872 | 353,971 | 33,503 | 11,112 | 25,184 | 571,642 | ||||||||||||||||||
Additions |
5,441 | 24,958 | 6,539 | 925 | 51,265 | 89,128 | ||||||||||||||||||
Disposals |
| (1,724 | ) | (40 | ) | (36 | ) | (3 | ) | (1,802 | ) | |||||||||||||
Reclassifications |
811 | 12,266 | 1,727 | 43 | (14,847 | ) | | |||||||||||||||||
Exchange differences |
(5,793 | ) | (13,569 | ) | (540 | ) | (728 | ) | (306 | ) | (20,936 | ) | ||||||||||||
|
|
|
|
|
|
|
|
|
|
|
|
|||||||||||||
At December 31, 2020 |
148,332 | 375,901 | 41,190 | 11,316 | 61,293 | 638,033 | ||||||||||||||||||
|
|
|
|
|
|
|
|
|
|
|
|
|||||||||||||
Depreciation and impairment |
||||||||||||||||||||||||
At January 1, 2019 |
53,836 | 175,157 | 21,805 | 6,821 | | 257,620 | ||||||||||||||||||
Depreciation charge for the year |
5,192 | 25,703 | 3,617 | 1,207 | | 35,719 | ||||||||||||||||||
Disposals |
(121 | ) | (3,231 | ) | | (516 | ) | | (3,868 | ) | ||||||||||||||
Exchange differences |
232 | 1,249 | 59 | 46 | | 1,586 | ||||||||||||||||||
|
|
|
|
|
|
|
|
|
|
|
|
|||||||||||||
At December 31, 2019 |
59,139 | 198,878 | 25,481 | 7,558 | | 291,056 | ||||||||||||||||||
Depreciation charge for the year |
5,384 | 30,121 | 4,610 | 1,037 | | 41,152 | ||||||||||||||||||
Impairment |
210 | | | | | 210 | ||||||||||||||||||
Disposals |
| (1,741 | ) | (12 | ) | (38 | ) | | (1,791 | ) | ||||||||||||||
Exchange differences |
(1,170 | ) | (4,454 | ) | (179 | ) | (450 | ) | | (6,253 | ) | |||||||||||||
|
|
|
|
|
|
|
|
|
|
|
|
|||||||||||||
At December 31, 2020 |
63,564 | 222,805 | 29,900 | 8,106 | | 324,375 | ||||||||||||||||||
|
|
|
|
|
|
|
|
|
|
|
|
|||||||||||||
Net book value |
||||||||||||||||||||||||
At December 31, 2020 |
84,768 | 153,097 | 11,290 | 3,210 | 61,293 | 313,658 | ||||||||||||||||||
|
|
|
|
|
|
|
|
|
|
|
|
|||||||||||||
At December 31, 2019 |
88,733 | 155,093 | 8,022 | 3,554 | 25,184 | 280,587 | ||||||||||||||||||
|
|
|
|
|
|
|
|
|
|
|
|
|||||||||||||
At January 1, 2019 |
76,550 | 104,795 | 6,342 | 3,354 | 54,587 | 245,627 | ||||||||||||||||||
|
|
|
|
|
|
|
|
|
|
|
|
F-51
The Groups property, plant and equipment mainly include:
| Land and buildings in the amount of EUR 84,768 thousand as at December 31, 2020 and EUR 88,733 thousand as at December 31, 2019, mainly consisting of industrial properties |
| Plant and machinery in the amount of EUR 153,097 thousand as at December 31,2020 and EUR 155,093 thousand as at December 31, 2019 including machine and equipment for producing glass and plastic containers for pharmaceutical use. |
The yearly increase in property, plant and equipment amounts to EUR 89,128 thousand, of which 70.8% to support the Group growth strategy.
Increase in Land and buildings principally concerns the construction of new industrial facilities mainly in the German and Mexican production plants and the purchase of land near the Headquarter premises in Piombino Dese, Italy. The investment amounting to approximately EUR 2.7 million is related to the construction of a new cleanroom in Germany. With reference to the Mexican plant, the increase amounting to about EUR 1 million is related to the first stage of conversion and expansion of a production facility which resulted also in an impairment of EUR 210 thousand for the dismantled section.
Increases in Plant and machinery, amounting to EUR 24,958 thousand, mainly refer to the purchase of new production equipment necessary to guarantee a high product quality standard and a high production capacity, characteristics necessary to consolidate the companys position in the biopharmaceutical market. Part of the annual capital expenditure in machinery is also related to the increasing production capacity due to the Covid-19 pandemic.
Assets under construction, amounting to EUR 61,293 thousand as at December 31, 2020 and EUR 25,184 thousand as at December 31, 2019, includes investments in machines for syringes, vials and cartridges production which have not yet been completed but are expected to enter into use in the coming year. This category also includes investments for upgrading the so called ex Superior production building located in Piombino Dese.
In 2019 this category also included investments for the extension and upgrading of building F, located in Piombino Dese, in order to make it suitable to house new production facilities as well as investments made by Stevanato Group for the construction of a new building to be used for production departments and offices. The production cost of plants included borrowing costs incurred to finance the operation. The capitalized borrowing costs amount to EUR 58 thousand for 2019. The rate used to determine the amount of borrowing costs that can be capitalized is equal to 1.48% for 2019. This rate refers to the average borrowing rate of the parent company which finances the investment.
At the year end, no impairment indicators have been identified and furthermore no need to reassess useful life of property, plants and equipment.
19. Investments in an associate
The Group has a 26.94% interest in Swissfillon AG, located in Switzerland, which is involved in sterile filling services. That company is not listed on any public stock exchange. The Groups interest in Swissfillon AG is accounted for using the equity method in the consolidated financial statements.
2020 | 2019 | |||||||
(EUR thousand) | ||||||||
At January 1 |
1,917 | 2,179 | ||||||
Proportionate share of net profit for the year |
92 | (262 | ) | |||||
|
|
|
|
|||||
At December 31 |
2,009 | 1,917 | ||||||
|
|
|
|
F-52
Summarised financial information relating to Swissfillon AG for the year ended December 31, 2020 and December 31, 2019:
At December 31, 2020 |
At December 31, 2019 |
At January 1, 2019 |
||||||||||
(EUR thousand) | ||||||||||||
Current assets |
3,256 | 1,682 | 2,408 | |||||||||
Non-current assets |
8,462 | 9,402 | 8,807 | |||||||||
Current liabilities |
3,429 | 1,962 | 2,317 | |||||||||
Non-current liabilities |
7,152 | 8,328 | 7,175 | |||||||||
|
|
|
|
|
|
|||||||
Equity |
1,138 | 794 | 1,723 | |||||||||
|
|
|
|
|
|
|||||||
Groups share in equity 26.94% |
306 | 214 | 464 | |||||||||
Goodwill |
1,729 | 1,729 | 1,729 | |||||||||
Exchange differences |
(26 | ) | (25 | ) | (14 | ) | ||||||
|
|
|
|
|
|
|||||||
Groups carrying amount of the investment |
2,009 | 1,917 | 2,179 | |||||||||
|
|
|
|
|
|
For the years ended December 31, |
||||||||
2020 | 2019 | |||||||
(EUR thousand) | ||||||||
Revenue from contracts with customers |
11,230 | 5,559 | ||||||
Cost of materials and services |
4,016 | 2,006 | ||||||
Personnel expenses |
3,616 | 2,035 | ||||||
Other operating expenses |
2,120 | 1,487 | ||||||
Depreciation and amortization |
946 | 824 | ||||||
Finance costs |
168 | 168 | ||||||
|
|
|
|
|||||
Profit before tax |
364 | (961 | ) | |||||
|
|
|
|
|||||
Income tax expense |
21 | 10 | ||||||
|
|
|
|
|||||
Net Profit |
343 | (971 | ) | |||||
|
|
|
|
|||||
Groups share of profit for the year |
92 | (262 | ) | |||||
|
|
|
|
20. Financial assetsinvestments FVTPL
Financial assets amount to EUR 760 thousand at December 31, 2020 (EUR 1,978 thousand at December 31, 2019), primarily include the investment in Biologix Partners LP, which is measured at fair value through profit or loss and amounts to EUR 74-5 thousand at December 31, 2020 (EUR 1,962 thousand at December 31, 2019). Additional disclosures on fair value measurement has been included on Note 30.
F-53
21. Financial assets
The following table details the composition of financial assets:
At December 31, 2020 |
At December 31, 2019 |
At January 1, 2019 |
||||||||||
(EUR thousand) | ||||||||||||
Receivables from financing activities |
5,956.09 | 5,897 | 5,377 | |||||||||
Other non-current financial assets |
745 | 713 | 602 | |||||||||
|
|
|
|
|
|
|||||||
Other non-current financial assets |
6,701 | 6,610 | 5,979 | |||||||||
|
|
|
|
|
|
|||||||
Fair value of derivatives financial instruments |
19 | 422 | 194 | |||||||||
Other securities |
41,523 | 40,884 | 40,144 | |||||||||
|
|
|
|
|
|
|||||||
Other current financial assets |
41,543 | 41,306 | 40,337 | |||||||||
|
|
|
|
|
|
|||||||
Financial Assets |
48,244 | 47,917 | 46,316 | |||||||||
|
|
|
|
|
|
Receivables from financing activities assets include financial loan for EUR 1,342 thousand as at December 31, 2020 (EUR 1,336 thousand as at December 31, 2019) granted to the associate Swissfillon AG to fund the development projects and financial loan of EUR 4,614 thousand as at December 31, 2020 (EUR 4,561 thousand as at December 31, 2019) in favour of a restricted number of key managers in connection with a cash settled award.
Other securities include guaranteed investment funds managed by Société Générale SA, which are measured at fair value.
22. Inventories
Inventories, shown net of an allowance for obsolete and slow-moving goods, can be analysed as follows:
At December 31, 2020 |
At December 31, 2019 |
At January 1, 2019 |
||||||||||
(EUR thousand) | ||||||||||||
Raw materials |
41,889 | 40,083 | 36,000 | |||||||||
Semifinished products |
46,479 | 45,344 | 30,804 | |||||||||
Finished products |
55,394 | 46,890 | 39,715 | |||||||||
Advances to suppliers |
7,920 | 12,818 | 4,058 | |||||||||
Provision from slow moving and obsolescence |
(12,309 | ) | (13,252 | ) | (11,967 | ) | ||||||
|
|
|
|
|
|
|||||||
Total inventories |
139,373 | 131,882 | 98,611 | |||||||||
|
|
|
|
|
|
The accrual of the provision for slow moving and obsolete inventories recognized within cost of sales during 2020 and 2019 is EUR 2,109 thousand and EUR 1,416 thousand respectively. Changes in the provision for slow moving and obsolete inventories are as follows:
2020 | 2019 | |||||||
(EUR thousand) | ||||||||
As at January 1 |
13,252 | 11,967 | ||||||
Provision |
2,109 | 1,416 | ||||||
Utilizations and other changes |
(3,053 | ) | (131 | ) | ||||
|
|
|
|
|||||
As at December 31 |
12,309 | 13,252 | ||||||
|
|
|
|
F-54
23. Trade receivables and contract assets
Trade receivables and contract assets are analysed as follows:
At December 31, 2020 |
At December 31, 2019 |
At January 1, 2019 |
||||||||||
(EUR thousand) | ||||||||||||
Trade receivables |
135,514 | 135,397 | 135,072 | |||||||||
Allowance for expected credit losses |
(7,696 | ) | (7,355 | ) | (3,849 | ) | ||||||
|
|
|
|
|
|
|||||||
Total trade receivables |
127,818 | 128,042 | 131,223 | |||||||||
|
|
|
|
|
|
|||||||
Expected credit loss rate |
5.7 | % | 5.4 | % | 2.8 | % |
Trade receivables are non-interest bearing and are generally on term of 60 to 90 days. The Group is not exposed to significant concentration of third-party credit risk.
Trade receivables breakdown by geographical area is shown below:
At December 31, 2020 |
At December 31, 2019 |
|||||||
(EUR thousand) | ||||||||
EM EA |
67,884 | 78,874 | ||||||
APAC |
15,637 | 12,204 | ||||||
North America |
37,261 | 28,540 | ||||||
South America |
14,732 | 15,780 | ||||||
|
|
|
|
|||||
Total Trade Receivables |
135,514 | 135,397 | ||||||
|
|
|
|
Trade receivables are stated net of an allowance for expected credit losses which has been determined in accordance with IFRS 9 amounting to EUR 7,696 thousand and EUR 7,355 thousand for 2020 and 2019 respectively:
2020 | 2019 | |||||||
(EUR thousand) | ||||||||
As at January 1 |
7,355 | 3,849 | ||||||
Accruals |
1,631 | 3,721 | ||||||
Releases |
(552 | ) | (66 | ) | ||||
Utilizations |
(374 | ) | (231 | ) | ||||
Exchange differents |
(364 | ) | 81 | |||||
|
|
|
|
|||||
As at December 31 |
7,696 | 7,355 | ||||||
|
|
|
|
Contract assets
Contract assets relate to revenue earned from ongoing customer-specific construction contracts of the Engineering segment and from the In-vitro diagnostic business. As such, the balances of this account vary and depend on the number of ongoing construction contracts at the end of the year. The Group has contract assets of EUR 39,430 thousand as at December 31, 2020 (EUR 32,536 thousand as at December 31, 2019). Contract assets gross amounts to EUR 86,905 thousand (EUR 63,196 thousand as at December 31, 2019), net of invoices issued of EUR 47,476 thousand (EUR 30,660 thousand as at December 31, 2019).
F-55
24. Tax receivables and tax payables
The breakdown in the account is as follows:
At December 31, | At December 31, | At January 1, | ||||||||||
2020 | 2019 | 2019 | ||||||||||
(EUR thousand) | ||||||||||||
Tax Receivables |
25,033 | 26,356 | 20,695 | |||||||||
Tax Payables |
(19,126 | ) | (5,692 | ) | (13,086 | ) |
Tax receivables amount remains basically flat, formed by VAT receivables (EUR 10,845 thousand in 2020, EUR 11,768 thousand in 2019), CIT advance payments (EUR 5,658 thousand in 2020, EUR 6,779 thousand in 2019) credit for tax grants (EUR 4,887 thousand in 2020, EUR 3,281 thousand in 2019), other indirect taxes receivables in Brazil (EUR 3,643 thousand in 2020, EUR 4,528 thousand in 2019).
Tax liabilities increased significantly compared to 2019, mainly due to increased CIT liabilities (EUR 13,019 thousand in 2020 compared to EUR 1,268 thousand in 2019, because of increased taxable profits in 2020 and lower advance taxes paid in 2020), the one-off tax for asset step-up in Nuova Ompi (EUR 954 thousand) and the suspended withholding taxes on salaries due to Covid-19 support in Denmark (EUR 1,630 thousand).
25. Other receivables
Other receivables are disclosed as follows:
At December 31, | At December 31, | At January 1, | ||||||||||
2020 | 2019 | 2019 | ||||||||||
(EUR thousand) | ||||||||||||
Advances to Suppliers |
416 | 309 | 382 | |||||||||
Accrued Income and Prepayments |
2,105 | 2,358 | 2,709 | |||||||||
Other receivables |
1,458 | 1,408 | 1,989 | |||||||||
|
|
|
|
|
|
|||||||
Total other receivables |
3,979 | 4,075 | 5,080 | |||||||||
|
|
|
|
|
|
26. Cash and cash equivalents
This balance consists of bank current accounts and other cash equivalents.
As at December 31, 2020, the Group has Cash and cash equivalents of EUR 115,599 thousand compared to EUR 85,386 thousand in the previous year; the variation is mainly driven by the profitability of the business as well as improvement in the trade working capital.
27. Equity
The main objective of the Groups capital management is to guarantee maintenance of a solid credit rating and adequate financial ratios with a view to supporting business activity and maximizing value for the shareholders.
Movements in the equity accounts are reported in the Consolidated Statements of Changes in Equity; comments on the main components and their changes are provided below.
Share capital
Prior to the share splits as disclosed in Note 41, the fully paid up share capital of the Company at December 31, 2020 and at December 31, 2019 was EUR 20,002 thousand, consisting of 20,002 ordinary shares with a
F-56
nominal value of EUR 1,000. The amounts of ordinary shares disclosed in this note have been retrospectively adjusted to reflect the share split occurred on March 4, 2021 and July 1, 2021, respectively, resulting in a total number of ordinary shares outstanding at December 31, 2020 and at December 31, 2019 of 272,427,240.
Treasury shares
Prior to the share splits disclosed in Note 41, a total of 2,092 of Companys ordinary shares were held in treasury at December 31, 2020 and 2019, for a total cost of EUR 26,189 thousand. The amounts of ordinary shares held in treasury disclosed in this note have been retrospectively adjusted to reflect the share splits occurred on March 4, 2021 and July 1, 2021, respectively, resulting in a total number of ordinary shares held in treasury at December 31, 2020 and 2019 of 28,493,040 thousand.
Cash flow hedge reserve
Cash flow hedge reserve reflects the negative change in fair value of derivatives financial instruments, designated as cash flow hedges to hedge highly probable forecast transactions.
Reserve for actuarial gains/losses on employee benefits
Reserve for actuarial gains/losses on employee benefits includes actuarial gains and losses on the net defined employees benefit liability.
Currency translation reserve
The currency translation reserve includes the cumulative foreign currency translation differences arisen from the translation of financial statements denominated in currencies other than Euro; as at December 31, 2020 it amounts to EUR 34,911 compared to EUR 12,331 thousand as at December 31, 2019. The high increase is mainly due to the depreciation against Euro of the Mexican Peso, the Brazilian Real and the US Dollar occurred in 2020, currencies in which the net assets of some of the companies belonging to the Group are denominated.
Retained earnings and other reserves
Retained earnings and other reserves include:
| a legal reserve of EUR 4,000 thousand as at December 31, 2020 and as at December 31, 2019; |
| other reserves of EUR 36,008 thousand at December 31, 2020 (EUR 38,376 thousand at December 31, 2019); |
| retained earnings of the consolidated companies net of the effects of consolidation adjustments of EUR 237,091 thousand (EUR 205,750 as at December 31, 2019). |
Net profit attributable to equity holders of the parent
Net Profit attributable to equity holders of the parent amount to EUR 78,513 thousand as at December 31, 2020 (EUR 39,201 thousand as at December 31, 2019).
Non-controlling interests
Non-controlling interests amount to EUR (355) thousand as at December 31, 2020 (EUR (50) thousand as at December 31, 2019). For further detail refer to Note 37.
F-57
Capital Management
The Groups objectives when managing capital are to create value for shareholders as a whole, safeguard business continuity and support the sustainable growth of the Group. As a result, the Group endeavors to maintain a satisfactory economic return for its shareholders and guarantee economic access to external sources of funds.
28. Dividends
Following approval of the annual accounts by the shareholders at the Annual General Meeting of the Shareholders in June 11, 2020 a dividend distribution of EUR 0.44 thousand per common share was approved, corresponding to a dividend paid in of EUR 8,900 thousand in 2020. The distribution was made partially from the other reserve and from retained earnings.
With reference to 2019, in June 28, 2019, a dividend distribution of EUR 0.31 thousand per common share was approved, corresponding to a dividend paid in of EUR 6,170 thousand in 2019. The distribution was made from the other reserve.
29. Financial liabilities
Total financial liabilities are EUR 375,358 thousand and EUR 386,056 thousand as of December 31, 2020 and as of December 31, 2019 respectively; the balances in financial debt are as follows:
At December 31, 2020 |
At December 31, 2019 |
At January 1, 2019 |
||||||||||
(EUR thousand) | ||||||||||||
Lease liabilitiesRight of Use |
5,435 | 4,881 | 3,394 | |||||||||
Bank overdrafts |
581 | 2,091 | 4,751 | |||||||||
Bank loans |
61,905 | 62,250 | 45,927 | |||||||||
Financial liabilities with related parties |
968 | 1,005 | 584 | |||||||||
Fair value of derivatives |
4,417 | 3,690 | 3,247 | |||||||||
Financial payables for shares acquisition |
7,927 | | | |||||||||
|
|
|
|
|
|
|||||||
Total current financial liabilities |
81,234 | 73,917 | 57,904 | |||||||||
|
|
|
|
|
|
|||||||
Lease liabilitiesRight of Use |
20,186 | 21,259 | 17,232 | |||||||||
Bank loans |
224,365 | 284,182 | 245,185 | |||||||||
Notes |
49,573 | | | |||||||||
Financial payables for shares acquisition |
| 6,698 | 5,275 | |||||||||
|
|
|
|
|
|
|||||||
Total non-current financial liabilities |
294,124 | 312,139 | 267,692 | |||||||||
|
|
|
|
|
|
|||||||
Financial liabilities |
375,358 | 386,056 | 325,596 | |||||||||
|
|
|
|
|
|
Other current financial liabilities include the liability of EUR 6,706 thousand (EUR 6,698 thousand in 2019, classified as non-current) recognized in relation to the put option granted to non-controlling shareholders of SVM Automatik A/S. According to the share purchase agreement, the put option calculation is based on a multiple of the subsidiarys EBITDA, considered with different scenarios of EBITDA specific targeted values, net of financial liabilities. The fair value of the put option has been measured considering the actual EBITDA arising from the financial statements of the subsidiary for the three years period 2018-2020, assuming the minority shareholders is going to exercise the option from January 1, 2021. Other current financial liabilities include also EUR 1,221 thousand as at December 31, 2020 which refer to the unpaid amount of the purchase of the residual shares of Medirio SA as well as earn out obligations, both due in 2021.
On April 16, 2020 Stevanato Group entered into a note purchase and private shelf agreement with PGIM, Inc. and certain of its affiliates, pursuant to which, for a period of three years following the date of the agreement,
F-58
Stevanato may issue, and PGIM, Inc. or certain of its affiliates may purchase, up to USD 69,540 thousand of Stevanato notes. Additionally, on the same date, Stevanato Group issued EUR 50,000 thousand of Senior Notes, Series A, due April 16, 2028 to PGIM, Inc. Repayment of the Notes is required to be made in two tranches, EUR 25,000 thousand on April 16, 2027, and the remainder at the expiration of the notes. Pursuant to the agreement, Nuova Ompi s.r.l. provided to PGIM, Inc. and its affiliates a subsidiary guarantee, guaranteeing the repayment of the notes.
The following table shows maturities and average interest rates for liabilities to banks and other lenders:
As at December 31, 2020
Currency | Amount | Maturity | Average Interest Rate |
Amount in EUR | ||||||||||||||
Bank Loans |
EUR | 62,169 | 2021 | 0.86 | % | 62,169 | ||||||||||||
EUR | 66,251 | 2022 | 0.91% | 66,251 | ||||||||||||||
EUR | 65,467 | 2023 | 0.97% | 65,467 | ||||||||||||||
EUR | 56,156 | 2024 | 1.08% | 56,156 | ||||||||||||||
EUR | 28,843 | 2025 | 1.29% | 28,843 | ||||||||||||||
EUR | 7,488 | 2026 | 1.36% | 7,488 | ||||||||||||||
EUR | 591 | 2027 | 0.94% | 591 | ||||||||||||||
Amortized Cost |
EUR | (695 | ) | 2021-2027 | (695 | ) | ||||||||||||
|
|
|||||||||||||||||
Total Bank Loans |
286,270 | |||||||||||||||||
|
|
|||||||||||||||||
Notes |
EUR | 25,000 | 2027 | 1.40 | % | 25,000 | ||||||||||||
EUR | 25,000 | 2028 | 1.40% | 25,000 | ||||||||||||||
Amortized Cost |
EUR | (427 | ) | 2021-2028 | (427 | ) | ||||||||||||
|
|
|||||||||||||||||
Total Notes |
49,573 | |||||||||||||||||
|
|
|||||||||||||||||
Overdrafts |
DKK | 4,321 | 2021 | 1.25 | % | 581 | ||||||||||||
|
|
|||||||||||||||||
Total Bank Loans and Overdrafts |
336,423 | |||||||||||||||||
|
|
As at December 31, 2019
Currency | Amount | Maturity | Average Interest Rate |
Amount in EUR | ||||||||||||||
Bank Loans |
EUR | 62,571 | 2020 | 0.85 | % | 62,571 | ||||||||||||
EUR | 61,730 | 2021 | 0.86% | 61,730 | ||||||||||||||
EUR | 66,026 | 2022 | 0.91% | 66,026 | ||||||||||||||
EUR | 65,241 | 2023 | 0.98% | 65,241 | ||||||||||||||
EUR | 55,928 | 2024 | 1.08% | 55,928 | ||||||||||||||
EUR | 28,545 | 2025 | 1.29% | 28,545 | ||||||||||||||
EUR | 7,187 | 2026 | 1.38% | 7,187 | ||||||||||||||
EUR | 289 | 2027 | 0.94% | 289 | ||||||||||||||
Amortized Cost |
EUR | (1,086 | ) | 2020-2027 | (1,086 | ) | ||||||||||||
|
|
|||||||||||||||||
Total Bank Loans |
346,433 | |||||||||||||||||
|
|
|||||||||||||||||
Overdrafts |
DKK | 15,626 | 2020 | 1.25 | % | 2,091 | ||||||||||||
|
|
|||||||||||||||||
Total Bank Loans and Overdrafts |
348,524 | |||||||||||||||||
|
|
Financial liabilities are recognized according to the amortized cost method and require compliance with certain financial covenants on the Group consolidated figures, more specifically the following ratios are monitored: Net Financial Debt on EBITDA, Net Financial Debt on Equity, EBITDA on Financial Charges.
As at December 31, 2020 and as at December 31, 2019, all financial covenants are complied with.
F-59
Some short-term payables are subject to secured guarantee, please refer to Note 39.
Other current financial assets and other financial liabilities relates to foreign exchange derivatives. The following table sets further the analysis of derivative assets and liabilities at December 31, 2020 and December 31, 2019.
At December 31, 2020 |
At December 31, 2019 |
At January 1, 2019 |
||||||||||||||||||||||
Carrying amount |
Fair value |
Carrying amount |
Fair value |
Carrying amount |
Fair value |
|||||||||||||||||||
(EUR thousand) | ||||||||||||||||||||||||
Financial assets |
||||||||||||||||||||||||
Foreign exchange forward contracts |
19 | 19 | 422 | 422 | 194 | 194 | ||||||||||||||||||
Financial liabilities |
||||||||||||||||||||||||
Foreign exchange forward contracts |
16 | 16 | 10 | 10 | 468 | 468 | ||||||||||||||||||
Interest Rate Swap in cash flow hedges |
4,386 | 4,386 | 3,679 | 3,679 | 2,779 | 2,779 |
Derivatives on currency risk have not been designated as hedging instruments and reflect the change in the fair value of those foreign exchange forward contracts that are not designated in hedge relationships, but are, nevertheless, intended to reduce the level of foreign currency risk for expected sales.
Derivatives designated as hedging instruments reflect the change in fair value of the interest rate swap contract, designated as cash flow hedges to hedge fluctuations in variable interest rate on loans. The amount recorded in the cash flow hedge reserve will be recognized in the consolidated income statement according to the timing of the cash flows of the underlying transaction.
30. Fair Value Measurement
IFRS 13 establishes a hierarchy that categorizes into three levels the inputs to the valuation techniques used to measure fair value by giving the highest priority to quoted prices (unadjusted) in active markets for identical assets and liabilities (level 1 inputs) and the lowest priority to unobservable inputs (level 3 inputs). In some cases, the inputs used to measure the fair value of an asset or a liability might be categorized within different levels of the fair value hierarchy. In those cases, the fair value measurement is categorized in its entirety in the same level of the fair value hierarchy at the lowest level input that is significant to the entire measurement.
Levels used in the hierarchy are as follows:
| Level 1: The fair value of financial instruments traded in active markets (such as publicly traded derivatives, and equity securities) is based on quoted market prices at the end of the reporting period. The quoted market price used for financial assets held by the group is the current bid price. These instruments are included in level 1. |
| Level 2: The fair value of financial instruments that are not traded in an active market (for example, over-the-counter derivatives) is determined using valuation techniques which maximise the use of observable market data and rely as little as possible on entity-specific estimates. If all significant inputs required to fair value an instrument are observable, the instrument is included in level 2. |
| Level 3: If one or more of the significant inputs is not based on observable market data, the instruments included in level 3. This is the case for unlisted equity securities. |
F-60
Assets and liabilities that are measured at fair value on a recurring basis
The following table shows the fair value hierarchy for financial assets and liabilities that are measured at fair value on a recurring basis at December 31, 2020:
Fair value measurement using | ||||||||||||||||||||
Note | Total | Level 1 | Level 2 | Level 3 | ||||||||||||||||
(EUR thousand) | ||||||||||||||||||||
Cash and cash equivalents |
26 | 115,599 | 115,599 | | | |||||||||||||||
Equity Investments others |
20 | 760 | | | 760 | |||||||||||||||
Derivatives financial assets |
21 | 19 | | 19 | | |||||||||||||||
Financial current assets |
21 | 41,523 | | 41,523 | | |||||||||||||||
Other non-current financial assets |
610 | | 610 | | ||||||||||||||||
|
|
|
|
|
|
|
|
|||||||||||||
Total assets |
158,512 | 115,599 | 42,153 | 760 | ||||||||||||||||
|
|
|
|
|
|
|
|
|||||||||||||
Put & Call related to financial liabilities |
29 | 6,706 | | | 6,706 | |||||||||||||||
Bonds at amortized cost |
29 | 49,573 | | 49,573 | | |||||||||||||||
Derivatives financial liabilities |
29 | 4,417 | | 4,417 | | |||||||||||||||
Payables for subsidiary acquisition |
29 | 1,221 | | | 1,221 | |||||||||||||||
|
|
|
|
|
|
|
|
|||||||||||||
Total Liabilities |
61,917 | | 53,990 | 7,927 | ||||||||||||||||
|
|
|
|
|
|
|
|
As at December 31, 2019:
Fair value measurement using | ||||||||||||||||||||
Note | Total | Level 1 | Level 2 | Level 3 | ||||||||||||||||
(EUR thousand) | ||||||||||||||||||||
Cash and cash equivalents |
26 | 85,386 | 85,386 | | | |||||||||||||||
Equity Investments others |
20 | 1,962 | | | 1,962 | |||||||||||||||
Derivatives financial assets |
21 | 422 | | 422 | | |||||||||||||||
Financial current assets |
21 | 40,884 | | 40,884 | | |||||||||||||||
Other non-current financial assets |
550 | | 550 | | ||||||||||||||||
|
|
|
|
|
|
|
|
|||||||||||||
Total assets |
129,204 | 85,386 | 41,856 | 1,962 | ||||||||||||||||
|
|
|
|
|
|
|
|
|||||||||||||
Put & Call related to financial liabilities |
29 | 6,698 | | | 6,698 | |||||||||||||||
Derivatives financial liabilities |
29 | 3,690 | | 3,690 | | |||||||||||||||
|
|
|
|
|
|
|
|
|||||||||||||
Total Liabilities |
10,388 | | 3,690 | 6,698 | ||||||||||||||||
|
|
|
|
|
|
|
|
The fair value of current financial assets and other financial liabilities is measured by taking into consideration market parameters at the balance sheet date, using valuation techniques widely accepted in the financial business environment.
The fair value of foreign currency derivatives (forward contracts, currency swaps and options) and interest rate swaps is determined by considering the prevailing foreign currency exchange rate and interest rates, as applicable, at the balance sheet date.
The value of cash and cash equivalents usually approximates fair value due to the short maturity of these instruments, which consist of bank current accounts. The fair value of other financial assets is measured through other unobservable input in accordance with IFRS 13, detailed in Note 20.
The fair value of Liabilities measured at amortized cost include bank loans; in 2020 Stevanato Group has issued the following debt securities:
F-61
Purchaser |
Date of Sale or Issuance | Number of Securities | Consideration | |||||||||
PGIM, Inc |
April 16, 2020 | 1 | EUR 50,000,000 |
No borrowings of the Group are listed debt. The fair value of Put and Call refers to option for full acquisition of SVM Automatik A/S (the minority interests amount to 35%) and it is measured as described in Note 29, that produces a negative adjustment in profit or loss for EUR 8 thousand as at December 31, 2020 (EUR 1,423 thousand as at December 31, 2019).
There are no transfers between Level 1, Level 2 and Level 3 during 2020 and 2019.
The fair value of the loans accounted for at amortized cost approximates their carrying amounts as of December 31, 2020 and 2019.
31. Employee benefits
Employee benefits are analysed as follows:
At December 31, 2020 |
At December 31, 2019 |
At January 1, 2019 |
||||||||||
(EUR thousand) |
||||||||||||
Employee Severance Pay |
5,791 | 5,801 | 5,534 | |||||||||
Jubilee benefits |
239 | 220 | 183 | |||||||||
Other Post-employment plans |
582 | 493 | 353 | |||||||||
Long term incentive plan |
1,780 | 1,138 | 1,060 | |||||||||
Cash settled awards |
21,333 | 18,893 | 17,382 | |||||||||
|
|
|
|
|
|
|||||||
Total employee benefits |
29,725 | 26,545 | 24,512 | |||||||||
|
|
|
|
|
|
Defined benefit obligationsItalian employee severance indemnity (TFR)
Trattamento di fine rapporto or TFR relates to the amounts that employees in Italy are entitled to receive when they leave the company and is calculated based on the period of employment and the taxable earnings of each employee. Under certain conditions the entitlement may be partially advanced to an employee during the employees working life.
The Italian legislation regarding this scheme was amended by Law 296 of 27 December 2006 and subsequent decrees and regulations issued in the first part of 2007. Under these amendments, companies with at least 50 employees are obliged to transfer the TFR to the Treasury fund managed by the Italian state-owned social security body (INPS) or to supplementary pension funds. Prior to the amendments, accruing TFR for employees of all Italian companies could be managed by the company itself. Consequently, the Italian companies obligation to INPS and the contributions to supplementary pension funds take the form, under IAS 19 revised, of Defined contribution plans whereas the amounts recorded in the provision for employee severance pay retain the nature of Defined benefit plans. Accordingly, the provision for employee severance indemnity in Italy consists of the residual obligation for TFR until December 31, 2006. This is an unfunded defined benefit plan as the benefits have already been almost entirely earned, with the sole exception of future revaluations. Since 2007 the scheme has been classified as a defined contribution plan, and the Group recognizes the associated cost, being the required contributions to the pension funds, over the period in which the employee renders service.
Jubilee benefits
Jubilee benefits scheme are applicable to companies incorporated in Germany. Upon retirement, employees are eligible to receive a sum payment depending on the number of years of service within the group.
F-62
Other post-employment plans
Other post-employment plan granted by the Group are Beneficios por Retiro, Prima de Antigüedad y Beneficios por Terminación for Mexican companies and severance payment provision for Slovak companies.
A major assumption taken into account in the valuation of pension and other post-employment benefit obligations is the discount rate. In accordance with IAS 19 Employee Benefits, the rates were determined by currency areas and by reference to the return on high-quality private bonds with a maturity equal to the term of the plans or the return on government bonds when the private market has insufficient liquidity. The return on plan assets is determined based on the allocation of the assets and the discount rates used.
Defined benefits obligation
The Groups liabilities for employee benefits are as follows:
Trattamento Fine Rapporto |
Jubilee Benefits |
Beneficio por Retiro / Terminacion |
Severance Payment Slovakia |
Total | ||||||||||||||||
(EUR thousand) | ||||||||||||||||||||
At January 1, 2019 |
5,534 | 183 | 332 | 20 | 6,069 | |||||||||||||||
Interest cost |
83 | 28 | 32 | 1 | 144 | |||||||||||||||
Current service cost |
395 | 18 | 68 | 4 | 485 | |||||||||||||||
Benefits paid |
(532 | ) | (9 | ) | | (2 | ) | (543 | ) | |||||||||||
Actuarial Gains and Losses |
321 | | 53 | 2 | 377 | |||||||||||||||
Exchange differences |
| | (18 | ) | | (18 | ) | |||||||||||||
|
|
|
|
|
|
|
|
|
|
|||||||||||
At December 31, 2019 |
5,801 | 220 | 468 | 26 | 6,514 | |||||||||||||||
|
|
|
|
|
|
|
|
|
|
|||||||||||
Recognized in the consolidated income statement |
477 | 46 | 101 | 5 | 629 | |||||||||||||||
Recognized in the other comprehensive income |
321 | | 53 | 2 | 377 | |||||||||||||||
Interest cost |
43 | 2 | 32 | 1 | 79 | |||||||||||||||
Current service cost |
325 | 26 | 70 | 6 | 428 | |||||||||||||||
Benefits paid |
(412 | ) | (16 | ) | | (7 | ) | (434 | ) | |||||||||||
Actuarial Gains and Losses |
33 | 7 | 108 | 4 | 152 | |||||||||||||||
Exchange differences |
| | (126 | ) | | (126 | ) | |||||||||||||
|
|
|
|
|
|
|
|
|
|
|||||||||||
At December 31, 2020 |
5,791 | 239 | 552 | 31 | 6,612 | |||||||||||||||
|
|
|
|
|
|
|
|
|
|
|||||||||||
Recognized in the consolidated income statement |
368 | 36 | 103 | 7 | 514 | |||||||||||||||
Recognized in the other comprehensive income |
33 | | 108 | 4 | 145 |
The principal assumptions used for determining the obligations under the plan described are as follows:
As at December 31, 2020
Severance indemnity | ||||||||||||||||
Italy | Germany | Mexico | Slovakia | |||||||||||||
Discount Rate % |
0.34 | % | 1.00 | % | 8.25 | % | 4.50 | % | ||||||||
Future salary increases% |
0.50 | % | 4.50 | % | 6.00 | % | ||||||||||
Inflation rate % |
0.80 | % | 3.50 | % |
F-63
As at December 31, 2019
Severance indemnity | ||||||||||||||||
Italy | Germany | Mexico | Slovakia | |||||||||||||
Discount Rate % |
0.80 | % | 1.10 | % | 9.00 | % | 4.50 | % | ||||||||
Future salary increases% |
0.50 | % | 4.50 | % | 6.00 | % | ||||||||||
Inflation rate % |
1.20 | % | 3.50 | % |
The discount rates used for the measurement of the pension plan obligation (including Italian TFR obligation) are based on yields of high-quality (AAA rated for Mexico and AA rated for other countries) fixed income securities for which the timing and amounts of payments match the timing and amounts of the projected benefit payments. The main variation is due to Italian TFR, whose average duration is approximately 14.8 years. Retirement or employee leaving rates are developed to reflect actual and projected Group experience and legal requirements for retirement.
A quantitative sensitivity analysis for significant assumptions impacting defined benefits obligation as at December 31, 2020 and December 31, 2019 is reported as follows:
At December 31, 2020 |
At December 31, 2019 |
|||||||
(EUR thousand) | ||||||||
Turnover rate +1,00% |
(57 | ) | (53 | ) | ||||
Turnover rate -1,00% |
65 | 60 | ||||||
Inflation rate +0,25% |
100 | 100 | ||||||
Inflation rate -0,25% |
(97 | ) | (97 | ) | ||||
Annual discount rate +0,25% |
(137 | ) | (137 | ) | ||||
Annual discount rate -0,25% |
143 | 143 |
The above sensitivity analysis on TFR is based on reasonable changes in key assumptions occurring at the end of the reporting period, keeping all other assumptions constant.
Such analysis may not be representative of an actual change in the defined benefit obligation as it is unlikely that changes in assumptions would occur in isolation from one another.
Long-term Incentive plan
In order to align the interests of management with those of the Shareholders over the medium/long-term by establishing a strong link between remuneration and performance the CEO approved a medium/long-term pan called the Long-term Incentive plan for the 2018-2020 three-year period and involving a select number of Senior Management (Top Management and/or Key People) of the Companies of the Group and based on the meeting of the long-term industrial plan objectives. This Long-term Incentive plan was terminated early in 2020 with the partial payment of the benefits accrued and a new one was launched for the four-year period 2020-2023.
F-64
The Groups liability for the Long-term Incentive plans is as follows:
2018- 2020 |
2020- 2023 |
Total | ||||||||||
(EUR thousand) | ||||||||||||
At January 1, 2019 |
1,060 | | 1,060 | |||||||||
Interest cost |
1 | | 1 | |||||||||
Current service cost |
1,061 | | 1,061 | |||||||||
Actuarial Gains and Losses * |
(985 | ) | | (985 | ) | |||||||
|
|
|
|
|
|
|||||||
At December 31, 2019 |
1,138 | | 1,138 | |||||||||
|
|
|
|
|
|
|||||||
Interest cost |
(0 | ) | | (0 | ) | |||||||
Current service cost |
284 | 1,780 | 2,064 | |||||||||
Benefits paid |
(1,003 | ) | | (1,003 | ) | |||||||
Actuarial Gains and Losses * |
(419 | ) | | (419 | ) | |||||||
|
|
|
|
|
|
|||||||
At December 31, 2020 |
0 | 1,780 | 1,780 | |||||||||
|
|
|
|
|
|
* | According to IAS 19, Actuarial Gains and Losses are recognized in profit or loss |
The discount rates used for the measurement of the Long-term Incentive plan are based on yields of high-quality (AA rated). For these plans, the single weighted average discount rate that reflects the estimated timing and amount of the scheme future benefit payments is equal to -0.27% for 2020 and to -0.11% for 2019 respectively. The main impact considered as actuarial gain and losses relates to the experience adjustment; it has been accounted together with the current service cost by function as part of personnel costs.
Cash settled awards
Cash settled awards are incentive plans aimed at a limited number of executives and key resources of the Group. The 2012-2021 incentive plan and the 2018-2022 incentive plans were approved by the Board of Directors on February, 9 2021 and on September, 12 2018 respectively.
The plans provide for the free assignment to the Groups employees of non-transferable options to subscribe shares at a pre-determined exercise price. The right to the assignment of options, to be exercised only during the exercise period, is acquired during the vesting period only if the turnover targets indicated in the business plan, based on EBITDA (earnings before interest, tax, depreciation and amortization) and net financial position, are achieved.
The following table summarise the components of the cash settled awards obligation expense recognized in the statement of profit or loss and amounts recognized in the statement of financial position:
2012-2021 | 2018-2022 | Total | ||||||||||
(EUR thousand) | ||||||||||||
At January 1, 2019 |
13,880 | 3,503 | 17,383 | |||||||||
Interest cost |
17 | 15 | 32 | |||||||||
Current service cost |
| 3,510 | 3,510 | |||||||||
Actuarial Gains and Losses* |
(441 | ) | (1,591 | ) | (2,032 | ) | ||||||
|
|
|
|
|
|
|||||||
At December 31, 2019 |
13,456 | 5,437 | 18,893 | |||||||||
|
|
|
|
|
|
|||||||
Interest cost |
(15 | ) | (6 | ) | (21 | ) | ||||||
Current service cost |
| 2,715 | 2,715 | |||||||||
Actuarial Gains and Losses |
(103 | ) | (151 | ) | (254 | ) | ||||||
|
|
|
|
|
|
|||||||
At December 31, 2020 |
13,338 | 7,995 | 21,333 | |||||||||
|
|
|
|
|
|
F-65
* | According to IAS 19, Actuarial Gains and Losses are recognized in profit or loss |
Cash-settled awards are based on Groups performance indicators, such as a fixed multiple of earnings before interest, tax, depreciation and amortization (EBITDA) net of the financial position. The cash-settled award 2012-2021is expected to be settled in the period between January 1, 2022 and July 31, 2022 and the cash-settled award 2018-2022 in the period between January 1, 2023 to July 31, 2023. These obligations are therefore measured as the present value of expected future payments to be made in respect of services provided by some key managers and directors up to the end of the reporting period, using the projected unit credit method. Expected future payments are discounted using market yields at the end of the reporting period of high-quality corporate bonds with terms and currencies that match, as closely as possible, the estimated future cash outflows. Remeasurements as a result of experience adjustments and changes in actuarial assumptions are recognized in profit or loss.
The discount rates used for the measurement of the Cash settled awards are based on yields of high-quality (AA rated). For these plans, the single weighted average discount rate that reflects the estimated timing and amount of the scheme future benefit payments is, respectively, equal to -0.27% (-0.11% in 2019) for the award 2012-2021 and -0.18% (0.06% in 2019) for the award 2018-2022. The turnover rate is 3% for both plans.
32. Provisions
The balances as of December 31, 2020 are detailed below:
Provision for Warranty |
Decommissioning | Provision for legal and sundry risks |
Provision for agents and directors severance indemnity |
Total | ||||||||||||||||
(EUR thousand) | ||||||||||||||||||||
At January 1, 2020 |
1,141 | 548 | 1,259 | 998 | 3,946 | |||||||||||||||
Arising during the year |
52 | 23 | 772 | 139 | 985 | |||||||||||||||
Utilised |
| | (46 | ) | | (46 | ) | |||||||||||||
Unused amounts reversed |
(134 | ) | | (258 | ) | | (392 | ) | ||||||||||||
Exchange rate difference |
2 | (48 | ) | (63 | ) | | (109 | ) | ||||||||||||
|
|
|
|
|
|
|
|
|
|
|||||||||||
At December 31, 2020 |
1,061 | 523 | 1,664 | 1,136 | 4,384 | |||||||||||||||
|
|
|
|
|
|
|
|
|
|
|||||||||||
Current |
| | | | | |||||||||||||||
Non-current |
1,061 | 523 | 1,664 | 1,136 | 4,384 |
Provision for Warranty |
Decommissioning | Provision for legal and sundry risks |
Provision for agents and directors severance indemnity |
Total | ||||||||||||||||
(EUR thousand) | ||||||||||||||||||||
At January 1, 2019 |
794 | 515 | 917 | 834 | 3,060 | |||||||||||||||
Arising during the year |
347 | 23 | 669 | 164 | 1,202 | |||||||||||||||
Utilised |
| | (327 | ) | | (327 | ) | |||||||||||||
Unused amounts reversed |
| | 0 | | 0 | |||||||||||||||
Exchange rate difference |
(0 | ) | 10 | 1 | | 10 | ||||||||||||||
|
|
|
|
|
|
|
|
|
|
|||||||||||
At December 31, 2019 |
1,141 | 548 | 1,259 | 998 | 3,946 | |||||||||||||||
|
|
|
|
|
|
|
|
|
|
|||||||||||
Current |
| | | | | |||||||||||||||
Non-current |
1,141 | 548 | 1,259 | 998 | 3,946 |
The warranty provision represents the best estimate of commitments given by the Group for contractual, legal, or constructive obligations arising from product warranties given for a specified period of time. Such
F-66
provisions are recognized on shipment of the goods to the customers. The warranty provision is estimated on the basis of the Groups past experience and contractual terms. Related costs are recognized within cost of sales.
The provision for legal proceeding and sundry risks represents managements best estimate of the expenditures expected to be required to settle on otherwise resolve legal proceeding and disputes.
The yearly increase for EUR 772 thousand is partially related to a potential dispute with a customer and to claim towards personnel.
33. Other non-current liabilities
Other non-current liabilities as of December 31, 2020 and December 31, 2019 amount to EUR 1,808 thousand respectively EUR 739 thousand and are mainly related to holiday pay of Danish companies employees following the transition to the new Danish Holiday Act started in 2019.
34. Trade payables and other current liabilities
Trade payables and other current liabilities are detailed as follows:
At December 31, | At December 31, | At January 1, | ||||||||||
2020 | 2019 | 2019 | ||||||||||
(EUR thousand) | ||||||||||||
Trade payables |
118,740 | 95,051 | 91,772 | |||||||||
Payables to social security institutions |
5,651 | 5,331 | 4,372 | |||||||||
Payables to personnel |
25,868 | 22,468 | 22,317 | |||||||||
Accrued Income and Prepayments |
3,509 | 2,915 | 948 | |||||||||
Other current liabilities |
8,655 | 10,052 | 7,755 | |||||||||
|
|
|
|
|
|
|||||||
Total trade payables and other current liabilities |
162,423 | 135,818 | 127,163 | |||||||||
|
|
|
|
|
|
The book value of trade payables is approximately equal to their fair value. Terms and condition of the above financial liabilities:
| Trade payables are non-interest bearing and are normally settled on 60 to 90-day term; |
| Other payables are non-interest bearing and have an average term of six months. |
Other current liabilities include customer returns that reflect the improved estimate on expected liabilities against future expected returns regarding revenues recognized in the current or in previous years, estimated on the basis of past experience.
35. Contract liabilities and advances from customers
Contract liabilities and advances from customers are as follows:
At December 31, | At December 31, | At January 1, | ||||||||||
2020 | 2019 | 2019 | ||||||||||
(EUR thousand) | ||||||||||||
Contract Liabilities |
5,031 | 5,623 | 7,851 | |||||||||
Advances from customers |
48,361 | 41,892 | 37,901 | |||||||||
|
|
|
|
|
|
|||||||
Total contract liabilities and advances from customers |
53,392 | 47,515 | 45,752 | |||||||||
|
|
|
|
|
|
|||||||
Current |
53,392 | 47,515 | 45,752 | |||||||||
Non-current |
| | |
F-67
Contract liabilities relate to revenue earned from ongoing customer-specific construction contracts of the Engineering System Division and of the In-vitro diagnostic business. The Group has contract net liabilities of EUR 5,031 thousand and EUR 5,623 thousand as at December 31, 2020 and December 31, 2019 respectively. Contract assets gross amounts to EUR 10,828 thousand (EUR 6,094 thousand in 2019), net of invoices issues of EUR 15,859 thousand (EUR 11,717 thousand in 2019).
Advances from customers relate to sales whose revenues are recognised at point in time.
36. Leases
The Group has lease contracts for various items of plant, machinery, vehicles and other equipment used in its operations. Leases of plant and machinery generally have lease terms between 3 and 15 years, while vehicles and other equipment generally have lease terms between 3 and 5 years. There are several lease contracts that include extension and termination options.
The Group also has certain leases of machinery with lease terms of 12 months or less and leases of office equipment with low value. The Group applies the short-term lease and lease of low-value assets recognition exemptions for these leases.
Movements in the leased Right of Use assets in 2020 are shown below:
Buildings | Plant and machinery |
Industrial equipment |
Other tangible assets |
Total | ||||||||||||||||
(EUR thousand) | ||||||||||||||||||||
Cost |
||||||||||||||||||||
At January 1, 2019 |
14,811 | 1,833 | | 4,160 | 20,804 | |||||||||||||||
Additions |
1,428 | 5,097 | 330 | 3,534 | 10,389 | |||||||||||||||
|
|
|
|
|
|
|
|
|
|
|||||||||||
At December 31, 2019 |
16,239 | 6,930 | 330 | 7,694 | 31,193 | |||||||||||||||
Additions |
2,602 | 1,760 | | 1,347 | 5,709 | |||||||||||||||
Exchange differences |
(871 | ) | | | (39 | ) | (911 | ) | ||||||||||||
|
|
|
|
|
|
|
|
|
|
|||||||||||
At December 31, 2020 |
17,969 | 8,691 | 330 | 9,002 | 35,992 | |||||||||||||||
|
|
|
|
|
|
|
|
|
|
|||||||||||
Depreciation |
||||||||||||||||||||
At January 1, 2019 |
| | | | | |||||||||||||||
Depreciation charge for the year |
2,239 | 852 | 65 | 1,705 | 4,861 | |||||||||||||||
Exchange differences |
(5 | ) | 0 | | (2 | ) | (6 | ) | ||||||||||||
|
|
|
|
|
|
|
|
|
|
|||||||||||
At December 31, 2019 |
2,234 | 852 | 65 | 1,703 | 4,854 | |||||||||||||||
Depreciation charge for the year |
2,523 | 1,515 | 66 | 1,852 | 5,956 | |||||||||||||||
Exchange differences |
(196 | ) | 15 | | (17 | ) | (198 | ) | ||||||||||||
|
|
|
|
|
|
|
|
|
|
|||||||||||
At December 31, 2020 |
4,561 | 2,382 | 131 | 3,538 | 10,612 | |||||||||||||||
|
|
|
|
|
|
|
|
|
|
|||||||||||
Net book value |
||||||||||||||||||||
At December 31, 2020 |
13,408 | 6,309 | 199 | 5,464 | 25,380 | |||||||||||||||
|
|
|
|
|
|
|
|
|
|
|||||||||||
At December 31, 2019 |
14,005 | 6,078 | 265 | 5,991 | 26,339 | |||||||||||||||
|
|
|
|
|
|
|
|
|
|
|||||||||||
At January 1, 2019 |
14,811 | 1,833 | | 4,160 | 20,804 | |||||||||||||||
|
|
|
|
|
|
|
|
|
|
F-68
Set out below are the carrying amounts of lease liabilities (included under interest-bearing loans and borrowings) and the movements during the period:
2020 | 2019 | |||||||
(EUR thousand) | ||||||||
At January 1 |
26,140 | 20,626 | ||||||
Additions |
5,599 | 9,821 | ||||||
Accretion of interest |
624 | 626 | ||||||
Payments |
(5,906 | ) | (4,741 | ) | ||||
Exchange difference |
(836 | ) | (192 | ) | ||||
|
|
|
|
|||||
At December 31 |
25,621 | 26,140 | ||||||
|
|
|
|
|||||
Current |
5,435 | 4,881 | ||||||
Non-current |
20,186 | 21,259 |
The following are the amounts recognized in profit or loss:
For the years ended December 31, |
||||||||
2020 | 2019 | |||||||
(EUR thousand) | ||||||||
Depreciation expense of Right of Use assets |
5,956 | 4,861 | ||||||
Interest expense on lease liabilities |
624 | 626 | ||||||
Expense relating to short-term leases |
1,901 | 481 | ||||||
Expense relating to leases of low-value assets |
3,744 | 3,815 | ||||||
|
|
|
|
|||||
Total amount recognised in profit or loss |
12,224 | 9,783 | ||||||
|
|
|
|
37. Subsidiaries with material non-controlling interest
The Stevanato Group comprises the following subsidiaries with material non-controlling interest:
Name |
Country |
At December 31, 2020 |
At December 31, 2019 |
At January 1, 2019 |
||||||||||
Ompi of Japan Co., Ltd. |
Japan | 49 | % | 49 | % | 49 | % | |||||||
M edirio SA |
Switzerland | 0 | % | 28 | % | 38 | % | |||||||
Medical Glass a.s. |
Slovakia | 0.26 | % | 0.26 | % | 0.26 | % | |||||||
SVM Automatik A/S* |
Denmark | 0 | % | 0 | % | 0 | % |
F-69
At December 31, 2020 |
At December 31, 2019 |
At January 1, 2019 |
||||||||||
(EUR thousand) | ||||||||||||
Proportion of equity interest held by non-controlling interests: |
||||||||||||
Ompi of Japan Co., Ltd. |
487 | 301 | 142 | |||||||||
Medirio SA |
| (700 | ) | (186 | ) | |||||||
Medical Glass a.s. |
(48 | ) | (45 | ) | (39 | ) | ||||||
SVM Automatik A/S* |
| | | |||||||||
|
|
|
|
|
|
|||||||
439 | (444 | ) | (83 | ) | ||||||||
|
|
|
|
|
|
|||||||
Profit allocated to material non-controlling interest: |
||||||||||||
Ompi of Japan Co., Ltd. |
(76 | ) | 202 | 149 | ||||||||
Medirio SA |
| 295 | 106 | |||||||||
Medical Glass a.s. |
(8 | ) | (3 | ) | (6 | ) | ||||||
SVM Automatik A/S* |
| | | |||||||||
|
|
|
|
|
|
|||||||
(84 | ) | 494 | 249 | |||||||||
|
|
|
|
|
|
* | Not included in minority interests as there is a put and call option for full acquisition (the minority interests would have amounted to 35%) |
Changes in non-controlling interests are shown in the consolidated statement of changes in equity. During the year 2019, the minority interest in Medirio changed from 38% to 28% with a respective movement in the non-controlling interest equity of EUR 597 thousand. In 2020 the Group acquired the remaining shares of Medirio determining a change in non-controlling interest equity of EUR (379) thousand.
The tables below show the summarized income statement for 2020:
Ompi of Japan Co., Ltd. |
Medical Glass a.s. |
|||||||
(EUR thousand) | ||||||||
Net Sales |
6,811 | 36,852 | ||||||
Cost of Sales |
5,509 | 30,039 | ||||||
|
|
|
|
|||||
Gross Profit |
1,302 | 6,813 | ||||||
|
|
|
|
|||||
Other operating income |
| 43 | ||||||
Selling and marketing expenses |
349 | 165 | ||||||
Research and development expenses |
157 | | ||||||
General and administrative expenses |
517 | 2,715 | ||||||
|
|
|
|
|||||
Operating profit |
278 | 3,976 | ||||||
|
|
|
|
|||||
Interest income |
17 | 2 | ||||||
Interest expense |
74 | 30 | ||||||
|
|
|
|
|||||
Profit before tax |
221 | 3,948 | ||||||
|
|
|
|
|||||
Income taxes |
66 | 834 | ||||||
|
|
|
|
|||||
Net Profit |
155 | 3,114 | ||||||
|
|
|
|
|||||
Total comprehensive income |
155 | 3,111 | ||||||
|
|
|
|
|||||
Attributable to non-controlling interests |
76 | 8 | ||||||
Dividends paid to non-controlling interests |
| |
F-70
The tables below show the summarized income statement for 2019:
Ompi of Japan Co., Ltd. |
Medirio SA | Medical Glass a.s. |
||||||||||
(EUR thousand) | ||||||||||||
Net Sales |
2,533 | | 32,811 | |||||||||
Cost of Sales |
2,207 | 0 | 27,661 | |||||||||
|
|
|
|
|
|
|||||||
Gross Profit |
326 | (0 | ) | 5,150 | ||||||||
|
|
|
|
|
|
|||||||
Selling and Marketing expenses |
451 | | 123 | |||||||||
Research and Development expenses |
156 | 1,013 | | |||||||||
General and Administrative expenses |
437 | 25 | 3,350 | |||||||||
|
|
|
|
|
|
|||||||
Operating profit |
(718 | ) | (1,038 | ) | 1,677 | |||||||
|
|
|
|
|
|
|||||||
Interest income |
161 | 4 | 4 | |||||||||
Interest expense |
31 | 3 | 20 | |||||||||
|
|
|
|
|
|
|||||||
Profit before tax |
(589 | ) | (1,037 | ) | 1,661 | |||||||
|
|
|
|
|
|
|||||||
Income taxes |
(176 | ) | 18 | 387 | ||||||||
|
|
|
|
|
|
|||||||
Net Profit |
(413 | ) | (1,055 | ) | 1,274 | |||||||
|
|
|
|
|
|
|||||||
Total comprehensive income |
(413 | ) | (1,055 | ) | 1,272 | |||||||
|
|
|
|
|
|
|||||||
Attributable to non-controlling interests |
(202 | ) | (295 | ) | 3 | |||||||
Dividends paid to non-controlling interests |
| | |
The tables below show the summarized financial position as at December 31, 2020:
Ompi of Japan Co., Ltd. |
Medical Glass a.s. |
|||||||
(EUR thousand) | ||||||||
Property, plant and equipment and other non-current assets |
530 | 12,477 | ||||||
Net working capital |
(628 | ) | 7,101 | |||||
Total non-current liabilities and provision |
| (596 | ) | |||||
|
|
|
|
|||||
Net capital employed |
(98 | ) | 18,982 | |||||
|
|
|
|
|||||
Net financial position |
(742 | ) | 2,711 | |||||
|
|
|
|
|||||
Total equity |
(840 | ) | 21,693 | |||||
|
|
|
|
|||||
Attributable to: |
||||||||
Equity holders of parent |
(428 | ) | 21,645 | |||||
Non-controlling interest |
(411 | ) | 56 |
The tables below show the summarized financial position as at December 31, 2019:
Ompi of Japan Co., Ltd. |
Medirio SA | Medical Glass a.s. |
||||||||||
(EUR thousand) | ||||||||||||
Property, plant and equipment and other non-current assets |
697 | 217 | 11,535 | |||||||||
Net working capital |
(465 | ) | (367 | ) | 5,781 | |||||||
Total non-current liabilities and provision |
| | (771 | ) | ||||||||
|
|
|
|
|
|
|||||||
Net capital employed |
232 | (150 | ) | 16,545 | ||||||||
|
|
|
|
|
|
|||||||
Net financial position |
(1,258 | ) | 1,593 | 2,029 | ||||||||
|
|
|
|
|
|
|||||||
Total equity |
(1,026 | ) | 1,443 | 18,575 | ||||||||
|
|
|
|
|
|
|||||||
Attributable to: |
||||||||||||
Equity holders of parent |
(523 | ) | 1,039 | 18,534 | ||||||||
Non-controlling interest |
(503 | ) | 404 | 48 |
F-71
38. Related party disclosures
According to IAS 24, the related parties of the Group are entities and individuals capable of exercising control, joint control or significant influence over the Group and its subsidiaries, companies belonging to the Stevanato Group S.p.A. the controlling company Stevanato Holding S.r.l., unconsolidated subsidiaries of the Group and associates. In addition, members of Stevanato Groups Board of Directors and executives with strategic responsibilities and their families are also considered related parties. The Group carries out transactions with related parties on commercial terms that are normal in the respective markets, considering the characteristics of the goods or services involved.
Note 4 provide information about the Groups structure, including details of the subsidiaries and the holding company.
Transaction with related parties refer to:
| revenues for closure containment solution from the associate Swissfillon AG; |
| service fees and rentals paid to Winkler & Co Ltd, the company whose owner holds minority interests in the subsidiary Ompi of Japan; |
| the purchase of products and rentals paid to Società Agricola Stella S.r.l., controlled by SFEM Italia S.r.l.; |
| rentals paid to SFEM Italia S.r.l., controlled by Stevanato family; |
| consulting services rented by MJB Consultants LLC, Progenitor Capital Partners LLC and Studio Legale Spinazzi Azzarita Troi, whose beneficial owners are Board members in Stevanato Group; |
| industrial rentals paid to E & FKH Ejendomme ApS, whose beneficial owners are family members of the minority shareholders of the subsidiary SVM; |
| rentals paid to members of Stevanato family. With reference to 2019, it includes also revenues for the sale of residential flat located in Punto Central (Mexico) from Ompi North America to Marco Stevanato for an aggregate amount of EUR 412 thousand; this transaction generated a gain of EUR 282 thousand as shown in the chart below. |
| in 2017 the Company disbursed a loan of EUR 1,069 thousand to Mr. Fabrizio Bonanni to facilitate the acquisition of shares under the cash settled award. Mr. Fabrizio Bonanni is a member of the board of Stevanato Group. Such loan has been fully reimbursed and terminated on March 10, 2021; |
| in 2017 the Company disbursed a loan of ERU 2,239 thousand to Mr. Mauro Stocchi to facilitate the acquisition of shares under the cash settled award. Mr. Mauro Stocchi is Chief Business Officer of Stevanato Group. |
| donations to the Stevanato Foundation, owned by Stevanato family. The foundation exclusively pursues the aims of social solidarity, philanthropy and charity, operating in the fields of social and socio-medical assistance, education and training as well as cultural and educational activities and scientific research. The Foundation intervenes in support of children and young people in situations of serious difficulty due to their illnesses, the distress of their families or other situations that may affect their health or growth. |
F-72
The amounts of transactions with related parties recognized in the consolidated income statement and the related assets and liabilities are as follows:
As at December 31, 2020 |
||||||||
Revenues | Costs* | |||||||
(EUR thousand) | ||||||||
Associate companies: |
||||||||
Swissfillon AG |
790 | | ||||||
Other related parties |
||||||||
Winckler & Co. Ltd. |
| 350 | ||||||
Società Agricola Stella S.r.l. |
| 72 | ||||||
SFEM Italia S.r.l. |
| 19 | ||||||
M JB Consultants LLC |
| 142 | ||||||
Progenitor Capital Parners LLC |
| 84 | ||||||
E & FKH Ejendomme ApS |
| 399 | ||||||
Piovesan Barbara |
| 30 | ||||||
Studio Legale Spinazzi Azzarita Troi |
| 536 | ||||||
Fondazione Stevanato |
| 155 |
* | Costs include cost of sale, selling, general administrative costs and other expenses net |
Trade receivables |
Trade payables |
Other Assets |
||||||||||
(EUR thousand) | ||||||||||||
Associate companies: |
||||||||||||
Swissfillon AG |
88 | | | |||||||||
Other related parties |
||||||||||||
Winckler & Co. Ltd. |
| 28 | | |||||||||
Società Agricola Stella S.r.l. |
| 25 | 24 | |||||||||
SFEM Italia S.r.l. |
| 2 | |
Loan from/to related parties
As at December 31, 2020
Interest received |
Interest paid | Financial assets or liabilities |
||||||||||
(EUR thousand) | ||||||||||||
Associate companies: |
20 | | 1,342 | |||||||||
Swissfillon AG |
||||||||||||
Other related parties |
||||||||||||
SE Holdings Co.Ltd. |
| 6 | (968 | ) | ||||||||
Key management personnel of the Group: |
||||||||||||
Directors |
53 | | 4,614 |
F-73
As at December 31, 2019
Revenues | Costs* | |||||||
(EUR thousand) | ||||||||
Associate companies: |
||||||||
Swissfillon AG |
168 | | ||||||
Other related parties |
||||||||
Winckler & Co. Ltd. |
| 499 | ||||||
Società Agricola Stella S.r.l. |
| 83 | ||||||
SFEM Italia S.r.l. |
| 19 | ||||||
M JB Consultants LLC |
| 150 | ||||||
Progenitor Capital Parners LLC |
| 89 | ||||||
E & FKH Ejendomme ApS |
| 391 | ||||||
Stevanato M arco |
| (282 | ) | |||||
Piovesan Barbara |
| 30 | ||||||
Stevanato Sergio |
| 98 | ||||||
Studio Legale Spinazzi Azzarita Troi |
| 294 | ||||||
Fondazione Stevanato |
| 130 |
* | Costs include cost of sale, selling, general administrative costs and other expenses net |
Trade receivables |
Trade payables |
|||||||
(EUR thousand) | ||||||||
Associate companies: |
||||||||
Swissfillon AG |
9 | | ||||||
Other related parties |
||||||||
Winckler & Co. Ltd. |
| 29 | ||||||
Società Agricola Stella S.r.l. |
| 15 | ||||||
Studio Legale Spinazzi Azzarita Troi |
| 25 |
Loan from/to related parties
As at December 31, 2019
Interest received |
Interest paid | Financial assets or liabilities |
||||||||||
(EUR thousand) | ||||||||||||
Associate companies: |
17 | | 1,336 | |||||||||
Swissfillon AG |
||||||||||||
Other related parties |
||||||||||||
SE Holdings Co.Ltd. |
| 5 | (1,005 | ) | ||||||||
Key management personnel of the Group: |
||||||||||||
Directors |
53 | | 4,561 |
F-74
Emoluments to Directors and Key Management
The fees of the Directors of Stevanato Group S.p.A. are as follows:
As at December 31, 2020
Fixed remuneration | ||||||||||||||||||||||||
Annual fee | Fringe benefits | Variable remuneration |
Pension expense (1) |
Long Term Benefits(2) |
Total remuneration |
|||||||||||||||||||
(EUR thousand) | ||||||||||||||||||||||||
Total Directors |
1,688 | 28 | | 50 | 412 | 2,178 | ||||||||||||||||||
|
|
|
|
|
|
|
|
|
|
|
|
(1) | Pensions expense related to Trattemento Fine Mandato accrued on the year |
(2) | Long term benefits related to cash settled awards |
As at December 31, 2019
Fixed remuneration | ||||||||||||||||||||||||
Annual fee | Fringe benefits | Variable remuneration |
Pension expense(1) |
Long Term Benefits(2) |
Total remuneration |
|||||||||||||||||||
(EUR thousand) | ||||||||||||||||||||||||
Total Directors |
1,475 | 21 | | 50 | 127 | 1,673 | ||||||||||||||||||
|
|
|
|
|
|
|
|
|
|
|
|
(1) | Pensions expense related to Trattemento Fine Mandato accrued on the year |
(2) | Long term benefits related to cash settled awards |
The aggregate compensation for members of the Senior Management Team (excluding the Chairman and the CEO) in 2020 and in 2019 is as follows:
As at December 31, 2020
Fixed remuneration | Variable remuneration(2) |
Pension expense(3) |
Long Term Benefits(4) |
Total remuneration |
||||||||||||||||||||
Annual fee | Fringe benefits | |||||||||||||||||||||||
(EUR thousand) | ||||||||||||||||||||||||
Total Other Key Management |
1,150 | 23 | 698 | 81 | 1,254 | 3,206 | ||||||||||||||||||
|
|
|
|
|
|
|
|
|
|
|
|
(1) | Fringe benefits related to car and insurance benefits |
(2) | Variable remuneration related to MBO |
(3) | Pensions expense related to Trattemento Fine Rapporto accrued on the year |
(4) | Long term benefits related to cash settled awards |
As at December 31, 2019
Fixed remuneration | Variable remuneration(2) |
Pension expense(3) |
Long Term Benefits(4) |
Total remuneration |
||||||||||||||||||||
Annual fee | Fringe benefits | |||||||||||||||||||||||
(EUR thousand) | ||||||||||||||||||||||||
Total Other Key Management |
1,231 | 19 | 305 | 86 | 723 | 2,364 | ||||||||||||||||||
|
|
|
|
|
|
|
|
|
|
|
|
(1) | Fringe benefits related to car and insurance benefits |
(2) | Variable remuneration related to MBO |
(3) | Pensions expense related to Trattemento Fine Rapporto accrued on the year |
(4) | Long term benefits related to cash settled awards |
F-75
39. Commitments and contingencies
Commitments, guarantees and contingent liabilities can be described as follows:
At December 31, 2020 |
At December 31, 2019 |
|||||||
(EUR thousand) | ||||||||
Guarantees |
86,633 | 74,896 | ||||||
of which secured |
4,704 | 4,684 | ||||||
|
|
|
|
|||||
Total Guarantees |
91,337 | 74,896 | ||||||
|
|
|
|
As at December 31, 2020 the main commitments and risks assumed by the Stevanato Group are as follows:
| Suretyship issued in favour of Nordea Bank for EUR 17,471 thousand (EUR 17,450 thousand in 2019) on behalf of SVM Automatik A/S; |
| Suretyship issued in favour of Nordea Bank for EUR 9,407 thousand (EUR 5,369 thousand in 2019) on behalf of Innoscan A/S; |
| Letter of Comfort in favour of Unicredit AG for EUR 15,000 thousand (EUR 13,000 thousand in 2019) on behalf of the company Balda Medical Gmbh. |
Secured guarantees for EUR 4,704 thousand (EUR 4,684 thousand in 2019) concern the floating charge on the Danish companies against short-term credit lines.
The guarantees provided by credit institutions and insurance companies on behalf of Group companies in favour of third parties amount to EUR 28,710 thousand (EUR 34,045 thousand in 2019) and mainly comprise advance payment and performance bond issued in favour of clients in the Engineering division and of Balda Medical GmbH.
40. Qualitative and quantitative information of financial risks
The Group is exposed to the following financial risks connected with its operations:
| financial market risk, mainly relating to foreign currency exchange rates and to interest rates; |
| liquidity risk, with particular reference to the availability of funds and access to the credit market, should the Group require it, and to financial instruments in general; |
| credit risk, arising both from its normal commercial relations with customers, and its financing activities. |
These risks could significantly affect the Groups financial position, results of operations and cash flows, and for this reason the Group identifies and monitors these risks, in order to detect potential negative effects in advance and take the necessary action to mitigate them, primarily through its operating and financing activities and if required, through the use of derivative financial instruments.
The following section provides qualitative and quantitative disclosures on the effect that these risks may have upon the Group. The quantitative data reported in the following section does not have any predictive value.
Financial market risks
Due to the nature of the Groups business, the Group is exposed to a variety of market risks, including foreign currency exchange rate risk and to a lesser extent, interest rate risk.
F-76
The Groups exposure to foreign currency exchange rate risk arises from our global footprint (both in terms of productions and commercialization), as in some cases we sell our products in the currencies of the destination markets, which may differ from the currency of the countries the Group operates in.
The Groups exposure to interest rate risk arises from the need to fund certain activities and the possibility to deploy surplus funds. Changes in market interest rates may have the effect of either increasing or decreasing the Groups net profit/ (loss), thereby indirectly affecting the costs and returns of financing and investing transactions.
These risks could significantly affect the Groups financial position, results of operations and cash flows, and for this reason they are identified and monitored, in order to detect potential negative effects in advance and take the necessary actions to mitigate them.
The Group has in place various risk management policies, which primarily relate to foreign exchange, interest rate and liquidity risks.
In particular, to manage foreign exchange rate risk, the Group has adopted a hedging policy, approved by the Board of Directors of Stevanato Group S.p.A.. Hedging activities are mainly executed at central level, based on the information provided by the reporting system and utilizing instruments and policies conforming to IFRS. Hedging is undertaken to ensure protection in case an entity has transactions in currencies other than the one in which it primarily does business, taking account also of budgeted future revenues/costs. Despite hedging operations, sudden movements in exchange rates or erroneous estimates may result in a negative impact, although limited, on Group results.
Information on foreign currency exchange rate risk
The Group is exposed to risk resulting from fluctuations in foreign currency exchange rates, which can affect its earnings and equity. In particular:
| Where a Group company incurs costs in a currency different from that of its revenues, any change in foreign currency exchange rates can affect the operating results of that company. |
| The main foreign currency to which the Group is exposed is the U.S. Dollar for sales in the United States and other markets where the U.S. Dollar is the reference currency, against Euro, Mexican Pesos and Renminbi. Other significant exposures included the exchange rate between the Euro and the following currencies: Renminbi, Japanese Yen, Danish Krone, British Pound and Swiss Franc. Only U.S. Dollar exposure, taken individually, exceeded 10% of the Groups total foreign currency exchange rate exposure for commercial activity in 2020. It is the Groups policy to use derivative financial instruments (primarily forward currency contracts, currency swaps, currency options and collar options) to hedge against exposures. |
| Several subsidiaries are located in countries that are outside the Eurozone, in particular the United States, China, Japan, Mexico, Denmark, Brazil, Switzerland. As the Groups reporting currency is the Euro, the income statements of those companies are translated into Euro using the average exchange rate for the period and, even if revenues and margins are unchanged in local currency, changes in exchange rates can impact the amount of revenues, costs and profit as restated in Euro. Similarly, intercompany financing may lead to foreign exchange rate impact due to different functional currencies. |
| The amount of assets and liabilities of consolidated companies that report in a currency other than the Euro may vary from period to period as a result of changes in exchange rates. The effects of these changes are recognized directly in equity as a component of other comprehensive income/ (loss) under gains/(losses) from currency translation differences. |
F-77
The Group monitors its main exposures with regard to translation exchange risk, whereby fluctuations in the exchange rates of a number of currencies against the consolidation currency may impact the consolidated financial statement values, although there was no specific hedging in this respect at the reporting date.
Exchange differences arising on the settlement of monetary items are recognized in the consolidated income statement within the net financial income/ (expenses) line item.
The impact of foreign currency exchange rate differences recorded within financial income/(expenses) for the year ended December 31, 2020, except for those arising on financial instruments measured at fair value, amounted to net losses of EUR 448 thousand (EUR 545 thousand in 2019).
There have been no substantial changes in 2020 in the nature or structure of exposure to foreign currency exchange rate risk or in the Groups hedging policies.
The Group actively hedges against economic-transactional risk; more specifically, forward and swap contracts, plain vanilla and collar options are used to manage the exposures. Such instruments are not currently designated as cash flow hedges and contracts are entered for a period consistent with the underlying transactions, generally from three to twelve months.
The Group is holding the following contracts:
As at December 31, 2020
0 to 6 months |
6 to 9 months |
9 to 12 months |
Total | Carrying amount |
Line item in the statement of financial position | |||||||||||||||||||
(EUR thousand) | ||||||||||||||||||||||||
Notional amount |
Forward | 19,554 | 19,554 | (12 | ) | current financial liabilities | ||||||||||||||||||
Average forward rate (EUR/DKK) |
7.447 | | ||||||||||||||||||||||
Notional amount |
Forward | 6,246 | 6,246 | 19 | other current financial assets | |||||||||||||||||||
Average forward rate (EUR/USD) |
1.230 | | ||||||||||||||||||||||
Notional amount |
Forward | 1,203 | 1,203 | (3 | ) | current financial liabilities | ||||||||||||||||||
Average forward rate (EUR/CHF) |
1.082 | | ||||||||||||||||||||||
Notional amount |
Forward | 1,008 | 1,008 | (0 | ) | current financial liabilities | ||||||||||||||||||
Average forward rate (EUR/JPY) |
126.55 | | ||||||||||||||||||||||
|
|
|
|
|||||||||||||||||||||
Total |
28,012 | 4 | ||||||||||||||||||||||
|
|
|
|
F-78
As at December 31, 2019
0 to 6 months |
6 to 9 months |
9 to 12 months |
Total | Carrying amount |
Line item in the statement of | |||||||||||||||||||
(EUR thousand) | ||||||||||||||||||||||||
Notional amount |
Forward | 2,670 | 7,121 | 11,465 | 21,257 | 308 | other current financial assets | |||||||||||||||||
Average forward rate (EUR/USD) |
1.119 | 1.125 | 1.131 | | ||||||||||||||||||||
Notional amount |
Option | 3,561 | 3,561 | 3,561 | 10,682 | 109 | other current financial assets | |||||||||||||||||
Average forward rate (EUR/USD) |
1.16 | 1.17 | 1.16 | | ||||||||||||||||||||
Notional amount |
Forward | 11,912 | 11,912 | (6 | ) | current financial liabilities | ||||||||||||||||||
Average forward rate (EUR/DKK) |
7.460 | | ||||||||||||||||||||||
Notional amount |
Forward | 1,198 | 1,198 | (4 | ) | current financial liabilities | ||||||||||||||||||
Average forward rate (EUR/CHF) |
1.085 | | ||||||||||||||||||||||
Notional amount |
Forward | 1,046 | 1,046 | 5 | other current financial assets | |||||||||||||||||||
Average forward rate (EUR/JPY) |
121.62 | | ||||||||||||||||||||||
Notional amount |
Forward | 189 | 189 | 0 | other current financial assets | |||||||||||||||||||
Average forward rate (EUR/CNY) |
7.901 | | ||||||||||||||||||||||
|
|
|
|
|||||||||||||||||||||
Total |
46,283 | 412 | ||||||||||||||||||||||
|
|
|
|
Information on interest rate risk
This risk stems from variable rate loans, for which sudden or significant interest rate fluctuations may have a negative impact on economic results. The monitoring of this risk is carried out at corporate level and utilising similar structures as those employed for the management of currency risks. The Group has hedges in place against interest rate risk, covering almost of the loans contracted. Thanks to these operations, the Group has established a substantially fixed rate at improved conditions compared to the previous loans.
The Groups most significant floating rate financial assets at December 31, 2020 are cash and cash equivalents and certain financial current investments.
The financial liabilities composition and the impact of the hedging instrument on the statement of financial position as at December 31, 2020 and December 31, 2019 are as follows:
As at December 31, |
IRS | FIX | Floating | Total nominal amount |
Effect amortized cost |
Total | MtM IRS Derivates |
Line item in the statement
of | ||||||||||||||||||||||
(EUR thousand) | ||||||||||||||||||||||||||||||
Bank loans |
229,772 | 12,838 | 44,355 | 286,964 | (695 | ) | 286,270 | (4,402 | ) | Current financial liabilities/ Non-current financial liabilities | ||||||||||||||||||||
Bank overdrafts |
581 | 581 | 581 | Other financial liabilities | ||||||||||||||||||||||||||
Financial payables for share acquisition |
7,927 | 7,927 | 7,927 | Current financial liabilities | ||||||||||||||||||||||||||
Financial liabilities with related parties |
968 | 968 | 968 | Current financial liabilities | ||||||||||||||||||||||||||
Notes |
50,000 | 50,000 | (427 | ) | 49,573 | Non-current financial liabilities | ||||||||||||||||||||||||
|
|
|
|
|
|
|
|
|
|
|
|
|
|
|||||||||||||||||
Total |
229,772 | 63,806 | 52,863 | 346,441 | (1,122 | ) | 345,319 | (4,402 | ) | |||||||||||||||||||||
|
|
|
|
|
|
|
|
|
|
|
|
|
|
|||||||||||||||||
Percentage on Total |
67 | % | 18 | % | 15 | % |
F-79
As at December 31, |
IRS | FIX | Floating | Total nominal amount |
Effect amortized cost |
Total | MtM IRS Derivates |
Line item in the statement of financial position | ||||||||||||||||||||||
(EUR thousand) | ||||||||||||||||||||||||||||||
Bank loans |
270,707 | 13,133 | 63,679 | 347,519 | (1,085 | ) | 346,434 | (3,679 | ) | Current financial liabilities/ Non-current financial liabilities | ||||||||||||||||||||
Bank overdrafts |
2,091 | 2,091 | 2,091 | Other financial liabilities | ||||||||||||||||||||||||||
Financial payables for share acquisition |
6,698 | 6,698 | 6,698 | Non-current financial liabilities | ||||||||||||||||||||||||||
Financial liabilities with related parties |
1,005 | 1,005 | 1,005 | Current financial liabilities | ||||||||||||||||||||||||||
|
|
|
|
|
|
|
|
|
|
|
|
|
|
|||||||||||||||||
Total |
270,707 | 14,138 | 72,468 | 357,313 | (1,085 | ) | 356,228 | (3,679 | ) | |||||||||||||||||||||
|
|
|
|
|
|
|
|
|
|
|
|
|
|
|||||||||||||||||
Percentage on Total |
76 | % | 4 | % | 20 | % |
The risk arising from to net investment in foreign subsidiaries is monitored; no active hedging is currently being performed. With regard to commodity risk, the Group enters into fixed-price contracts for certain utilities.
Set out below is the impact of hedging on equity in cash flow hedge reserve:
2020 | 2019 | |||||||
(EUR thousand) | ||||||||
As at 1 January |
2,796 | 2,112 | ||||||
Interest Rate Swap |
722 | 900 | ||||||
Tax effect |
(173 | ) | (216 | ) | ||||
|
|
|
|
|||||
As at 31 December |
3,345 | 2,796 | ||||||
|
|
|
|
The following table presents an analysis of sensitivity to a change in (i) interest rates on the portion of loans and borrowings affected, and (ii) exchange rates for the currencies the Group is majorly exposed to. With all other variables held constant, the Groups marginality is affected as follows:
As at December 31, 2020
Interest rate sensitivity
Increase/decrease in interest rate |
Effect on profit before tax |
|||||||||||||||
(EUR thousand) | ||||||||||||||||
+20 BP | -20 BP | (21 | ) | 11 | ||||||||||||
+50 BP | -50 BP | (111 | ) | 26 | ||||||||||||
+100 BP | -100 BP | (406 | ) | 53 |
Exchange rate sensitivity
Increase/decrease in percentage points |
Effect on EBITDA | |||||||||||||||
(EUR thousand) | ||||||||||||||||
Euro |
1 | % | -1 | % | (862 | ) | 879 | |||||||||
US dollar |
3 | % | -3 | % | (2,534 | ) | 2,691 | |||||||||
5 | % | -5 | % | (4,144 | ) | 4,580 | ||||||||||
Euro |
1 | % | -1 | % | 128 | (131 | ) | |||||||||
Mexican Pesos |
3 | % | -3 | % | 377 | (400 | ) | |||||||||
5 | % | -5 | % | 616 | (681 | ) |
F-80
As at December 31, 2019
Interest rate sensitivity
Increase/decrease in interest rate |
Effect on profit before tax |
|||||||||||||||
(EUR thousand) | ||||||||||||||||
+20 BP | -20 BP | (19 | ) | 19 | ||||||||||||
+50 BP | -50 BP | (195 | ) | 46 | ||||||||||||
+100 BP | -100 BP | (588 | ) | 93 |
Exchange rate sensitivity
Increase/decrease in percentage points |
Effect on EBITDA | |||||||||||||||
(EUR thousand) | ||||||||||||||||
Euro |
1 | % | -1 | % | (605 | ) | 617 | |||||||||
US dollar |
3 | % | -3 | % | (1,778 | ) | 1,888 | |||||||||
5 | % | -5 | % | (2,908 | ) | 3,214 | ||||||||||
Euro |
1 | % | -1 | % | 141 | (144 | ) | |||||||||
M exican Pesos |
3 | % | -3 | % | 414 | (440 | ) | |||||||||
5 | % | -5 | % | 677 | (749 | ) |
Liquidity risk
Liquidity risk arises if the Group is unable to obtain the funds needed to carry out its operations under economic conditions. The main determinant of the Groups liquidity position is the cash generated by or used in operating and investing activities.
From an operating point of view, the Group manages liquidity risk by monitoring cash flows and keeping an adequate level of funds at its disposal. The main funding operations and investments in cash and marketable securities of the Group are centrally managed or supervised by the treasury department with the aim of ensuring effective and efficient management of the Groups liquidity. The Group undertakes medium/long term loans to fund medium/long term operations. The Group undertakes a series of activities centrally supervised with the purpose of optimizing the management of funds and reducing liquidity risk, such as:
| centralizing liquidity management |
| maintaining a conservative level of available liquidity |
| diversifying sources of funding of medium and long term financing |
| obtaining adequate credit lines |
| monitoring future liquidity requirements on the basis of budget forecast and cash flow planning |
| monitoring covenants on indebtedness |
Intercompany financing is conducted at arms length terms and normally involves the holding company. These measures currently sufficiently guarantee, at normal conditions and in the absence of extraordinary events, the degree of flexibility required by movements of working capital, investing activities and cash flows in general.
The Group believes that its total available liquidity (defined as cash and cash equivalents plus undrawn committed credit lines and marketable securities), in addition to funds that will be generated from operating activities, will enable the Group to satisfy the requirements of its investing activities and working capital needs, fulfill its obligations to repay its debt and ensure an appropriate level of operating and strategic flexibility. The Group, therefore, believes there is no significant risk of a lack of liquidity.
F-81
The following table summarizes the due dates of the Groups financial and other liabilities at December 31, 2020 and at December 31, 2019 on the basis of contractual payments which have not been discounted:
As at December 31, 2020
Due within one year |
Due between one and five years |
Due beyond five years |
Total | |||||||||||||
(EUR thousand) | ||||||||||||||||
Bank overdrafts |
581 | | | 581 | ||||||||||||
Borrowings from banks (*) |
62,169 | 216,717 | 8,079 | 286,965 | ||||||||||||
Notes (*) |
| | 50,000 | 50,000 | ||||||||||||
Lease liabilities (**) |
5,954 | 14,868 | 7,706 | 28,528 | ||||||||||||
Other Financial liabilities |
8,896 | | | 8,896 | ||||||||||||
Trade payables |
118,740 | | | 118,740 | ||||||||||||
Tax payables |
19,126 | | | 19,126 | ||||||||||||
Other liabilities |
43,683 | 1,715 | 93 | 45,491 | ||||||||||||
Employee Benefits |
| 29,725 | | 29,725 | ||||||||||||
|
|
|
|
|
|
|
|
|||||||||
Total liabilities |
259,149 | 263,025 | 65,878 | 588,052 | ||||||||||||
|
|
|
|
|
|
|
|
(*) | The corresponding balance reported in the financial statement position is EUR 286,270 thousand and EUR 49,573 thousand respectively at 31 December 2020 |
(**) | The corresponding balance in the financial statement position is EUR 25,621 thousand and refers to adoption of IFRS 16. |
As at December 31, 2019
Due within one year |
Due between one and five years |
Due beyond five years |
Total | |||||||||||||
(EUR thousand) | ||||||||||||||||
Bank overdrafts |
2,091 | | | 2,091 | ||||||||||||
Borrowings from banks (*) |
62,571 | 248,925 | 36,022 | 347,518 | ||||||||||||
Lease liabilities (**) |
5,426 | 14,597 | 9,526 | 29,550 | ||||||||||||
Other Financial liabilities |
1,005 | 6,698 | | 7,703 | ||||||||||||
Trade payables |
95,051 | | | 95,051 | ||||||||||||
Tax payables |
5,692 | | | 5,692 | ||||||||||||
Other liabilities |
40,766 | 647 | 92 | 41,505 | ||||||||||||
Employee Benefits |
| 26,545 | | 26,545 | ||||||||||||
|
|
|
|
|
|
|
|
|||||||||
Total liabilities |
212,602 | 297,412 | 45,640 | 555,655 | ||||||||||||
|
|
|
|
|
|
|
|
(*) | The corresponding balance reported in the financial statement position is EUR 346,433 thousand and refers to adoption of amortized cost. |
(**) | The corresponding balance in the financial statement position is EUR 26,140 thousand and refers to adoption of IFRS 16. |
Credit risk
Credit risk is the risk of economic loss arising from the failure to collect a receivable. Credit risk encompasses the direct risk of default and the risk of a deterioration of the creditworthiness of the counterparty. The maximum credit risk to which the Group is theoretically exposed is represented by the carrying amounts of the financial assets stated in the consolidated statement of financial position sheet.
F-82
Where customers fail to meet payment deadlines, the Groups financial position may deteriorate. In addition, socio-political events (or country risks) and the general economic performance of individual countries or geographical regions may assume significance also in relation to this aspect. The trade receivable risk is however mitigated by consolidated commercial relations with high-standing pharma multi-nationals and Group guidelines drawn up for the selection and evaluation of the client portfolio, which may require, where possible and appropriate, further guarantees from customers.
Trade receivables as at December 31, 2020 amounting to EUR 135,514 thousand (EUR 135,397 thousand in 2019) are shown net of the allowance for doubtful accounts amounting to EUR 7,696 thousand (EUR 7,355 thousand in 2019).
40. Covid-19 Pandemic
At the beginning of 2020, the World Health Organization declared the existence of an international emergency following the spread of Covid-19 virus. Since the early stages of the spread of the epidemic, Stevanato Group has been strongly committed to safeguarding the health and safety of its employees, ensuring at the same time business continuity in all its premises. The company has implemented strict precautionary measures provided by national and regional regulations on personal and workplace hygiene, as well as on the organization of working life (such as reorganization of shifts) at its plants. It has adopted measures to avoid crowdings, maximizing the use of remote working, allowing access to external personnel only if in compliance with current legislation. Sensitization activities about the importance of prevention, both at work and home, have been made throughout the period, and screening activities among staff have been performed when needed to increase prevention further.
Short-term impacts of Covid-19 on Stevanato Group production and operational capabilities included: (i) labor absenteeism; (ii) disruptions to production lines; (iii) delays in, and increased costs of, logistics; (iv) short-term drop in sales of certain non- Covid-19 related orders which were cancelled and or postponed; and (v) increased labor costs in the form of employee bonuses to recognize and reward general efforts during the pandemic.
Long-term effects of Covid-19 have included the acceleration of the Group business plan and growth strategy due to a general increase in demand for our products, processes and services. A significant part of our production has been devoted to supporting our customers in providing a rapid response to Covid-19 since the inception of the pandemic. The group has been supplying: (i) glass vials and syringes to more than 80% of the treatment and vaccine programs in advanced development phases (Phase I to Phase III) according to our estimates based on public information about treatments and vaccines (WHO, EMA, FDA); (ii) plastic diagnostic consumables for the detection and diagnosis of Covid-19; (iii) glass forming lines, which are being installed worldwide, to facilitate the distribution of glass bulks and sterile vials and syringes; and (iv) visual inspections systems. The governmental measures adopted to contain the outbreak of Covid-19 have also impacted the Group ability to carry out business development activities in the past few months; we believe this may have an impact on our ability to broaden our customer portfolio in the immediate future. Currently, it is not possible to predict with certainty the full scope of the impact of Covid-19 on our business and operations given much rests on future developments of the outbreak.
41. Events after the reporting period
The Group has evaluated subsequent events through April 7, 2021, which is the date the Consolidated Financial Statements were authorized for issuance. Management retrospectively adjusted the amounts of ordinary
shares presented to effect the share splits occurred on March 4, 2021 and July 1, 2021, as further discussed below.
On January 20, 2021 Stevanato Group shareholders meeting approved the distribution of EUR 11,200 thousand dividends from other reserves.
F-83
On February 18, 2021, the Board of Directors appointed Mr. Franco Moro as Chief Executive Director while Mr. Franco Stevanato took over as Executive Chairman of the Board of Directors.
On March 4, 2021, the Shareholders meeting approved the so called Restricted Stock Grant Plan Stevanato Group S.p.A. 2021-2027 and empowered the Board of Directors to implement the incentive plan, including the identification of beneficiaries from personnel with strategic roles in the group.
With reference to the cash settled award 2012-2021, the Shareholders meeting approved to purchase from the beneficiaries up 29 shares at a minimum price of EUR 39.5 thousand and a maximum of EUR 40 thousand and of 875,000 shares at a minimum price of EUR 7.9 and a maximum of EUR 8 per share. This transaction must be carried out after the fulfilment of the capital requirements provided for in Article 2357 of Italian Civil Code and after the split of the parent companys share capital, and in any case no later than December 31, 2021.
With reference to the cash settled award 2018-2022, the Shareholders meeting acknowledged the resolution of the Board of Directors to revoke the incentive plan in accordance with article 3.5 of the relevant regulation and to allocate 17,500 treasury shares, following the share capital split, to be assigned free of charge to one of the beneficiaries of the plan subject to revocation.
On March 4, 2021, the extraordinary Shareholders meeting approved:
| the elimination of the indication of the nominal value of the 20,002 outstanding shares, |
| the issuance of additional 99,989,998 ordinary shares with no par value to be allocated free of charge to shareholders in proportion to the shares held by each of them, so that the share capital of EUR 20,002,000 is divided into a total of 100,010,000 ordinary shares with no par value, without giving rise to changes in the amount of the share capital. |
On July 1, 2021 the Shareholders meeting approved a further share split following which all the existing 100,010,000 shares have been split into a total of 272,427,240 shares in the ratio of 2,724 new shares post-split for each share outstanding prior to the share split.
F-84
Stevanato Group S.p.A.
Interim condensed consolidated income statements
for the three months ended March 31, 2021 and 2020
(Unaudited)
Notes | For the three months ended March 31, |
|||||||||
2021 | 2020 | |||||||||
(EUR thousand) | ||||||||||
Revenues |
9 | 192,849 | 136,431 | |||||||
Cost of sales |
10 | 127,440 | 96,927 | |||||||
|
|
|
|
|||||||
Gross profit |
65,409 | 39,504 | ||||||||
Other operating income |
11 | 3,225 | 255 | |||||||
Selling and Marketing expenses |
12 | 5,868 | 6,229 | |||||||
Research and Development expenses |
12 | 5,820 | 3,948 | |||||||
General and Administrative expenses |
12 | 14,007 | 14,198 | |||||||
|
|
|
|
|||||||
Operating profit |
42,939 | 15,384 | ||||||||
Finance income |
13 | 2,005 | 5,690 | |||||||
Finance expense |
14 | 3,239 | 10,254 | |||||||
Share of profit of an associate |
| | ||||||||
|
|
|
|
|||||||
Profit before tax |
41,705 | 10,820 | ||||||||
Income taxes |
15 | 5,140 | 3,576 | |||||||
|
|
|
|
|||||||
Net Profit |
36,565 | 7,244 | ||||||||
|
|
|
|
|||||||
Net Profit attributable to: |
||||||||||
Equity holders of the parent |
36,551 | 7,325 | ||||||||
Non-controlling interests |
14 | (82 | ) | |||||||
|
|
|
|
|||||||
36,565 | 7,243 | |||||||||
|
|
|
|
|||||||
Earnings per share |
||||||||||
Basic earnings per common share (in EUR) |
16 | 0.15 | 0.03 | |||||||
Diluted earnings per common share (in EUR) |
16 | 0.15 | 0.03 |
The accompanying notes are an integral part of the Interim Condensed Consolidated Financial Statements
F-85
Stevanato Group S.p.A.
Interim condensed consolidated statements of comprehensive income
for the three months ended March 31, 2021 and 2020
(Unaudited)
For the three months ended March 31, |
||||||||||||
2021 | 2020 | |||||||||||
(EUR thousand) | ||||||||||||
Net Profit |
36,565 | 7,243 | ||||||||||
Gains/(losses) from remeasurement of employee defined benefit plans |
140 | 361 | ||||||||||
Gains/(losses) from remeasurement of the agent termination plan |
| | ||||||||||
Tax effect relating to those components of OCI |
(34 | ) | (87 | ) | ||||||||
|
|
|
|
|||||||||
Other comprehensive income that will not be classified subsequently to profit or loss |
106 | 274 | ||||||||||
|
|
|
|
|||||||||
Exchange difference on translation of foreign operations |
24 | 2,585 | (17,863 | ) | ||||||||
Changes in the fair value of cash flow hedging instruments |
469 | (757 | ) | |||||||||
Tax effect relating to that components of OCI |
(113 | ) | 182 | |||||||||
|
|
|
|
|||||||||
Other comprehensive income (loss) that will be classified subsequently to |
2,941 | (18,438 | ) | |||||||||
|
|
|
|
|||||||||
Total other comprehensive income (loss), net of tax |
3,048 | (18,164 | ) | |||||||||
|
|
|
|
|||||||||
Total Comprehensive Income (Loss) |
39,613 | (10,921 | ) | |||||||||
|
|
|
|
|||||||||
Attributable to: |
||||||||||||
Equity holders of the parent |
39,588 | (10,836 | ) | |||||||||
Non-controlling interests |
24 | (85 | ) | |||||||||
|
|
|
|
|||||||||
39,613 | (10,921 | ) | ||||||||||
|
|
|
|
The accompanying notes are an integral part of the Interim Condensed Consolidated Financial Statements
F-86
Stevanato Group S.p.A.
Interim condensed consolidated statements of financial position
as at March 31, 2021 and at December 31, 2020
(Unaudited)
Notes | At March 31, 2021 |
At December 31, 2020 |
||||||||||
(EUR thousand) | ||||||||||||
Assets |
||||||||||||
Non-current assets |
||||||||||||
Goodwill |
47,243 | 47,243 | ||||||||||
Other intangible assets |
17 | 32,928 | 33,901 | |||||||||
Right of Use assets |
19 | 25,102 | 25,380 | |||||||||
Property, plant and equipment |
18 | 323,174 | 313,658 | |||||||||
Investments in an associate |
2,009 | 2,009 | ||||||||||
Financial assetsinvestments FVTPL |
810 | 760 | ||||||||||
Otner non current financial assets |
20 | 5,577 | 6,701 | |||||||||
Deferred tax assets |
47,544 | 45,552 | ||||||||||
|
|
|
|
|||||||||
484,387 | 475,204 | |||||||||||
Current assets |
||||||||||||
Inventories |
21 | 151,348 | 139,373 | |||||||||
Contract assets |
22 | 40,946 | 39,430 | |||||||||
Trade receivables |
22 | 140,283 | 127,818 | |||||||||
Other current financial assets |
20 | 41,517 | 41,543 | |||||||||
Tax receivables |
23 | 36,419 | 25,033 | |||||||||
Other receivables |
4,301 | 3,979 | ||||||||||
Cash and cash equivalents |
80,186 | 115,599 | ||||||||||
|
|
|
|
|||||||||
495,000 | 492,775 | |||||||||||
|
|
|
|
|||||||||
Total assets |
979,387 | 967,979 | ||||||||||
|
|
|
|
|||||||||
Equity and liabilities |
||||||||||||
Equity |
||||||||||||
Share capital |
24 | 20,002 | 20,002 | |||||||||
Reserves and Retained Earnings |
24 | 282,514 | 211,979 | |||||||||
Net profit attributable to equity holders of the parent |
36,551 | 78,513 | ||||||||||
|
|
|
|
|||||||||
Equity attributable to equity holders of the parent |
339,067 | 310,495 | ||||||||||
Non-controlling interests |
(331 | ) | (355 | ) | ||||||||
|
|
|
|
|||||||||
Total equity |
338,736 | 310,140 | ||||||||||
|
|
|
|
|||||||||
Non-current liabilities |
||||||||||||
Non-current financial liabilities |
25 | 282,541 | 294,124 | |||||||||
Employees Benefits |
27 | 26,761 | 29,725 | |||||||||
Provisions |
28 | 8,182 | 4,384 | |||||||||
Deferred tax liabilities |
13,326 | 11,623 | ||||||||||
Other non-current liabilities |
29 | 1,823 | 1,808 | |||||||||
|
|
|
|
|||||||||
332,633 | 341,664 | |||||||||||
Current liabilities |
||||||||||||
Current financial liabilities |
25 | 85,555 | 81,234 | |||||||||
Trade payables |
30 | 87,388 | 118,740 | |||||||||
Contract Liabilites |
31 | 5,393 | 5,031 | |||||||||
Advances from customers |
31 | 52,383 | 48,361 | |||||||||
Tax payables |
23 | 30,781 | 19,126 | |||||||||
Other liabilities |
30 | 46,518 | 43,683 | |||||||||
|
|
|
|
|||||||||
308,018 | 316,175 | |||||||||||
|
|
|
|
|||||||||
Total liabilities |
640,651 | 657,839 | ||||||||||
|
|
|
|
|||||||||
Total equity and liabilities |
979,387 | 967,979 | ||||||||||
|
|
|
|
The accompanying notes are an integral part of the Interim Condensed Consolidated Financial Statements
F-87
Stevanato Group S.p.A.
Interim condensed consolidated statements of changes in equity
for the three months ended March 31, 2021 and 2020
(Unaudited)
Share capital |
Treasury shares |
Cash flow hedge reserve |
Reserve for actuarial gains / (losses) on employee benefits |
Currency translation reserve |
Retained earnings and other reserve |
Equity attributable to equity holders of the parent |
Non-controlling interests |
Total equity |
||||||||||||||||||||||||||||
(EUR thousand) | ||||||||||||||||||||||||||||||||||||
At January 1, 2021 |
20,002 | (26,189 | ) | (3,345 | ) | (675 | ) | (34,911 | ) | 355,614 | 310,495 | (355 | ) | 310,140 | ||||||||||||||||||||||
Other comprehensive income |
| | 357 | 106 | 2,574 | | 3,037 | 11 | 3,048 | |||||||||||||||||||||||||||
Net profit |
| | | | | 36,551 | 36,551 | 14 | 36,565 | |||||||||||||||||||||||||||
|
|
|
|
|
|
|
|
|
|
|
|
|
|
|
|
|
|
|||||||||||||||||||
Total comprehensive income |
| | 357 | 106 | 2,574 | 36,551 | 39,588 | 24 | 39,613 | |||||||||||||||||||||||||||
Dividends |
| | | | | (11,200 | ) | (11,200 | ) | | (11,200 | ) | ||||||||||||||||||||||||
Other |
| (261 | ) | | | | 445 | 184 | | 184 | ||||||||||||||||||||||||||
|
|
|
|
|
|
|
|
|
|
|
|
|
|
|
|
|
|
|||||||||||||||||||
Total effects |
| (261 | ) | | | | (10,755 | ) | (11,016 | ) | | (11,016 | ) | |||||||||||||||||||||||
|
|
|
|
|
|
|
|
|
|
|
|
|
|
|
|
|
|
|||||||||||||||||||
At March 31, 2021 |
20,002 | (26,450 | ) | (2,989 | ) | (569 | ) | (32,336 | ) | 381,410 | 339,067 | (331 | ) | 338,736 | ||||||||||||||||||||||
|
|
|
|
|
|
|
|
|
|
|
|
|
|
|
|
|
|
Share capital |
Treasury shares |
Cash flow hedge reserve |
Reserve for actuarial gains / (losses) on employee benefits |
Foreign currency translation reserve |
Retained earnings and other reserve |
Equity attributable to equity holders of the parent |
Non-controlling interests |
Total equity |
||||||||||||||||||||||||||||
(EUR thousand) | ||||||||||||||||||||||||||||||||||||
At January 1, 2020 |
20,002 | (26,189 | ) | (2,796 | ) | (523 | ) | (12,331 | ) | 287,327 | 265,490 | (50 | ) | 265,439 | ||||||||||||||||||||||
Other comprehensive income |
| | (575 | ) | 274 | (17,860 | ) | | (18,161 | ) | (3 | ) | (18,164 | ) | ||||||||||||||||||||||
Net profit |
| | | | | 7,325 | 7,325 | (82 | ) | 7,243 | ||||||||||||||||||||||||||
|
|
|
|
|
|
|
|
|
|
|
|
|
|
|
|
|
|
|||||||||||||||||||
Total comprehensive income |
| | (575 | ) | 274 | (17,860 | ) | 7,325 | (10,836 | ) | (84 | ) | (10,920 | ) | ||||||||||||||||||||||
Other |
| | | | | (156 | ) | (156 | ) | | (156 | ) | ||||||||||||||||||||||||
|
|
|
|
|
|
|
|
|
|
|
|
|
|
|
|
|
|
|||||||||||||||||||
Total effects |
| | | | | (156 | ) | (156 | ) | | (156 | ) | ||||||||||||||||||||||||
|
|
|
|
|
|
|
|
|
|
|
|
|
|
|
|
|
|
|||||||||||||||||||
At March 31, 2020 |
20,002 | (26,189 | ) | (3,371 | ) | (249 | ) | (30,191 | ) | 294,496 | 254,498 | (135 | ) | 254,363 | ||||||||||||||||||||||
|
|
|
|
|
|
|
|
|
|
|
|
|
|
|
|
|
|
The accompanying notes are an integral part of the Interim Condensed Consolidated Financial Statements
F-88
Stevanato Group S.p.A.
Interim condensed consolidated statements of cash flows
for the three months ended March 31, 2021 and 2020
(Unaudited)
For the three months ended March 31, |
||||||||
2021 | 2020 | |||||||
(EUR thousand) | ||||||||
Cash Flow from / (used in) operating activities |
||||||||
Profit before tax |
41,705 | 10,820 | ||||||
Adjustments: |
||||||||
Depreciation of property, plant and equipment |
9,583 | 9,613 | ||||||
Amortization of intangible assets and Right of Use |
3,366 | 2,962 | ||||||
Allowance for doubtful accounts |
982 | 569 | ||||||
Net finance expense |
1,057 | (2,011 | ) | |||||
Change in other provisions and in employee benefits |
2,907 | 131 | ||||||
Other non-cash expenses, net |
(332 | ) | (474 | ) | ||||
Working capital changes: |
||||||||
inventories and contract assets |
(13,894 | ) | (15,844 | ) | ||||
trade receivables and other assets |
(23,867 | ) | (11,456 | ) | ||||
trade payables, contract liabilities, advances and other liabilites |
(9,716 | ) | (1,774 | ) | ||||
Interest paid |
(1,147 | ) | (1,159 | ) | ||||
Interest received |
162 | 280 | ||||||
Income tax paid |
(4,919 | ) | (944 | ) | ||||
|
|
|
|
|||||
Total |
5,887 | (9,287 | ) | |||||
|
|
|
|
|||||
Cash Flow used in investing activities |
||||||||
Purchase of property, plant and equipment |
(21,729 | ) | (24,086 | ) | ||||
Purchase of intangible assets |
(662 | ) | (570 | ) | ||||
Investment in financial assets |
(32 | ) | (11 | ) | ||||
|
|
|
|
|||||
Total |
(22,423 | ) | (24,667 | ) | ||||
|
|
|
|
|||||
Cash Flow from / (used in) financing activities |
||||||||
Acquisition of non-controlling interests |
(118 | ) | | |||||
Dividends paid |
(11,200 | ) | | |||||
Payment of principal portion of lease liabilities |
(1,607 | ) | (1,429 | ) | ||||
Proceed from loans |
4,053 | 7,454 | ||||||
Repayments of loans |
(11,426 | ) | (9,443 | ) | ||||
Other current financial activities |
484 | 6,401 | ||||||
|
|
|
|
|||||
Total |
(19,814 | ) | 2,983 | |||||
|
|
|
|
|||||
Net change in cash and cash equivalents |
(36,350 | ) | (30,971 | ) | ||||
Net foreign exchange difference |
937 | (2,139 | ) | |||||
Cash and cash equivalents at January 1 |
115,599 | 85,386 | ||||||
|
|
|
|
|||||
Cash and cash equivalents at March 31 |
80,186 | 52,276 | ||||||
|
|
|
|
The accompanying notes are an integral part of the Interim Condensed Consolidated Financial Statements
F-89
Stevanato Group S.p.A.
Notes to the interim condensed consolidated financial statements
1. Corporate information
Stevanato Group S.p.A. (herein referred to as the Company and together with its subsidiaries the Group) is headquartered in Italy and its registered office is located in via Molinella 17, Piombino Dese (Padova, Italy). The Group is active in the design, production and distribution of products and systems to provide integrated solutions for pharma and healthcare, leveraging on constant investment and the selected acquisition of skills and new technologies that has brought to become a global player in the pharma industry. Principal products are linked to containment solutions, drug delivery systems, medical devices, diagnostic, analytical services, visual inspection machines, assembling and packaging machines, glass forming machines.
The Group has nine production plants for manufacturing and assembly of pharma and healthcare products (in Italy, Germany, Slovakia, United States, Mexico, China), five plants for the production of machinery and equipment (in Italy and Denmark), two sites for analytical services (in Italy and United States) and two commercial offices (in Japan and the United States). The global footprint allows to sell products and provide services in more than 70 countries worldwide.
Stevanato Group S.p.A. is controlled by Stevanato Holding S.r.l. which holds 88.28% of its share capital.
2. Authorization of interim condensed consolidated financial statements and compliance with international financial reporting standards
These Interim Condensed Consolidated Financial Statements of Stevanato Group S.p.A. were authorized for issuance on April 30, 2021 and have been prepared in accordance with IAS 34Interim Financial Reporting. The Interim Condensed Consolidated Financial Statements should be read in conjunction with the Groups consolidated financial statements at and for the year ended December 31, 2020 (the Consolidated Financial Statements), which have been prepared in accordance with International Financial Reporting Standards (IFRS) as issued by the International Accounting Standards Board (IASB).
3. Basis of preparation for interim condensed consolidated financial statements
The preparation of the Interim Condensed Consolidated Financial Statements requires management to make estimates and assumptions that affect the reported amounts of revenues, expenses, assets and liabilities as well as disclosures of contingent liabilities. If in the future such estimates and assumptions, which are based on managements best judgment at the date of these Interim Condensed Consolidated Financial Statements, deviate from the actual circumstances, the original estimates and assumptions will be modified as appropriate in the period in which the circumstances change. Reference should be made to the section Use of estimates in the Consolidated Financial Statements for a detailed description of the more significant valuation procedures used by the Group.
Moreover, in accordance with IAS 34, certain valuation procedures, in particular those of a more complex nature regarding matters such as any impairment of non-current assets, are only carried out in full during the preparation of the annual consolidated financial statements, when all the related information necessary is available, other than in the event that there are indications of impairment, in which case an immediate assessment is required. Similarly, the actuarial valuations that are required for the determination of employee benefit provisions are also usually carried out during the preparation of the annual consolidated financial statements, except in the event of significant market fluctuations or significant plan amendments, curtailments or settlements. IAS 34 also requires to disclose the nature and amount of items affecting net income that are unusual due to their nature, size or significant.
F-90
New endorsed standards, amendments and interpretations:
The following amendments and interpretations were adopted for the first time in 2021 and did not have an impact on the interim condensed consolidated financial statements:
| Amendments to IFRS 9Financial Instruments, |
| Amendments to IAS 39Financial Instruments: Recognition and Measurement, |
| Amendments to IFRS 7Financial Instruments: Disclosures, |
| Amendments to IFRS 4Insurance Contracts |
| Amendments to IFRS 16LeasesInterest Rate Benchmark ReformPhase 2 (issued on August 27, 2020, endorsed on January 13, 2021 and effective from periods beginning on January 1, 2021). |
New standards, amendments and interpretations not yet effective
Amendments to IAS 1Classification of Liabilities as Current or Non-current
In January 2020, the IASB issued amendments to paragraphs 69 to 76 of IAS 1 to specify the requirements for classifying liabilities as current or non-current. The amendments clarify:
| What is meant by a right to defer settlement. |
| That a right to defer must exist at the end of the reporting period. |
| That classification is unaffected by the likelihood that an entity will exercise its deferral right. |
| That only if an embedded derivative in a convertible liability is itself an equity instrument would the terms of a liability not impact its classification. |
The amendments are effective for annual reporting periods beginning on or after January 1, 2023 and must be applied retrospectively. The Group is currently assessing the impact the amendments will have on current practice, monitoring the IFRS Interpretations Committees discussions, and whether existing loan agreements may require renegotiation.
Amendments to IFRS 3Reference to the Conceptual Framework
In May 2020, the IASB issued Amendments to IFRS 3Business CombinationsReference to the Conceptual Framework. The amendments are intended to replace a reference to the Framework for the Preparation and Presentation of Financial Statements, issued in 1989, with a reference to the Conceptual Framework for Financial Reporting issued in March 2018 without significantly changing its requirements. The Board also added an exception to the recognition principle of IFRS 3 to avoid the issue of potential day 2 gains or losses arising for liabilities and contingent liabilities that would be within the scope of IAS 37 or IFRIC 21Levies, if incurred separately. At the same time, the Board decided to clarify existing guidance in IFRS 3 for contingent assets that would not be affected by replacing the reference to the Framework for the Preparation and Presentation of Financial Statements. The amendments are effective for annual reporting periods beginning on or after January 1, 2022 and apply prospectively. The amendments are not expected to have a material impact on the Group.
Amendments to IAS 16Property, Plant and Equipment: Proceeds before Intended Use
In May 2020, the IASB issued IAS 16Property, Plant and EquipmentProceeds before Intended Use, which prohibits entities deducting from the cost of an item of property, plant and equipment, any proceeds from selling items produced while bringing that asset to the location and condition necessary for it to be capable of operating in the manner intended by management. Instead, an entity recognizes the proceeds from selling such items, and the costs of producing those items, in profit or loss. The amendment is effective for annual reporting
F-91
periods beginning on or after 1 January 2022 and must be applied retrospectively to items of property, plant and equipment made available for use on or after the beginning of the earliest period presented when the entity first applies the amendment. The amendments are not expected to have a material impact on the Group.
Amendments to IAS 37Onerous ContractsCosts of Fulfilling a Contract
In May 2020, the IASB issued amendments to IAS 37 to specify which costs an entity needs to include when assessing whether a contract is onerous or loss-making. The amendments apply a directly related cost approach. The costs that relate directly to a contract to provide goods or services include both incremental costs and an allocation of costs directly related to contract activities. General and Administrative costs do not relate directly to a contract and are excluded unless they are explicitly chargeable to the counterparty under the contract. The amendments are effective for annual reporting periods beginning on or after January 1, 2022. The Group will apply these amendments to contracts for which it has not yet fulfilled all its obligations at the beginning of the annual reporting period in which it first applies the amendments. The amendments are not expected to have a material impact on the Group.
Amendments to IAS 8Accounting Policies, Changes to Accounting Estimates and Errors
On 12 February 2021, the IASB issued amendments to IAS 8 Accounting Policies, Changes to Accounting Estimates and Errors, in which it introduces a new definition of accounting estimates. The amendments are designed to clarify the distinction between changes in accounting estimates and changes in accounting policies and the correction of errors. The amendments become effective for annual reporting periods beginning on or after 1 January 2023 and apply to changes in accounting policies and changes in accounting estimates that occur on or after the start of that period. The amendments are not expected to have a material impact on the Group.
Amendments to IAS 1Presentation of Financial Statements
In February 2021, the IASB issued amendments to IAS 1 Presentation of Financial Statements in which it provides guidance and examples to help entities apply materiality judgements to accounting policy disclosures. The IASB also issued amendments to IFRS Practice Statement 2 Making Materiality Judgements (the PS) to support the amendments in IAS 1 by explaining and demonstrating the application of the four-step materiality process to accounting policy disclosures. The amendments aim to help entities provide accounting policy disclosures that are more useful by replacing the requirement for entities to disclose their significant accounting policies with a requirement to disclose their material accounting policies and adding guidance on how entities apply the concept of materiality in making decisions about accounting policy disclosures. The amendments to IAS 1 are applicable for annual periods beginning on or after 1 January 2023. The amendments are not expected to have a material impact on the Group.
F-92
4. Scope of consolidation
Stevanato Group S.p.A. is the parent company of the Group and it holds, directly and indirectly, interests in the Groups main operating companies. There are no changes in the scope of consolidation for the periods presented in this Interim Report and the Groups scope of consolidation is as follows:
Subsidiaries and associate
The interim condensed consolidated financial statement of the Group includes the following list of company directly or indirectly controlled:
Name |
Segment |
Description |
Country of |
Type of |
% equity interest | |||||||||||
2021 | 2020 | |||||||||||||||
Nuova Ompi S.r.l. |
Biopharmaceutical | Production of container closure systems and development of integrated solutions for the pharmaceutical industry | Italy | Direct | 100 | % | 100 | % | ||||||||
Spami S.r.l. |
Engeneering | Production plant and machinery | Italy | Direct | 100 | % | 100 | % | ||||||||
Stevanato Group International a.s. |
Biopharmaceutical | Service/Subholding company | Slovakia | Direct | 100 | % | 100 | % | ||||||||
Medical Glass a.s. |
Biopharmaceutical | Production of container closure systems | Slovakia | Indirect | 100 | % | 100 | % | ||||||||
Stevanato Group N.A. S. de RL de CV |
Biopharmaceutical | Service company | Mexico | Indirect | 100 | % | 100 | % | ||||||||
Ompi N.A. S. de RL de CV |
Biopharmaceutical | Production of container closure systems | Mexico | Direct | 30.76 | % | 30.76 | % | ||||||||
Indirect | 69.24 | % | 69.24 | % | ||||||||||||
Ompi of America inc. |
Biopharmaceutical | Sale of container closure systems | USA | Indirect | 100 | % | 100 | % | ||||||||
Ompi do Brasil Industria e Comercio de Embalagens Farmaceutica Ltda |
Biopharmaceutical |
Production of container closure systems |
Brazil |
Direct | 79 | % | 79 | % | ||||||||
Indirect | 21 | % | 21 | % | ||||||||||||
Ompi Pharma.Packing Techn. Co. Ltd |
Biopharmaceutical | Production of container closure systems | China | Indirect | 100 | % | 100 | % | ||||||||
Innoscan A/S |
Engeneering | Production plant and machinery | Denmark | Indirect | 100 | % | 100 | % | ||||||||
SVM Automatik A/S |
Engeneering | Production plant and machinery | Denmark | Indirect | 65 | %* | 65 | %* | ||||||||
Medirio SA |
Biopharmaceutical | Research and development | Switzerland | Indirect | 100 | % | 100 | % | ||||||||
Balda Medical Gmbh |
Biopharmaceutical | Production of in-vitro diagnostic solutions | Germany | Direct | 100 | % | 100 | % | ||||||||
Balda C. Brewer Inc. |
Biopharmaceutical | Production of in-vitro diagnostic solutions | USA | Indirect | 100 | % | 100 | % | ||||||||
Balda Precision Inc. |
Biopharmaceutical | Production metal components | USA | Indirect | 100 | % | 100 | % | ||||||||
Ompi of Japan Co., Ltd. |
Biopharmaceutical | Sale of container closure systems | Japan | Direct | 51 | % | 51 | % | ||||||||
SG Technology Excellence Center Inc. |
Biopharmaceutical | Provision of analysis and laboratory testings | USA | Direct | 0 | %** | 100 | %** |
* | Not included in minority interests as there is a put and call option for full acquisition (the minority interests would have amounted to 35%). |
F-93
** | Following subsequent evaluations, the business of Technology Center will be carried out by Ompi of America, therefore the newly established company SG Technology Excellence Center Inc. was liquidated on October 16, 2020, after repayment of share capital (USD 100 thousand). |
Name |
Division |
Description |
Country of |
Type of |
% equity interest | |||||||
2021 | 2020 | |||||||||||
Swissfillon AG |
Biopharmaceutical | Sterile filling services company | Switzerland | Associate | 26.94% | 26.94% |
Non-controlling interests
The non-controlling interests as of March 31, 2021 and the net profit attributable to non-controlling interests during the three months ended March 31, 2021 relate to Ompi of Japan Co., Ltd. and Medical Glass a.s..
5. Financial Risk Factor
The Group is exposed to the following financial risks connected with its operations:
| financial market risk, mainly relating to foreign currency exchange rates and to interest rates; |
| liquidity risk, with particular reference to the availability of funds and access to the credit market, should the Group require it, and to financial instruments in general; |
| credit risk, arising both from its normal commercial relations with customers, and its financing activities. |
These risks could significantly affect the Groups financial position, results of operations and cash flows, and for this reason the Group identifies and monitors these risks, in order to detect potential negative effects in advance and take the necessary action to mitigate them, primarily through its operating and financing activities and if required, through the use of derivative financial instruments.
The Interim Condensed Consolidated Financial Statements do not include all the information and notes on financial risk management required in the annual consolidated financial statements. For a detailed description of the financial risk factors and financial risk management of the Group, reference should be made to Note 40 of the Consolidated Financial Statements at and for the year ended December 31, 2020.
Although there are no significant negative impacts from the coronavirus Covid-19 (Covid-19) pandemic on the Groups exposure to financial risks or risk management procedures in the periods presented by the these Interim Condensed Consolidated Financial Statements, management is continuously monitoring the evolution of Covid-19 as information becomes available and the related effects on the financial position and results of operations of the Group.
F-94
6. Other Information
The principal foreign currency exchange rates used to translate other currencies into Euro were as follows:
COUNTRY |
ISO CODE |
Average for three months ended March 31, 2021 |
At March 31, 2021 |
Average for three months ended March 31, 2020 |
At March 31, 2020 |
At December 31, 2020 |
At December 31, 2019 |
|||||||||||||||||||||
CHINA |
CNY | 7.8080 | 7.6812 | 7.6956 | 7.7784 | 8.0225 | 7.8205 | |||||||||||||||||||||
UNITED STATES |
USD | 1.2048 | 1.1725 | 1.1027 | 1.0956 | 1.2271 | 1.1234 | |||||||||||||||||||||
MEXICO |
MXN | 24.5272 | 24.0506 | 22.0918 | 26.1772 | 24.4160 | 21.2202 | |||||||||||||||||||||
DENM ARK |
DKK | 7.4372 | 7.4373 | 7.4715 | 7.4674 | 7.4409 | 7.4715 | |||||||||||||||||||||
BRAZIL |
BRL | 6.5990 | 6.7409 | 4.9167 | 5.7001 | 6.3735 | 4.5157 | |||||||||||||||||||||
SWITZERLAND |
CHF | 1.0913 | 1.1070 | 1.0668 | 1.0585 | 1.0802 | 1.0854 | |||||||||||||||||||||
JAPAN |
JPY | 127.8057 | 129.9100 | 120.1000 | 118.9000 | 126.4900 | 121.9400 |
7. Seasonality of operations
It should be noted that historically the Groups business operations are not characterised by seasonality.
8. Segment Information
Stevanato Group business operations are organized into two reportable segments, based on their specific products and services:
| Biopharmaceutical and Diagnostic Solutions, which includes containment solutions, drug delivery systems, medical devices and diagnostic & analytical services; |
| Engineering, which covers visual inspection, assembly packaging and glass forming machines. |
For the three months ended March 31, 2021, Stevanato Group generated approximately 83% of total sales from the Biopharmaceutical and Diagnostic Solutions segment (88% for the three months ended March 31, 2020), and approximately 17% from the Engineering segment (12% for the three months ended March 31, 2020).
F-95
The criteria applied to identify the operating segments are consistent with the information reviewed by the Chief Executive Officer (the Groups Chief Operating Decision Maker) in making decisions regarding the allocation of resources and to assess performance.
As at and for the three months ended March 31, 2021 | ||||||||||||||||||||
Biopharmaceutical and Diagnostic Solutions |
Engineering | Total segments |
Adjustments, eliminations and unallocated items |
Consolidated | ||||||||||||||||
(EUR thousand) | ||||||||||||||||||||
External Customers |
160,571 | 32,279 | 192,849 | 192,849 | ||||||||||||||||
Inter-Segment |
180 | 7,746 | 7,925 | (7,925 | ) | | ||||||||||||||
Total Revenues |
160,750 | 40,024 | 200,775 | (7,925 | ) | 192,849 | ||||||||||||||
Cost of Sales |
103,466 | 31,272 | 134,738 | (7,298 | ) | 127,440 | ||||||||||||||
|
|
|
|
|
|
|
|
|
|
|||||||||||
Gross Profit |
57,284 | 8,752 | 66,037 | (627 | ) | 65,410 | ||||||||||||||
|
|
|
|
|
|
|
|
|
|
|||||||||||
Other operating income |
3,225 | | 3,225 | | 3,225 | |||||||||||||||
Selling and Marketing expenses |
3,143 | 821 | 3,964 | 1,904 | 5,868 | |||||||||||||||
Research and Development expenses |
4,550 | 1,057 | 5,608 | 212 | 5,820 | |||||||||||||||
General and Administrative expenses |
12,470 | 2,483 | 14,954 | (947 | ) | 14,007 | ||||||||||||||
|
|
|
|
|
|
|
|
|
|
|||||||||||
Operating Profit |
40,345 | 4,391 | 44,736 | (1,797 | ) | 42,939 | ||||||||||||||
|
|
|
|
|
|
|
|
|
|
|||||||||||
Total assets |
784,754 | 182,868 | 967,623 | 11,764 | 979,387 | |||||||||||||||
|
|
|
|
|
|
|
|
|
|
|||||||||||
Total liabilities |
313,036 | 100,223 | 413,259 | 227,392 | 640,651 | |||||||||||||||
|
|
|
|
|
|
|
|
|
|
As at and for the three months ended March 31, 2020 | ||||||||||||||||||||
Biopharmaceutical and Diagnostic Solutions |
Engineering | Total segments |
Adjustments, eliminations and unallocated items |
Consolidated | ||||||||||||||||
(EUR thousand) | ||||||||||||||||||||
External Customers |
120,383 | 16,048 | 136,431 | 136,431 | ||||||||||||||||
Inter-Segment |
195 | 15,726 | 15,922 | (15,922 | ) | | ||||||||||||||
Total Revenues |
120,579 | 31,774 | 152,353 | (15,922 | ) | 136,431 | ||||||||||||||
Cost of Sales |
85,141 | 25,739 | 110,880 | (13,953 | ) | 96,927 | ||||||||||||||
|
|
|
|
|
|
|
|
|
|
|||||||||||
Gross Profit |
35,438 | 6,035 | 41,473 | (1,969 | ) | 39,504 | ||||||||||||||
|
|
|
|
|
|
|
|
|
|
|||||||||||
Other operating income |
313 | | 313 | (57 | ) | 255 | ||||||||||||||
Selling and Marketing expenses |
3,542 | 790 | 4,332 | 1,897 | 6,229 | |||||||||||||||
Research and Development expenses |
2,189 | 1,118 | 3,307 | 642 | 3,948 | |||||||||||||||
General and Administrative expenses |
12,613 | 1,850 | 14,463 | (265 | ) | 14,198 | ||||||||||||||
|
|
|
|
|
|
|
|
|
|
|||||||||||
Operating Profit |
17,407 | 2,277 | 19,685 | (4,300 | ) | 15,384 | ||||||||||||||
|
|
|
|
|
|
|
|
|
|
|||||||||||
Total assets |
685,672 | 153,660 | 839,332 | 26,289 | 865,621 | |||||||||||||||
|
|
|
|
|
|
|
|
|
|
|||||||||||
Total liabilities |
292,977 | 81,329 | 374,306 | 236,952 | 611,258 | |||||||||||||||
|
|
|
|
|
|
|
|
|
|
Inter-segment revenues and costs are eliminated upon consolidation and reflected in the adjustments, elimination and unallocated items column. The most relevant adjustment in revenues relates to the sales of the Engineerings equipment to the Biopharmaceutical and Diagnostic Solutions.
F-96
Neither the Biopharmaceutical and Diagnostic segment nor the Engineering segment have external customer with more than 10% of groups revenue as of March 31, 2021 and as of March 31, 2020.
Revenues generated by the Biopharmaceutical and Diagnostic Solutions segment increase by EUR 40,171 thousand, or 33.3%, from EUR 120,579 thousand in the three months ended March 31, 2020 to EUR 160,750 thousand for the three months ended March 31, 2021.
Revenues generated by the Engineering segment, revenue increase by EUR 8,250 thousand, or 26.0%, from EUR 31,774 thousand for the three months ended March 31, 2020 to EUR 40,024 thousand for the three months ended March 31, 2021.
9. Revenues from contract with customers
Disaggregated revenue information
The table below shows the disaggregation of the Groups revenue from contracts with external customers:
For the three months ended March 31, 2021 | ||||||||||||
Biopharmaceutical and Diagnostic Solutions |
Engineering | Total | ||||||||||
(EUR thousand) | ||||||||||||
Type of goods or service |
||||||||||||
Revenues from high-value solutions |
44,946 | | 44,946 | |||||||||
Revenues from other containment and delivery solutions |
115,630 | | 115,630 | |||||||||
Revenues from engineering |
| 32,273 | 32,273 | |||||||||
|
|
|
|
|
|
|||||||
Total revenue from contracts with customers |
160,577 | 32,273 | 192,849 | |||||||||
|
|
|
|
|
|
|||||||
Geographical markets |
||||||||||||
EMEA |
99,745 | 17,579 | 117,324 | |||||||||
APAC |
12,856 | 3,248 | 16,103 | |||||||||
North America |
42,663 | 11,357 | 54,020 | |||||||||
South America |
5,313 | 89 | 5,401 | |||||||||
|
|
|
|
|
|
|||||||
Total revenue from contracts with customers |
160,577 | 32,273 | 192,849 | |||||||||
|
|
|
|
|
|
|||||||
Timing of revenue recognition |
||||||||||||
Goods and services transferred at a point in time |
156,599 | 12,498 | 169,097 | |||||||||
Goods and services transferred over time |
3,978 | 19,774 | 23,752 | |||||||||
|
|
|
|
|
|
|||||||
Total revenue from contracts with customers |
160,577 | 32,273 | 192,849 | |||||||||
|
|
|
|
|
|
F-97
For the three months ended March 31, 2020 | ||||||||||||
Biopharmaceutical and Diagnostic Solutions |
Engineering | Total | ||||||||||
(EUR thousand) | ||||||||||||
Type of goods or service |
||||||||||||
Revenues from high-value solutions |
30,214 | | 30,214 | |||||||||
Revenues from other containment and delivery solutions |
90,169 | | 90,169 | |||||||||
Revenues from engineering |
| 16,048 | 16,048 | |||||||||
|
|
|
|
|
|
|||||||
Total revenue from contracts with customers |
120,383 | 16,048 | 136,431 | |||||||||
|
|
|
|
|
|
|||||||
Geographical markets |
||||||||||||
EMEA |
76,626 | 13,953 | 90,578 | |||||||||
APAC |
9,384 | 1,503 | 10,887 | |||||||||
North America |
30,240 | 585 | 30,825 | |||||||||
South America |
4,134 | 7 | 4,141 | |||||||||
|
|
|
|
|
|
|||||||
Total revenue from contracts with customers |
120,383 | 16,048 | 136,431 | |||||||||
|
|
|
|
|
|
|||||||
Timing of revenue recognition |
||||||||||||
Goods and services transferred at a point in time |
120,383 | 6,122 | 126,506 | |||||||||
Goods and services transferred over time |
| 9,926 | 9,926 | |||||||||
|
|
|
|
|
|
|||||||
Total revenue from contracts with customers |
120,383 | 16,048 | 136,431 | |||||||||
|
|
|
|
|
|
The Group revenues are divided into two main segments:
| Biopharmaceutical and Diagnostic Solutions: this segment includes all the products and services developed and provided for containment and delivery of pharmaceutical drugs and diagnostic reagents. This segment is further divided into two sub-categories: |
| High-value solutions: wholly owned, internally developed products, processes and services for which the Group hold intellectual property rights or have strong proprietary know-how and are characterized by particular complexity or high performance; |
| Other containment and delivery solutions. |
| Engineering: this segment includes all the equipment and technologies developed and provided to support the end-to-end pharmaceutical and diagnostic manufacturing processes. |
Consolidated revenues increase by EUR 56,418 thousand, or 41.4%, to EUR 192,849 thousand for the three months ended March 31, 2021, compared to EUR 136,431 thousand for the three months ended March 31, 2020.
With reference to Biopharmaceutical and Diagnostic Solution segment, revenues in high-value solutions increase by EUR 14,732 thousand, or 48.8%, from EUR 30,214 thousand for the three months ended March 31, 2020 to EUR 44,946 thousand for the three months ended March 31, 2021, while revenues in other containment and delivery solution increase by EUR 25,461 thousand, or 28.2%, from EUR 90,169 thousand for the three months ended March 31, 2020 to EUR 115,630 thousand for the three months ended March 31, 2021. Revenues in Biopharmaceutical and Diagnostic Solutions show a significant growth in all the geographic markets: +41.1% in North America, +37.0% in APAC, +30.2% in EMEA and +28,5% in South America.
With reference to Engineering segment, revenues from contracts with external customers increase by EUR 16,225 thousand, or 101.1%, from EUR 16,048 thousand for the three months ended March 31, 2020 to EUR 32,273 thousand for the three months ended March 31, 2021.
F-98
Contract balances
The following table provides information on contractual asset from contracts with customer:
At March 31, 2021 |
At December 31, 2020 |
|||||||
(EUR thousand) | ||||||||
Trade Receivables |
140,283 | 127,818 | ||||||
Contract Assets |
40,946 | 39,430 | ||||||
Contract Liabilities |
(5,393 | ) | (5,031 | ) | ||||
Advances From Customers |
(52,383 | ) | (48,361 | ) | ||||
|
|
|
|
|||||
Total |
123,453 | 113,856 | ||||||
|
|
|
|
The contract assets mainly relate to the Groups right to consideration for productions from construction contract not yet invoiced as of the balance sheet date. The amount recognized as contract assets are reclassified to trade receivable as soon as the Groups has an unconditional right to consideration.
10. Cost of sales
Cost of sales are detailed as follows:
For the three months ended March 31, |
||||||||
2021 | 2020 | |||||||
(EUR thousand) | ||||||||
Purchases |
57,019 | 49,425 | ||||||
Change in inventories |
(4,472 | ) | (6,984 | ) | ||||
Direct industrial labour |
27,989 | 25,593 | ||||||
Indirect industrial labour |
11,735 | 10,548 | ||||||
Industrial depreciation |
10,557 | 10,554 | ||||||
Other costs of sales |
24,612 | 7,792 | ||||||
|
|
|
|
|||||
Total Cost of sales |
127,440 | 96,927 | ||||||
|
|
|
|
All Cost of sales items increase in the first quarter of 2021 compared to the same period of the previous year as a result of the significant growth in sale volumes. In particular, the increase in other costs of sales, is mainly due to an additional risk accrual linked to potential customers claim, an increase in subcontracting work aimed to cope the increasing workload with external resources, as a consequence of the growing revenues in Engineering segment, as well as a reduction in industrial capitalized costs for the machinery built within the Group.
Nevertheless, the overall Cost of sales increase less than proportionally to revenues mainly thanks to the efficiency maximization in production processes.
11. Other operating income
Other operating income as of March 31, 2021 amounts to EUR 3,225 thousand (EUR 255 thousand as of March 31, 2020), of which EUR 2,810 thousand are related to feasibility study, design, development and industrialization of new products, contract cancellation fees.
As of March 31, 2021, other operating income include also EUR 415 thousand related to grants received by Ompi Pharma. Packaging Tech. Co. Ltd for machines purchased and qualified with intelligent technic requirement.
F-99
12. Expenses
Expenses are detailed as follows:
For the three months ended March 31, |
||||||||
2021 | 2020 | |||||||
(EUR thousand) | ||||||||
Selling and Marketing expenses |
5,868 | 6,229 | ||||||
Research and Development expenses |
5,820 | 3,948 | ||||||
General and Administrative expenses |
14,007 | 14,198 | ||||||
|
|
|
|
|||||
Total Expenses |
25,695 | 24,375 | ||||||
|
|
|
|
As of March 31, 2021, Selling and Marketing expenses amount to EUR 5,868 thousand (EUR 6,229 thousand in 2020). These expenses are mainly related to personnel expenses for sales organizations. They include provision for bad and doubtful debts for EUR 1,154 thousand (EUR 1,211 thousand in 2020) and depreciation for EUR 197 thousand (EUR 204 thousand in 2020). The decrease is mainly due to the postponement of all the exhibitions and business events as well as the reduction in business travels as a consequence of the Covid-19 pandemic persistency. This decrease has been partially offset by higher personal costs due to carry over effect and new hiring.
Research and Development expenses amounting to EUR 5,820 thousand (EUR 3,948 thousand in 2020) include costs for research and development activities to support the innovation of product range and components and include amortization of capitalized development costs for EUR 801 thousand (EUR 512 thousand in 2020). The increase is primarily due to the structuring of the Drug Delivery Systems Department and the US technology excellence centre set up.
General and Administrative expenses amount to EUR 14,007 thousand (EUR 14,198 thousand in 2020) and mainly comprise personnel expenses for administrative functions, consultancies, directors compensation, rentals as well as, depreciation and amortization for EUR 1,135 thousand (EUR 1,045 thousand in 2020), of which amortization of fair value adjustments from purchase price allocations amount to EUR 260 thousand (same amount in 2020).
13. Finance income
Finance income are as follows:
For the three months ended March 31, |
||||||||
2021 | 2020 | |||||||
(EUR thousand) | ||||||||
Interest income from banks deposits |
143 | 36 | ||||||
Income from financial discounts |
(2 | ) | 48 | |||||
Interest income on loans to associates |
| 5 | ||||||
Other financial income |
21 | 193 | ||||||
Foreign currency exchange rate gains |
1,871 | 5,639 | ||||||
Derivatives write-ups |
79 | | ||||||
Other fair value adjustments |
(106 | ) | (229 | ) | ||||
|
|
|
|
|||||
Total finance income |
2,005 | 5,690 | ||||||
|
|
|
|
The finance income reduction of EUR 3,685 thousand is mainly driven by foreign currency exchange gains which fluctuated significantly in 2020 following Covid-19 global spread.
F-100
14. Finance expense
Finance expense are as follows:
For the three months ended March 31, |
||||||||
2021 | 2020 | |||||||
(EUR thousand) | ||||||||
Interest on debts and borrowings |
1,141 | 1,163 | ||||||
Financial discounts and other expenses |
6 | (4 | ) | |||||
Interest on lease liabilities |
149 | 159 | ||||||
Financial component IAS 19 |
(0 | ) | 22 | |||||
Foreign currency exchange losses |
954 | 2,606 | ||||||
Derivatives write-downs |
990 | 6,308 | ||||||
|
|
|
|
|||||
Total finance expense |
3,240 | 10,255 | ||||||
|
|
|
|
Finance expense include bank interest on the Groups financial debt (recalculated using the amortized cost method) and interest on leases about the portion of financial expenses payable matured in the reporting period on the liabilities, recognized in accordance with IFRS 16Leases.
Foreign exchange differences are realized, and unrealized gains and losses incurred on transactions in currencies other than the functional currency of the Group; the net foreign currency exchange impact, given by the sum of gains and losses, amounts to EUR (917) thousand as of March 31, 2021 and EUR (3,033) thousand as of March, 31 2020.
The exchange rate fluctuations following Covid-19 spread in 2020 affected derivatives evaluation; in particular hedging instruments on Mexican Pesos underwent a significant decrease in fair value.
15. Income tax
Income tax expense amount to EUR 5,140 thousand for the three months ended March 31, 2021, compared to EUR 3,576 thousand for the three months ended March 31, 2020.
Effective tax rate decreased by 20.7%, from 33.05% to 12.33%. In March 2021, the group reached an agreement with Italian Tax Agency regarding the so called Patent box regime, resulting in a retroactive EUR 5.5 million tax saving for the financial years 2016-2020. The normalized effective tax rate without this one-off item is 25.5%.
Deferred tax assets and liabilities of the individual consolidated companies are offset within the interim consolidated statement of financial position when a legally enforceable right to offset exists.
16. Earnings per Share
Basic earnings per share (EPS) is calculated by dividing into the profit attributable to equity holders of the parent by the weighted average number of common shares issued net of the treasury shares held by the Group and the vested awards under the 2012-2021 incentive plan. The Company gives consideration to all potentially dilutive impacts in calculating Diluted Earnings per Share and determined there are no dilution impacts as of March 31, 2021 and 2020, resulting in basic and diluted earnings per share being the same for all periods presented.
The Shareholders meetings held on March 4, 2021 and July 1, 2021 approved, respectively, two share splits, as explained also in Note 24. The number of ordinary shares outstanding has been retrospectively adjusted as if such events had occurred at the beginning of the earliest period presented.
F-101
The following table reflects the income and share data used in the basic and diluted EPS calculation:
For the three months ended March 31, |
||||||||
2021 | 2020 | |||||||
(EUR thousand) | ||||||||
Profit attributable to ordinary equity holders of the parent |
36,551 | 7,325 | ||||||
Weighted average number of ordinary shares for basic EPS |
240,570,060 | 240,570,060 | ||||||
|
|
|
|
|||||
Weighted average number of ordinary shares adjusted for the effect of dilution |
240,570,060 | 240,570,060 | ||||||
|
|
|
|
|||||
2021 | 2020 | |||||||
Basics earnings per common share (in EUR) |
0.15 | 0.03 | ||||||
Diluted earnings per common share (in EUR) |
0.15 | 0.03 |
17. Intangible assets
Changes in intangible assets for the three months ended March 31, 2021 are as follows:
Total | ||||
(EUR thousand) | ||||
Cost |
||||
At January 1, 2021 |
69,882 | |||
Additions |
669 | |||
Disposal |
(7 | ) | ||
Exchange differences |
273 | |||
|
|
|||
At March 31, 2021 |
70,817 | |||
|
|
|||
Amortisation |
||||
At January 1, 2021 |
35,982 | |||
Amortisation |
1,519 | |||
Exchange differences |
388 | |||
|
|
|||
At March 31, 2021 |
37,888 | |||
|
|
|||
Net book value |
||||
At March 31, 2021 |
32,928 | |||
|
|
|||
At December 31, 2020 |
33,901 | |||
|
|
Additions of EUR 669 thousand for the three months ended March 31, 2021 related to the capitalization of costs associated with the upgrading of the ERP software and software licences for R&D, quality and production departments. No impairment indicators were identified during the three month period ended March 31, 2021.
F-102
18. Property, plant and equipment
Changes in items of property, plant and equipment for the three months ended March 31, 2021 are as follows:
Total | ||||
(EUR thousand) | ||||
Cost |
||||
At January 1, 2021 |
638,033 | |||
Additions |
18,369 | |||
Disposals |
(382 | ) | ||
Exchange differences |
1,823 | |||
|
|
|||
At March 31, 2021 |
657,842 | |||
|
|
|||
Depreciation |
||||
At January 1, 2021 |
324,375 | |||
Depreciation charge for the year |
9,582 | |||
Disposals |
(373 | ) | ||
Exchange differences |
1,086 | |||
|
|
|||
At March 31, 2021 |
334,669 | |||
|
|
|||
Net book value |
||||
|
|
|||
At March 31, 2021 |
323,174 | |||
|
|
|||
At December 31, 2020 |
313,658 | |||
|
|
Additions of EUR 18,369 thousand for the three months ended March 31, 2021 are mainly comprised of additions to advances and assets under construction, as well as plant, machinery and equipment, primarily related to building suitable to house new production facilities, purchase of new production equipment (part of the quarterly capital expenditure in machinery is also related to the increasing production capacity due to the Covid-19 pandemic), investments in machines for syringes, vials and cartridges production.
19. Right of Use
The Group has lease contracts for various items of plant, machinery, vehicles and other equipment used in its operations. Leases of plant and machinery generally have lease terms between 3 and 15 years, while vehicles and other equipment generally have lease terms between 3 and 5 years. There are several lease contracts that include extension and termination options.
The Group also has certain leases of machinery with lease terms of 12 months or less and leases of office equipment with low value. The Group applies the short-term lease and lease of low-value assets recognition exemptions for these leases.
F-103
Movements in the leased Right of Use assets in for the first three months of 2021 are shown below:
Total | ||||
(EUR thousand) | ||||
Cost |
||||
At January 1, 2021 |
35,992 | |||
Additions |
855 | |||
Exchange differences |
528 | |||
|
|
|||
At March 31, 2021 |
37,375 | |||
|
|
|||
Depreciation |
||||
At January 1, 2021 |
10,612 | |||
Depreciation charge for the year |
1,537 | |||
Exchange differences |
124 | |||
|
|
|||
At March 31, 2021 |
12,273 | |||
Net book value |
||||
At March 31, 2021 |
25,102 | |||
|
|
|||
At December 31, 2020 |
25,380 | |||
|
|
20. Financial assets
The following table details the composition of financial assets:
At March 31, 2021 |
At December 31, 2020 |
|||||||
(EUR thousand) | ||||||||
Receivables from financing activities |
4,828 | 5,956 | ||||||
Other non-current financial assets |
749 | 745 | ||||||
|
|
|
|
|||||
Other non-current financial assets |
5,577 | 6,701 | ||||||
|
|
|
|
|||||
Fair value of derivatives financial instruments |
100 | 19 | ||||||
Other securities |
41,417 | 41,523 | ||||||
|
|
|
|
|||||
Other current financial assets |
41,517 | 41,543 | ||||||
|
|
|
|
|||||
Financial Assets |
47,094 | 48,244 | ||||||
|
|
|
|
Receivables from financing activities assets include financial loan for EUR 1,313 thousand as of March 31, 2021 (EUR 1,342 as of December 31, 2020) granted to the associate Swissfillon AG to fund the development projects and financial loan of EUR 3,515 thousand as of March 31, 2021 (EUR 4,614 thousand as of December 31, 2020) in favour of a restricted number of key managers in connection with a cash settled award. The decrease of the financial loan follows the closing of cash settled award for one of the beneficiaries, as reported in Note 27.
Other securities include guaranteed investment funds managed by Société Générale SA, which are measured at fair value.
F-104
21. Inventories
Inventories, shown net of an allowance for obsolete and slow-moving goods, can be analysed as follows:
At March 31, 2021 |
At December 31, 2020 |
|||||||
(EUR thousand) | ||||||||
Raw materials |
43,886 | 41,889 | ||||||
Semifinished products |
47,208 | 46,479 | ||||||
Finished products |
62,679 | 55,394 | ||||||
Advances to suppliers |
10,820 | 7,920 | ||||||
Provision from slow moving and obsolescence |
(13,246 | ) | (12,309 | ) | ||||
|
|
|
|
|||||
Total inventories |
151,348 | 139,373 | ||||||
|
|
|
|
The provision for slow moving and obsolete inventories recognized within cost of sales during for the three months ended March 31, 2021 and December 31, 2020 is EUR 13,246 thousand and EUR 12,309 thousand respectively, with an accrual of EUR 1,777 thousand and utilizations for EUR 840 thousand for or the three months ended March 31, 2021.
22. Trade receivables and contract assets
Trade receivables and contract assets are analysed as follows:
At March 31, 2021 |
At December 31, 2020 |
|||||||
(EUR thousand) | ||||||||
Trade receivables |
148,962 | 135,514 | ||||||
Allowance for expected credit losses |
(8,678 | ) | (7,696 | ) | ||||
|
|
|
|
|||||
Total trade receivables |
140,283 | 127,818 | ||||||
|
|
|
|
|||||
Expected credit loss rate |
5.8 | % | 5.7 | % |
Trade receivables are non-interest bearing and are generally on term of 60 to 90 days. The Group is not exposed to significant concentration of third-party credit risk.
Trade receivables are stated net of an allowance for expected credit losses which has been determined in accordance with IFRS 9 amounting to EUR 8,678 thousand and EUR 7,696 thousand the three months ended March 31, 2021 and December 31, 2020 respectively.
Contract assets
Contract assets relate to revenue earned from ongoing customer-specific construction contracts of the Engineering segment and from the In-vitro diagnostic business. As such, the balances of this account vary and depend on the number of ongoing construction contracts at the end of the period. The Group has contract assets of EUR 40,946 thousand as of March 31, 2021 (EUR 39,430 thousand as of December 31, 2020). Contract assets gross amounts to EUR 103,348 thousand (EUR 86,905 thousand as of December 31, 2020), net of invoices issued of EUR 62,402 thousand (EUR 47,476 thousand as of December 31, 2020).
23. Tax receivables and tax payables
As of March 31, 2021, tax receivables amount to EUR 36,419 thousand (EUR 25,033 thousand as of December 31, 2020) and Tax liabilities amount to EUR 30,781 thousand (EUR 19,126 thousand as of December 31, 2020). Total net balance of tax receivables and payables is almost unchanged, due to some offsets to be considered, mainly related to VAT and corporate income taxes.
F-105
24. Equity
The main objective of the Groups capital management is to guarantee maintenance of a solid credit rating and adequate financial ratios with a view to supporting business activity and maximizing value for the shareholders.
Movements in the equity accounts are reported in the Interim Consolidated Statements of Changes in Equity; comments on the main components and their changes are provided below.
Share capital
On March 4, 2021, the extraordinary Shareholders meeting approved:
| the elimination of the indication of the nominal value of the 20,002 outstanding shares, |
| the issuance of additional 99,989,998 ordinary shares with no par value to be allocated free of charge to shareholders in proportion to the shares held by each of them, so that the share capital of EUR 20,002,000 is divided into a total of 100,010,000 ordinary shares with no par value, without giving rise to changes in the amount of the share capital. |
On July 1, 2021 the Shareholders meeting approved a further share split following which all the existing 100,010,000 shares have been split into a total of 272,427,240 shares in the ratio of 2,724 new shares post-split for each share outstanding prior to the share split.
Treasury reserve
On March 4, 2021, prior to the approval of the share split disclosed in in this note and following the shareholders meeting approval, the Company repurchased a total of n. 29 ordinary shares of Stevanato Group S.p.A. from one of beneficiaries of the awards under the 2012-2021 incentive plan for EUR 261 thousand.
Prior to the share split disclosed in this note, a total of 2,092 of Companys ordinary shares were held in treasury at December 31, 2020, for a total cost of EUR 26,189 thousand, and a total of 2,121 of Companys ordinary shares at March 31, 2021, for a total cost of EUR 26,450 thousand. The amounts of ordinary shares held in treasury disclosed in this note have been retrospectively adjusted to reflect the share splits occurred later on March 4, 2021 and July 1, 2021, resulting in a total number of ordinary shares held in treasury at March 31, 2021 and at December 31, 2020 of 28,888,020 thousand of 28,493,040 thousand respectively.
Currency translation reserve
The currency translation reserve includes the cumulative foreign currency translation differences arisen from the translation of financial statements denominated in currencies other than Euro; as of March 31, 2021 it amounts to EUR 32,336 thousand compared to EUR 34,911 thousand as of December 31, 2020. As of March 31, 2020 it amounted to EUR 30,191 thousand compared to EUR 12,331 thousand as of December 31, 2019. The high increase was mainly due to the depreciation against Euro of the Mexican Peso and the Brazilian Real occurred in the first quarter 2020 after Covid-19 outbreak.
Other Reserves
On January 20, 2021 Stevanato Group Shareholders meeting approved the distribution of EUR 11,200 thousand dividends from other reserves.
F-106
25. Financial liabilities
Total financial liabilities are EUR 368,096 thousand and EUR 375,358 thousand as of March 31, 2021 and as of December 31, 2020 respectively; the balances in financial debt are as follows:
At March 31, 2021 |
At December 31, 2020 |
|||||||
(EUR thousand) | ||||||||
Lease liabilitiesRight of Use |
5,578 | 5,435 | ||||||
Bank overdrafts |
4,633 | 581 | ||||||
Bank loans |
61,715 | 61,905 | ||||||
Financial liabilities with related parties |
943 | 968 | ||||||
Fair value of derivatives |
4,876 | 4,417 | ||||||
Financial payables for shares acquisition |
7,810 | 7,927 | ||||||
|
|
|
|
|||||
Total current financial liabilities |
85,555 | 81,234 | ||||||
|
|
|
|
|||||
Lease liabilitiesRight of Use |
19,839 | 20,186 | ||||||
Bank loans |
213,114 | 224,365 | ||||||
Notes |
49,588 | 49,573 | ||||||
|
|
|
|
|||||
Total non-current financial liabilities |
282,541 | 294,124 | ||||||
|
|
|
|
|||||
Financial liabilities |
368,096 | 375,358 | ||||||
|
|
|
|
Other current financial liabilities include EUR 1,103 thousand as of March 31, 2021 (EUR 1,221 thousand as of December 31, 2020) which refer to the unpaid amount of the purchase of the residual shares of Medirio SA as well as earn out obligations, both due in 2021 and EUR 6,706 thousand (unchanged compared to December 31, 2020) recognized in relation to the put option granted to non-controlling shareholders of SVM Automatik A/S.
Other current financial assets and other financial liabilities relates to foreign exchange derivatives. The following table sets further the analysis of derivative assets and liabilities at March 31, 2021 and December 31, 2020.
At March 31, 2021 |
At December 31, 2020 |
|||||||||||||||
Carrying amount |
Fair value |
Carrying amount |
Fair value |
|||||||||||||
(EUR thousand) | ||||||||||||||||
Financial assets |
||||||||||||||||
Foreign exchange forward contracts |
100 | 100 | 19 | 19 | ||||||||||||
Financial liabilities |
||||||||||||||||
Foreign exchange forward contracts |
943 | 943 | 16 | 16 | ||||||||||||
Interest Rate Swap in cash flow hedges |
3,933 | 3,933 | 4,386 | 4,386 |
Derivatives on currency risk have not been designated as hedging instruments and reflect the change in the fair value of those foreign exchange forward contracts that are not designated in hedge relationships, but are, nevertheless, intended to reduce the level of foreign currency risk for expected sales.
Derivatives designated as hedging instruments reflect the change in fair value of the interest rate swap contract, designated as cash flow hedges to hedge fluctuations in variable interest rate on loans. The amount recorded in the cash flow hedge reserve will be recognized in the consolidated income statement according to the timing of the cash flows of the underlying transaction.
F-107
26. Fair Value Measurement
IFRS 13 establishes a hierarchy that categorizes into three levels the inputs to the valuation techniques used to measure fair value by giving the highest priority to quoted prices (unadjusted) in active markets for identical assets and liabilities (level 1 inputs) and the lowest priority to unobservable inputs (level 3 inputs). In some cases, the inputs used to measure the fair value of an asset or a liability might be categorized within different levels of the fair value hierarchy. In those cases, the fair value measurement is categorized in its entirety in the same level of the fair value hierarchy at the lowest level input that is significant to the entire measurement.
Levels used in the hierarchy are as follows:
| Level 1: The fair value of financial instruments traded in active markets (such as publicly traded derivatives, and equity securities) is based on quoted market prices at the end of the reporting period. The quoted market price used for financial assets held by the group is the current bid price. These instruments are included in level 1. |
| Level 2: The fair value of financial instruments that are not traded in an active market (for example, over-the-counter derivatives) is determined using valuation techniques which maximise the use of observable market data and rely as little as possible on entity-specific estimates. If all significant inputs required to fair value an instrument are observable, the instrument is included in level 2. |
| Level 3: If one or more of the significant inputs is not based on observable market data, the instruments are included in level 3. This is the case for unlisted equity securities. |
Assets and liabilities that are measured at fair value on a recurring basis
The following table shows the fair value hierarchy for financial assets and liabilities that are measured at fair value on a recurring basis at March 31, 2021 and at December 31, 2020:
As at March 31, 2021:
Fair value measurement using | ||||||||||||||||
Total | Level 1 | Level 2 | Level 3 | |||||||||||||
(EUR thousand) | ||||||||||||||||
Cash and cash equivalents |
80,186 | 80,186 | | | ||||||||||||
Equity Investments others |
810 | | | 810 | ||||||||||||
Derivatives financial assets |
100 | | 100 | | ||||||||||||
Financial current assets |
41,417 | | 41,417 | | ||||||||||||
Other non-current financial assets |
623 | | 623 | | ||||||||||||
|
|
|
|
|
|
|
|
|||||||||
Total assets |
123,136 | 80,186 | 42,140 | 810 | ||||||||||||
|
|
|
|
|
|
|
|
|||||||||
Put & Call related to financial liabilities |
6,706 | | | 6,706 | ||||||||||||
Derivatives financial liabilities |
4,876 | | 4,876 | | ||||||||||||
Payables for subsidiary acquisition |
1,103 | | | 1,103 | ||||||||||||
|
|
|
|
|
|
|
|
|||||||||
Total Liabilities |
12,686 | | 4,876 | 7,810 | ||||||||||||
|
|
|
|
|
|
|
|
F-108
As at December 31, 2020:
Fair value measurement using | ||||||||||||||||
Total | Level 1 | Level 2 | Level 3 | |||||||||||||
(EUR thousand) | ||||||||||||||||
Cash and cash equivalents |
115,599 | 115,599 | | | ||||||||||||
Equity Investments others |
760 | | | 760 | ||||||||||||
Derivatives financial assets |
19 | | 19 | | ||||||||||||
Financial current assets |
41,523 | | 41,523 | | ||||||||||||
Other non-current financial assets |
610 | | 610 | | ||||||||||||
|
|
|
|
|
|
|
|
|||||||||
Total assets |
158,512 | 115,599 | 42,153 | 760 | ||||||||||||
|
|
|
|
|
|
|
|
|||||||||
Put & Call related to financial liabilities |
6,706 | | | 6,706 | ||||||||||||
Bonds at amortized cost |
49,573 | | 49,573 | | ||||||||||||
Derivatives financial liabilities |
4,417 | | 4,417 | | ||||||||||||
Payables for subsidiary acquisition |
1,221 | | | 1,221 | ||||||||||||
|
|
|
|
|
|
|
|
|||||||||
Total Liabilities |
61,917 | | 53,990 | 7,927 | ||||||||||||
|
|
|
|
|
|
|
|
The fair value of current financial assets and other financial liabilities is measured by taking into consideration market parameters at the balance sheet date, using valuation techniques widely accepted in the financial business environment.
The fair value of foreign currency derivatives (forward contracts, currency swaps and options) and interest rate swaps is determined by considering the prevailing foreign currency exchange rate and interest rates, as applicable, at the balance sheet date.
The value of cash and cash equivalents usually approximates fair value due to the short maturity of these instruments, which consist of bank current accounts. The fair value of other financial assets is measured through other unobservable input in accordance with IFRS 13, detailed in Note 20.
No borrowings of the Group are listed debt. There are no transfers between Level 1, Level 2 and Level 3 during the three months ended March 31, 2021 and the year ended December 31, 2020.
The fair value of the loans accounted for at amortized cost approximates their carrying amounts as of March 31, 2021 and December 31, 2020.
27. Employee benefits
Employee benefits are analysed as follows:
At March 31, 2021 |
At December 31, 2020 |
|||||||
(EUR thousand) | ||||||||
Employee Severance Pay |
5,712 | 5,791 | ||||||
Jubilee benefits |
239 | 239 | ||||||
Other Post-employment plans |
608 | 582 | ||||||
Long term incentive plan |
2,277 | 1,780 | ||||||
Cash settled awards |
17,925 | 21,333 | ||||||
|
|
|
|
|||||
Total employee benefits |
26,761 | 29,725 | ||||||
|
|
|
|
Long-term Incentive plan
In order to align the interests of management with those of the Shareholders over the medium/long-term by establishing a strong link between remuneration and performance the CEO approved a medium/long-term pan
F-109
called the Long-term Incentive plan for the 2020-2023 four-year period and involving a select number of Senior Management (Top Management and/or Key People) of the Companies of the Group and based on the meeting of the long-term industrial plan objectives.
Cash settled awards
Cash settled awards are incentive plans aimed at a limited number of executives and key resources of the Group. The 2012-2021 incentive plan and the 2018-2022 incentive plans were approved by the Board of Directors on February 9, 2012 and on September 12, 2018 respectively.
On March 4, 2021, the Company exercised a call option to buy back n. 29 shares from a beneficiary of the 2012-2021 cash settled award and irrevocably and unconditionally waived its rights to exercise the call option on n.5 shares (number of shares as before the share split). The parties also mutually agreed to close the 2018-2022 cash settled award; the net impact of such transactions led to a reduction in cash settled award liabilities.
28. Provisions
The balances as of March 31, 2021 are detailed below:
Provision for Warranty |
Decommissioning | Provision for legal and sundry risks |
Provision for agents and directors severance indemnity |
Total | ||||||||||||||||
(EUR thousand) | ||||||||||||||||||||
At January 1, 2021 |
1,061 | 523 | 1,664 | 1,136 | 4,384 | |||||||||||||||
Arising during the period |
34 | 6 | 4,285 | 13 | 4,337 | |||||||||||||||
Utilised |
| | (532 | ) | | (532 | ) | |||||||||||||
Unused amounts reversed |
| | (6 | ) | | (6 | ) | |||||||||||||
Exchange rate difference |
0 | 25 | (26 | ) | | (2 | ) | |||||||||||||
|
|
|
|
|
|
|
|
|
|
|||||||||||
At March 31, 2021 |
1,094 | 553 | 5,385 | 1,149 | 8,182 | |||||||||||||||
|
|
|
|
|
|
|
|
|
|
|||||||||||
Current |
| | | | | |||||||||||||||
Non-current |
1,094 | 553 | 5,385 | 1,149 | 8,182 |
The warranty provision represents the best estimate of commitments given by the Group for contractual, legal, or constructive obligations arising from product warranties given for a specified period of time. Such provisions are recognized on shipment of the goods to the customers. The warranty provision is estimated on the basis of the Groups past experience and contractual terms. Related costs are recognized within cost of sales.
The provision for legal proceeding and sundry risks represents managements best estimate of the expenditures expected to be required to settle on otherwise resolve legal proceeding and disputes.
The increase in the three months ended March 31, 2021 is mainly due to a potential claim with a customer.
29. Other non-current liabilities
Other non-current liabilities as of March 31, 2021 and December 31, 2020 amount to EUR 1,823 thousand respectively EUR 1,808 thousand and are mainly related to holiday pay of Danish companies employees following the transition to the new Danish Holiday Act started in 2019.
30. Trade payables and other current liabilities
Trade payables amount to EUR 87,388 thousand at March 31, 2021 (EUR 118,740 thousand at December 31, 2020) and other current liabilities amount to EUR 46,518 thousand at March 31, 2021 (EUR 43,683 thousand at December 31, 2020), both are entirely due within one year. The carrying amount of trade payables is considered to be equivalent to their fair value.
F-110
31. Contract liabilities and advances from customers
Contract liabilities and advances from customers are as follows:
At March 31, 2021 |
At December 31, 2020 |
|||||||
(EUR thousand) | ||||||||
Contract Liabilities |
5,393 | 5,031 | ||||||
Advances from customers |
52,383 | 48,361 | ||||||
|
|
|
|
|||||
Total contract liabilities and advances from customers |
57,776 | 53,392 | ||||||
|
|
|
|
Contract liabilities relate to revenue earned from ongoing customer-specific construction contracts of the Engineering System Division and of the In-vitro diagnostic business. The Group has contract net liabilities of EUR 5,393 thousand and EUR 5,031 thousand as of March 31, 2021 and as of December 31, 2020 respectively. Contract assets gross amounts to EUR 11,745 thousand (EUR 10,828 thousand as of December 31, 2020), net of invoices issues of EUR 17,137 thousand (EUR 15,859 thousand as of December 31, 2020).
Advances from customers relate to sales whose revenues are recognised at point in time.
32. Related party disclosures
According to IAS 24, the related parties of the Group are entities and individuals capable of exercising control, joint control or significant influence over the Group and its subsidiaries, companies belonging to the Stevanato Group S.p.A. the controlling company Stevanato Holding S.r.l., unconsolidated subsidiaries of the Group and associates. In addition, members of Stevanato Groups Board of Directors and executives with strategic responsibilities and their families are also considered related parties. The Group carries out transactions with related parties on commercial terms that are normal in the respective markets, considering the characteristics of the goods or services involved.
Note 4 provide information about the Groups structure, including details of the subsidiaries and the holding company.
Transaction with related parties refer to:
| revenues for closure containment solution from the associate Swissfillon AG; |
| service fees and rentals paid to Winkler & Co Ltd, the company whose owner holds minority interests in the subsidiary Ompi of Japan; |
| the purchase of products and rentals paid to Società Agricola Stella S.r.l., controlled by SFEM Italia S.r.l.; |
| rentals paid to SFEM Italia S.r.l., controlled by Stevanato family; |
| consulting services rented by MJB Consultants LLC, Progenitor Capital Partners LLC and Studio Legale Spinazzi Azzarita Troi, whose beneficial owners are Board members in Stevanato Group; |
| industrial rentals paid to E & FKH Ejendomme ApS, whose beneficial owners are family members of the minority shareholders of the subsidiary SVM; |
| rentals paid to members of Stevanato family; |
| in 2017 the Company disbursed a loan of EUR 1,069 thousand to Mr. Fabrizio Bonanni to facilitate the acquisition of shares under the cash settled award. Mr. Fabrizio Bonanni is a member of the board of Stevanato Group. Such loan has been fully reimbursed and terminated on March 10, 2021; |
F-111
| in 2017 the Company disbursed a loan of EUR 2,239 thousand to Mr. Mauro Stocchi to facilitate the acquisition of shares under the cash settled award Mr. Mauro Stocchi is Chief Business Officer of Stevanato Group. |
| donations to the Stevanato Foundation, owned by Stevanato family. The foundation exclusively pursues the aims of social solidarity, philanthropy and charity, operating in the fields of social and socio-medical assistance, education and training as well as cultural and educational activities and scientific research. The Foundation intervenes in support of children and young people in situations of serious difficulty due to their illnesses, the distress of their families or other situations that may affect their health or growth. |
Transactions with related parties also include compensation to directors and managers with strategic responsibilities.
The amounts of transactions with related parties recognized in the Interim Consolidated Income Statement and the related assets and liabilities are as follows:
For the three months ended March 31, | ||||||||||||||||||||||||
2021 | 2020 | |||||||||||||||||||||||
Revenues | Costs* | Net financial expense |
|||||||||||||||||||
(EUR thousand) | ||||||||||||||||||||||||
Associate companies: |
||||||||||||||||||||||||
Swissfillon AG |
| | | 23 | | | ||||||||||||||||||
Other related parties |
| (703 | ) | (11 | ) | | 1,727 | (12 | ) | |||||||||||||||
|
|
|
|
|
|
|
|
|
|
|
|
|||||||||||||
Total transactions with related parties |
| (703 | ) | (11 | ) | 23 | 1,727 | (12 | ) | |||||||||||||||
|
|
|
|
|
|
|
|
|
|
|
|
* | Costs include cost of sale, selling, general administrative costs and other expenses net |
As at March 31, | As at December 31, | |||||||||||||||||||||||||||||||
2021 | 2020 | |||||||||||||||||||||||||||||||
Trade receivables |
Trade payables |
Other assets |
Financial assets or liabilities |
Trade receivables |
Trade payables |
Other assets |
Financial assets or liabilities |
|||||||||||||||||||||||||
(EUR thousand) | ||||||||||||||||||||||||||||||||
Associate companies: |
||||||||||||||||||||||||||||||||
Swissfillon AG |
| | | 1,313 | 88 | | | 1,342 | ||||||||||||||||||||||||
Other related parties |
| 158 | | 3,975 | | 55 | 24 | 3,646 | ||||||||||||||||||||||||
|
|
|
|
|
|
|
|
|
|
|
|
|
|
|
|
|||||||||||||||||
Total transactions with related parties |
| 158 | | 5,288 | 88 | 55 | 24 | 4,988 | ||||||||||||||||||||||||
|
|
|
|
|
|
|
|
|
|
|
|
|
|
|
|
As of March 31, 2021 costs for other related parties include the positive effect from the closing of cash settled awards for one of the beneficiaries.
33. Covid-19 Pandemic
At the beginning of 2020, the World Health Organization declared the existence of an international emergency following the spread of Covid-19 virus. Since the early stages of the spread of the epidemic, Stevanato Group has been strongly committed to safeguarding the health and safety of its employees, ensuring at the same time business continuity in all its premises. The company has implemented strict precautionary measures provided by national and regional regulations on personal and workplace hygiene, as well as on the organization of working life (such as reorganization of shifts) at its plants. It has adopted measures to avoid
F-112
crowdings, maximizing the use of remote working, allowing access to external personnel only if in compliance with current legislation. Sensitization activities about the importance of prevention, both at work and home, have been made throughout the period, and screening activities among staff have been performed when needed to increase prevention further.
Short-term impacts of Covid-19 on Stevanato Group production and operational capabilities included: (i) labor absenteeism; (ii) disruptions to production lines; (iii) delays in, and increased costs of, logistics; (iv) short-term drop in sales of certain non- Covid-19 related orders which were cancelled and or postponed; and (v) increased labor costs in the form of employee bonuses to recognize and reward general efforts during the pandemic.
Long-term effects of Covid-19 have included the acceleration of the Group business plan and growth strategy due to a general increase in demand for our products, processes and services. A significant part of our production has been devoted to supporting our customers in providing a rapid response to Covid-19 since the inception of the pandemic. The group has been supplying: (i) glass vials and syringes to producer of vaccines already in commercial phase as well as to more than 80% of the treatment and vaccine programs in advanced development phases (Phase I to Phase III) according to our estimates based on public information about treatments and vaccines (WHO, EMA, FDA); (ii) plastic diagnostic consumables for the detection and diagnosis of Covid-19; (iii) glass forming lines, which are being installed worldwide, to facilitate the distribution of glass bulks and sterile vials and syringes; and (iv) visual inspections systems. The governmental measures adopted to contain the outbreak of Covid-19 have also impacted the Group ability to carry out business development activities in the past few months; we believe this may have an impact on our ability to broaden our customer portfolio in the immediate future. Currently, it is not possible to predict with certainty the full scope of the impact of Covid-19 on our business and operations given much rests on future developments of the outbreak.
34. Events after the reporting period
The Group has evaluated subsequent events through April 30, 2021, which is the date the Interim Condensed Consolidated Financial Statements were authorized for issuance. Management retrospectively adjusted the amounts of ordinary shares presented to effect the share splits occurred on March 4, 2021 and July 1, 2021, as further discussed below.
On March 4, 2021, the Shareholders meeting approved the so called Restricted Stock Grant Plan Stevanato Group S.p.A. 2021-2027 and empowered the Board of Directors to implement the incentive plan, including the identification of beneficiaries from personnel with strategic roles in the Group.
By means of a grant letter delivered to each beneficiary on April 15, 2021, Stevanato Group notified each beneficiary of the number of shares allotted to the beneficiary free of charge in relation to the first vesting period, the restrictions relating to such shares, the criteria for the allotment of the further allotted shares, as well as the main contents of the rules.
The formalities necessary to procure the free transfer of ownership of the assigned shares reported above shall be carried out on May 4, 2021.
In April of 2021, following approvals from its Board of Directors in the meeting held on February 18, 2021, the Company executed relevant agreements to terminate the cash settled awards under the 2012-2021 and 2018-2022 incentive plans.
On July 1, 2021 the Shareholders meeting approved a further share split following which all the existing 100,010,000 shares have been split into a total of 272,427,240 shares in the ratio of 2,724 new shares post-split for each share outstanding prior to the share split.
F-113
Ordinary Shares
PROSPECTUS
July 15, 2021
MORGAN STANLEY | BofA SECURITIES | JEFFERIES |
CITIGROUP | UBS INVESTMENT BANK |
KEYBANC CAPITAL MARKETS |
WELLS FARGO SECURITIES |
WILLIAM BLAIR |
Through and including August 9, 2021 (25 days after the date of this prospectus), all dealers that buy, sell or trade our ordinary shares, whether or not participating in this offering, may be required to deliver a prospectus. This delivery requirement is in addition to the dealers obligation to deliver a prospectus when acting as underwriters and with respect to their unsold allotments or subscriptions.