
Second Quarter 2021 Financial Results August 19, 2021 Exhibit 99.1
Forward-Looking Statements This presentation contains certain forward-looking statements which include, or may include, words such as "raising", "believe", "potential", "increased", "future", "remain", "growing", "expect", "foreseeable", "expected", "to be", "includes", "estimated", "assumes", "would provide", and other similar terminology. Forward-looking statements contained in this prospectus include, but are not limited to, statements about: our future financial performance, including our revenue, operating expenses, and our ability to maintain profitability and operational and commercial capabilities; our expectations regarding the development of our industry and the competitive environment in which we operate; and our goals and strategies. The following are some of the factors that could cause our actual results to differ materially from those expressed in or underlying our forward-looking statements : (i) our product offerings are highly complex, and, if our products do not satisfy applicable quality criteria, specifications and performance standards, we could experience lost sales, delayed or reduced market acceptance of our products, increased costs and damage to our reputation; (ii) we must develop new products and enhance existing products, adapt to significant technological and innovative changes and respond to introductions of new products by competitors to remain competitive; (iii) our backlog might not accurately predict our future revenue, and we might not realize all or any part of the anticipated revenue reflected in our backlog; (iv) if we fail to maintain and enhance our brand and reputation, our business, results of operations and prospects may be materially and adversely affected; (v) we are highly dependent on our management and employees. Competition for our employees is intense, and we may not be able to attract and retain the highly skilled employees that we need to support our business and our intended future growth; (vi) our business, financial condition and results of operations depend upon maintaining our relationships with suppliers and service providers; (vii) our business, financial condition and results of operations depend upon the availability and price of high-quality materials and energy supply and our ability to contain production costs; (viii) significant interruptions in our operations could harm our business, financial condition and results of operations; (ix) our manufacturing facilities are subject to operating hazards which may lead to production curtailments or shutdowns and have an adverse effect on our business, results of operations, financial condition or cash flows; and (x) our business may be harmed if our customers discontinue or spend less on research, development, production or other scientific endeavors; (xi) we may face significant competition in implementing our strategies for revenue growth in light of actions taken by our competitors. This list is not exhaustive. These forward-looking statements speak only as at their dates. The Company undertakes no obligation to update any forward-looking statement or statements to reflect events or circumstances after the date on which such statement is made or to reflect the occurrence of unanticipated events. New factors emerge from time to time, and it is not possible to predict all of these factors. Further, the Company cannot assess the impact of each such factor on our business or the extent to which any factor, or combination of factors, may cause actual results to be materially different from those contained in any forward-looking statements. This press release also contains certain estimates regarding the Company's future prospects and performance, including, but not limited to, future revenues and earnings per share, capital deployment. All such statements and projections are based upon current expectations of the Company and involve a number of business risks and uncertainties. The Company disclaimers any current intention to update such guidance, except as required by law. For a description of certain additional factors that could cause the Company's future results to differ from those expressed in any such forward-looking statements, see Part II, Item 1A. entitled "Risk Factors" in the Company's Quarterly Report on Form 6-K for the quarterly period ended June 30, 2021 and "Risk Factors" in our registration statement on Form F-1, dated July 16, 2021 and which was filed with the U.S. Securities and Exchange Commission in accordance with Rule 424(b) of the Securities Act of 1933, as amended, on July 16, 2021. Non-GAAP Financial Information This presentation contains non-GAAP measures. Please refer to the tables included in this Q2 2021 Earnings Press Release for a reconciliation of non-GAAP measures. Management monitors and evaluates our operating and financial performance using several non-GAAP financial measures, including Constant Currency Revenue, EBITDA, Adjusted EBITDA, Adjusted EBITDA Margin, Adjusted Operating Profit, Adjusted Operating Profit Margin, CAPEX, Adjusted Diluted EPS, Net Debt, and Free Cash Flow. We believe that these non-GAAP financial measures provide useful and relevant information regarding our performance and improve our ability to assess our financial condition. While similar measures are widely used in the industry in which we operate, the financial measures we use may not be comparable to other similarly titled measures used by other companies, nor are they intended to be substitutes for measures of financial performance or financial position as prepared in accordance with IFRS. Safe-Harbor Statement
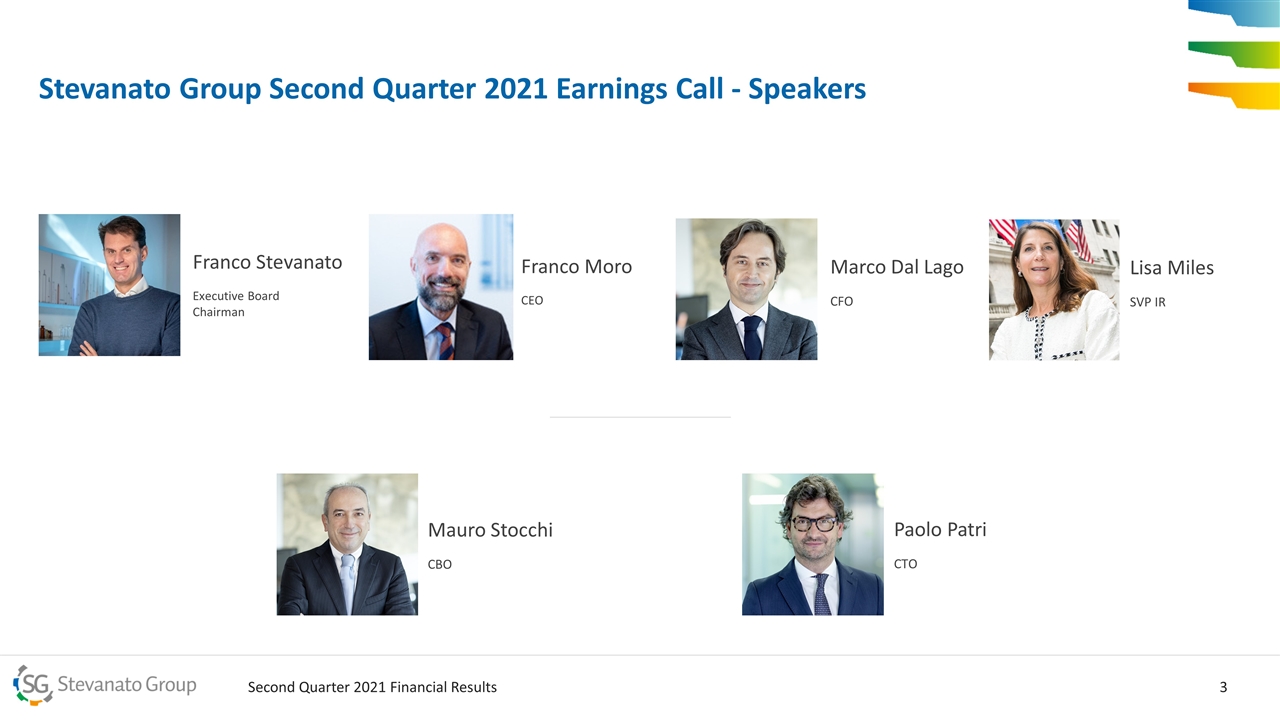
Stevanato Group Second Quarter 2021 Earnings Call - Speakers Franco Stevanato Executive Board Chairman Franco Moro CEO Marco Dal Lago CFO Lisa Miles SVP IR Mauro Stocchi CBO Paolo Patri CTO
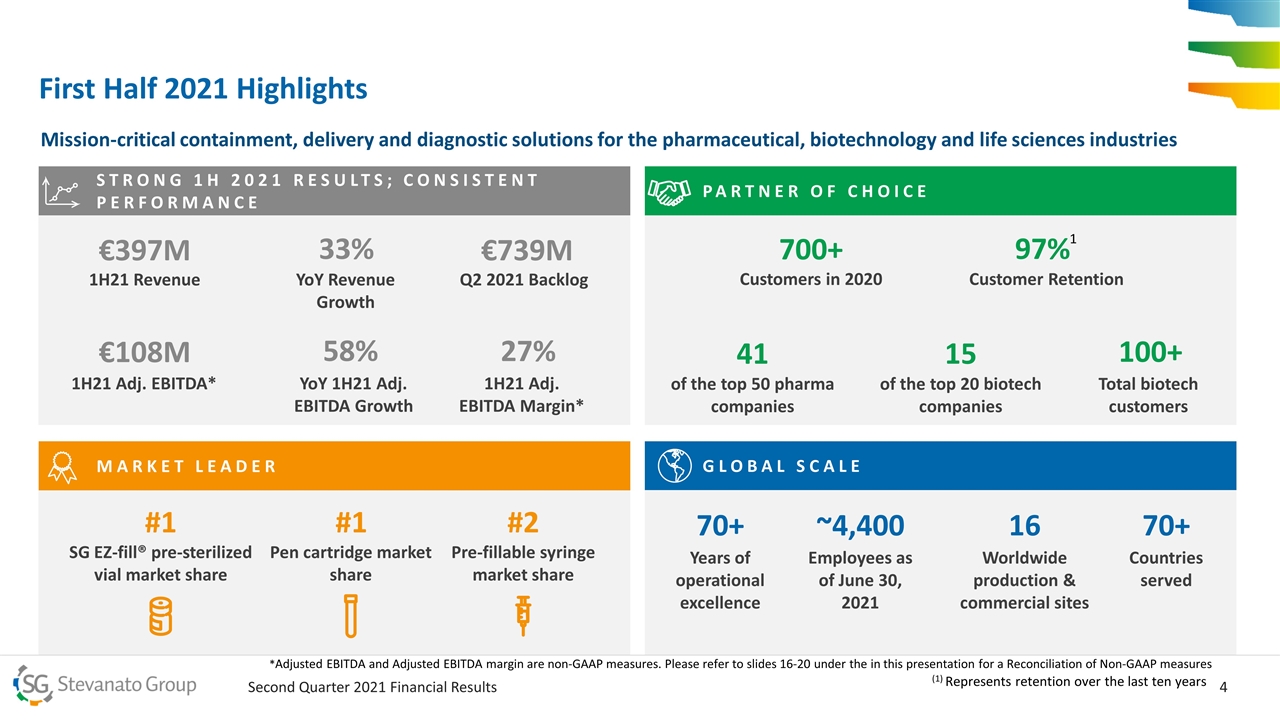
PARTNER OF CHOICE SG EZ-fill® pre-sterilized vial market share STRONG 1H 2021 RESULTS; CONSISTENT PERFORMANCE First Half 2021 Highlights Mission-critical containment, delivery and diagnostic solutions for the pharmaceutical, biotechnology and life sciences industries €397M 1H21 Revenue 33% YoY Revenue Growth €108M 1H21 Adj. EBITDA* 58% YoY 1H21 Adj. EBITDA Growth 70+ Years of operational excellence ~4,400 Employees as of June 30, 2021 16 Worldwide production & commercial sites 97% Customer Retention #1 Pen cartridge market share #2 Pre-fillable syringe market share 700+ Customers in 2020 100+ Total biotech customers 41 of the top 50 pharma companies 15 of the top 20 biotech companies 27% 1H21 Adj. EBITDA Margin* 70+ Countries served €739M Q2 2021 Backlog GLOBAL SCALE MARKET LEADER #1 1 (1) Represents retention over the last ten years *Adjusted EBITDA and Adjusted EBITDA margin are non-GAAP measures. Please refer to slides 16-20 under the in this presentation for a Reconciliation of Non-GAAP measures
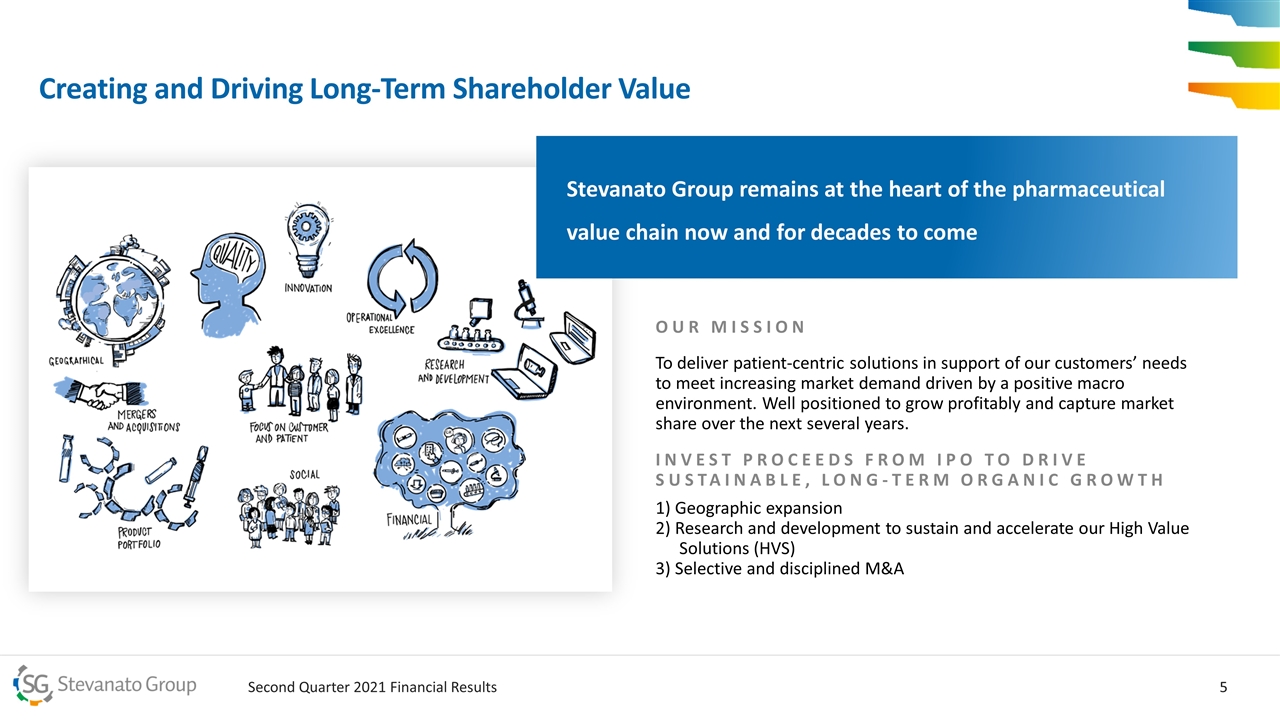
OUR MISSION To deliver patient-centric solutions in support of our customers’ needs to meet increasing market demand driven by a positive macro environment. Well positioned to grow profitably and capture market share over the next several years. INVEST PROCEEDS FROM IPO TO DRIVE SUSTAINABLE, LONG-TERM ORGANIC GROWTH 1) Geographic expansion 2) Research and development to sustain and accelerate our High Value Solutions (HVS) 3) Selective and disciplined M&A Creating and Driving Long-Term Shareholder Value Our Mission Stevanato Group remains at the heart of the pharmaceutical value chain now and for decades to come
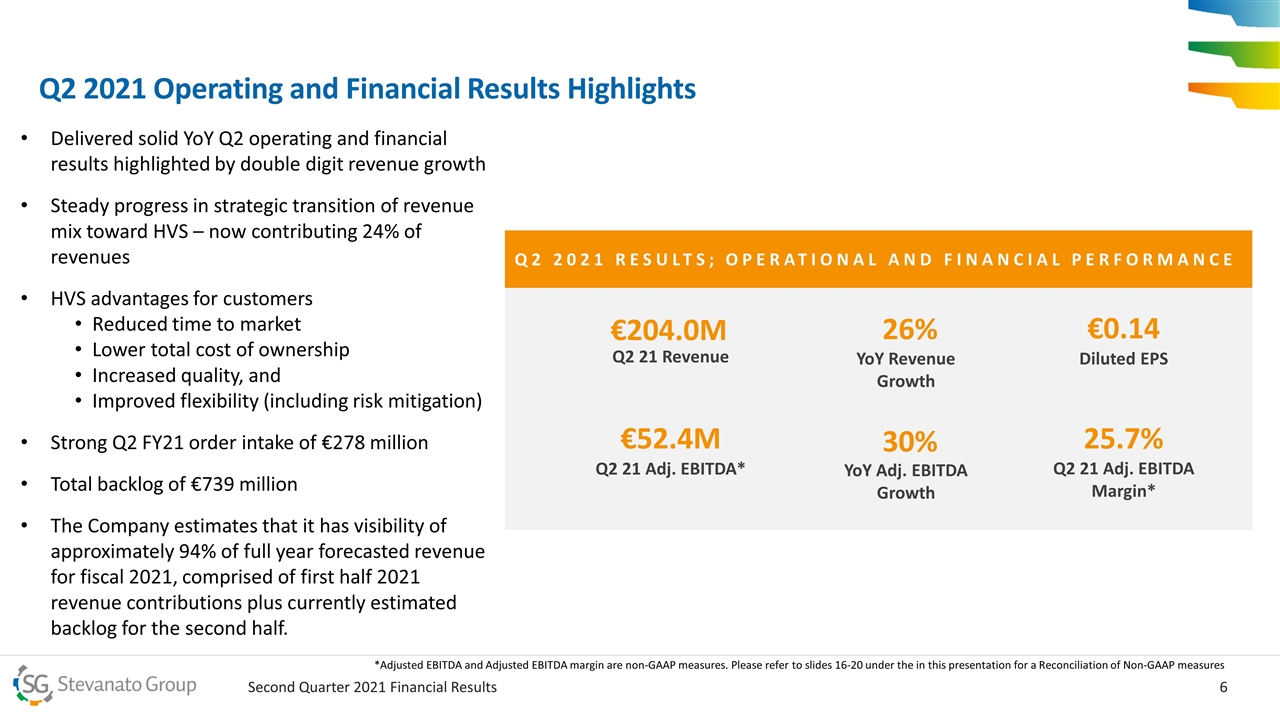
Q2 2021 RESULTS; OPERATIONAL AND FINANCIAL PERFORMANCE €204.0M Q2 21 Revenue 26% YoY Revenue Growth €52.4M Q2 21 Adj. EBITDA* 30% YoY Adj. EBITDA Growth 25.7% Q2 21 Adj. EBITDA Margin* €0.14 Diluted EPS Delivered solid YoY Q2 operating and financial results highlighted by double digit revenue growth Steady progress in strategic transition of revenue mix toward HVS – now contributing 24% of revenues HVS advantages for customers Reduced time to market Lower total cost of ownership Increased quality, and Improved flexibility (including risk mitigation) Strong Q2 FY21 order intake of €278 million Total backlog of €739 million The Company estimates that it has visibility of approximately 94% of full year forecasted revenue for fiscal 2021, comprised of first half 2021 revenue contributions plus currently estimated backlog for the second half. Q2 2021 Operating and Financial Results Highlights *Adjusted EBITDA and Adjusted EBITDA margin are non-GAAP measures. Please refer to slides 16-20 under the in this presentation for a Reconciliation of Non-GAAP measures
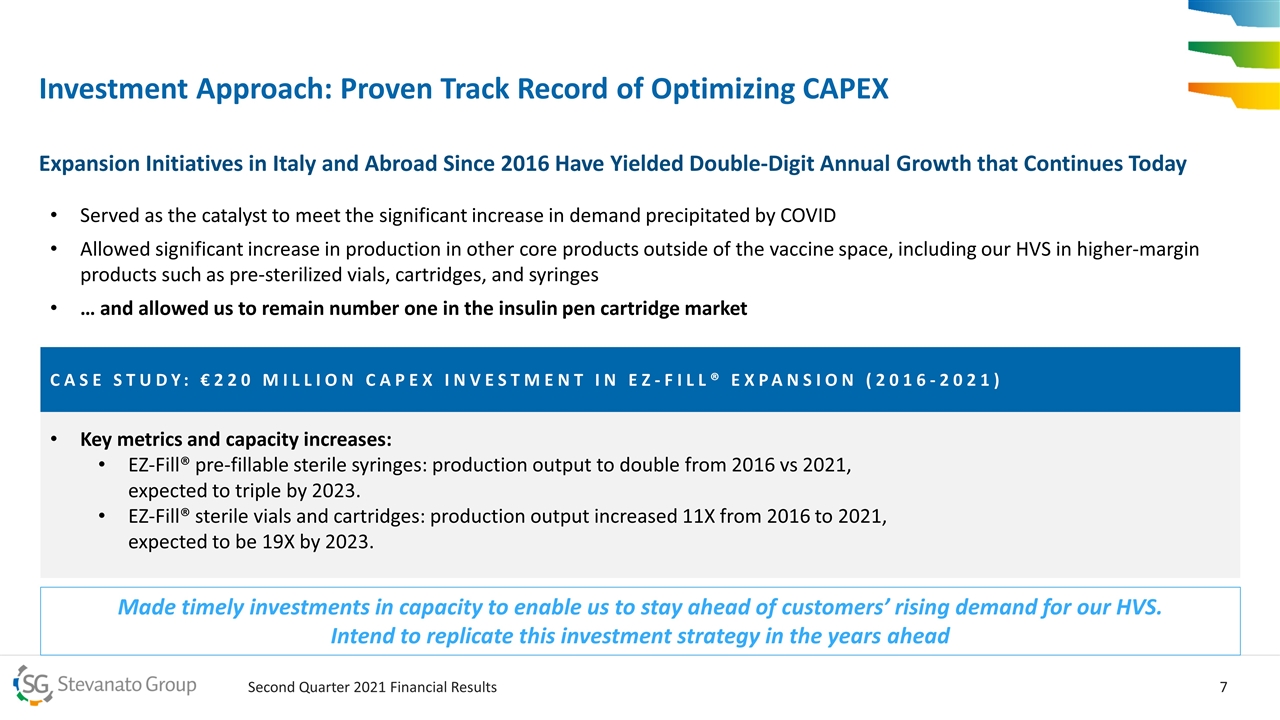
Key metrics and capacity increases: EZ-Fill® pre-fillable sterile syringes: production output to double from 2016 vs 2021, expected to triple by 2023. EZ-Fill® sterile vials and cartridges: production output increased 11X from 2016 to 2021, expected to be 19X by 2023. CASE STUDY: €220 MILLION CAPEX INVESTMENT IN EZ-FILL® EXPANSION (2016-2021) Investment Approach: Proven Track Record of Optimizing CAPEX Expansion Initiatives in Italy and Abroad Since 2016 Have Yielded Double-Digit Annual Growth that Continues Today Served as the catalyst to meet the significant increase in demand precipitated by COVID Allowed significant increase in production in other core products outside of the vaccine space, including our HVS in higher-margin products such as pre-sterilized vials, cartridges, and syringes … and allowed us to remain number one in the insulin pen cartridge market Made timely investments in capacity to enable us to stay ahead of customers’ rising demand for our HVS. Intend to replicate this investment strategy in the years ahead
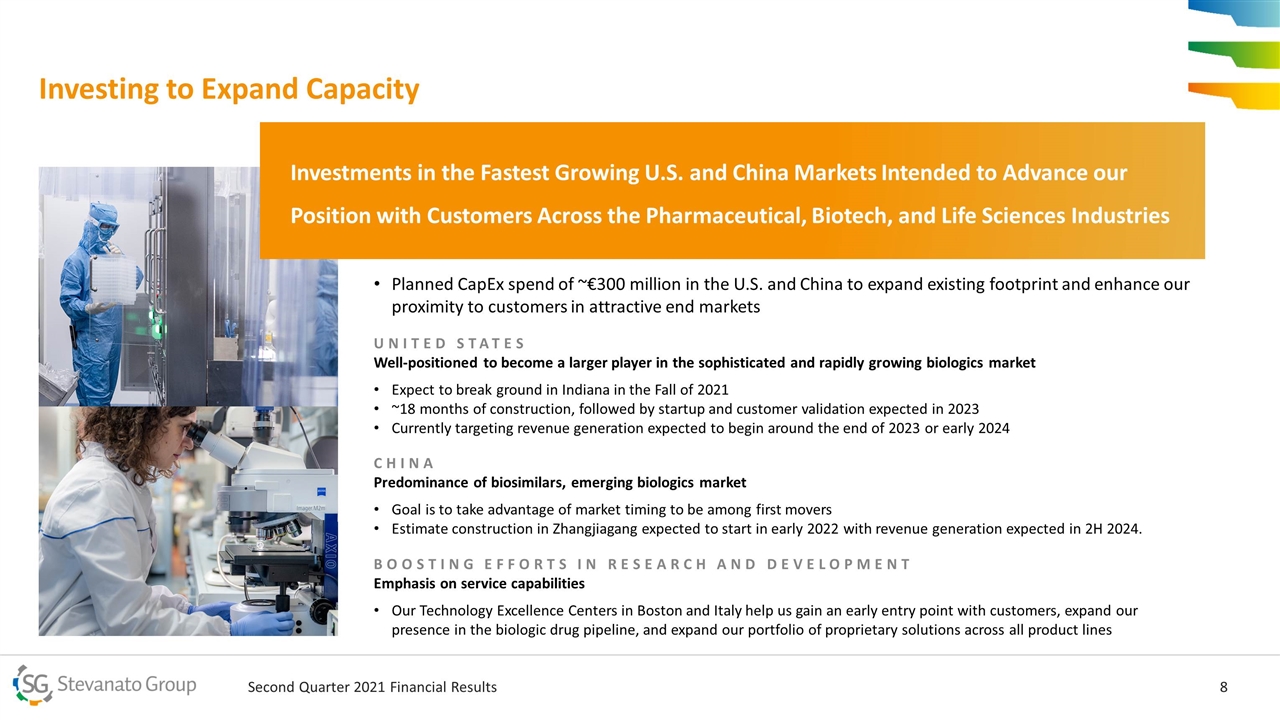
Planned CapEx spend of ~€300 million in the U.S. and China to expand existing footprint and enhance our proximity to customers in attractive end markets UNITED STATES Well-positioned to become a larger player in the sophisticated and rapidly growing biologics market Expect to break ground in Indiana in the Fall of 2021 ~18 months of construction, followed by startup and customer validation expected in 2023 Currently targeting revenue generation expected to begin around the end of 2023 or early 2024 CHINA Predominance of biosimilars, emerging biologics market Goal is to take advantage of market timing to be among first movers Estimate construction in Zhangjiagang expected to start in early 2022 with revenue generation expected in 2H 2024. BOOSTING EFFORTS IN RESEARCH AND DEVELOPMENT Emphasis on service capabilities Our Technology Excellence Centers in Boston and Italy help us gain an early entry point with customers, expand our presence in the biologic drug pipeline, and expand our portfolio of proprietary solutions across all product lines Investments in the Fastest Growing U.S. and China Markets Intended to Advance our Position with Customers Across the Pharmaceutical, Biotech, and Life Sciences Industries Investing to Expand Capacity
Current Macro Trends Generate Favorable Tailwinds for Decades to Come Need to address major challenges, including: Aging populations Increasing complexity in health conditions and comorbidity rates Significant shift in patients seeking to manage their conditions and access care closer to their home environment We believe we are uniquely well-positioned to capitalize on trends Our priority is to support our customers in creating and delivering the patient-centric solutions, which is central to our philosophy and vison
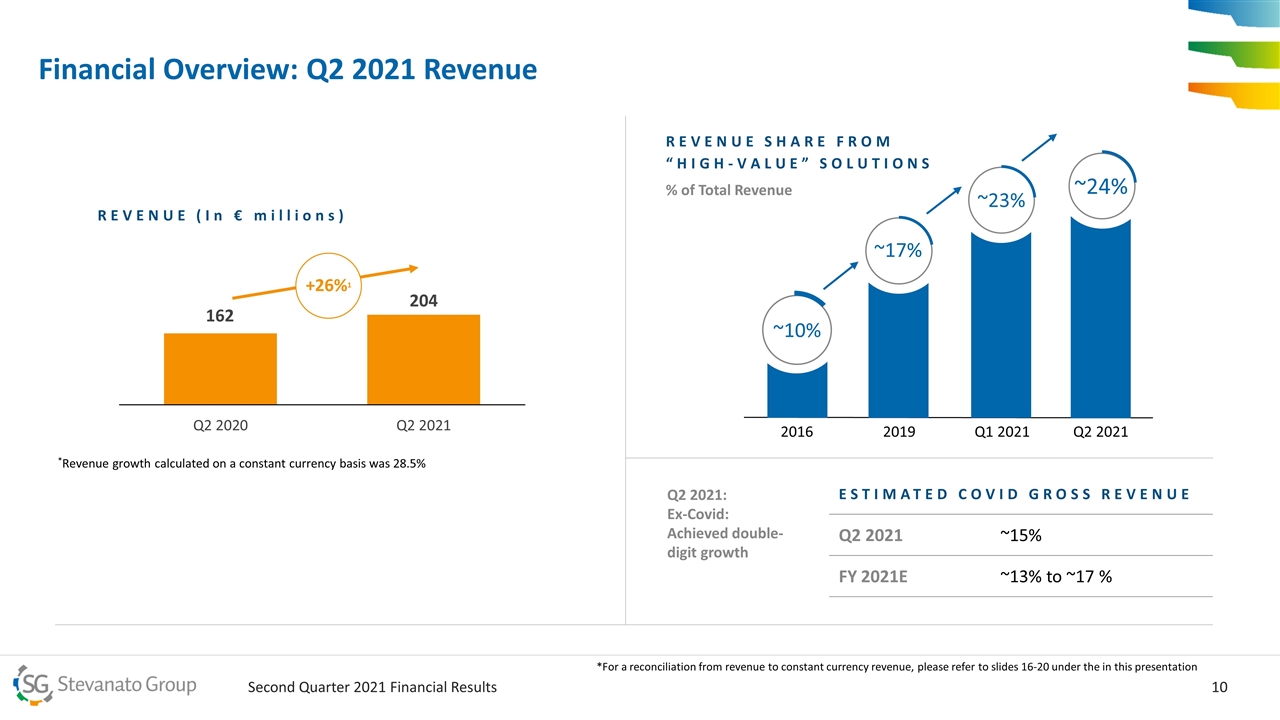
Financial Overview: Q2 2021 Revenue REVENUE (In € millions) +26%1 *Revenue growth calculated on a constant currency basis was 28.5% REVENUE SHARE FROM “HIGH-VALUE” SOLUTIONS 2019 ~17% Q1 2021 ~23% ~10% 2016 Q2 2021 ~24% ESTIMATED COVID GROSS REVENUE Estimated Covid Gross Revenue Q2 2021 ~15% FY 2021E ~13% to ~17 % Q2 2021: Ex-Covid: Achieved double-digit growth *For a reconciliation from revenue to constant currency revenue, please refer to slides 16-20 under the in this presentation
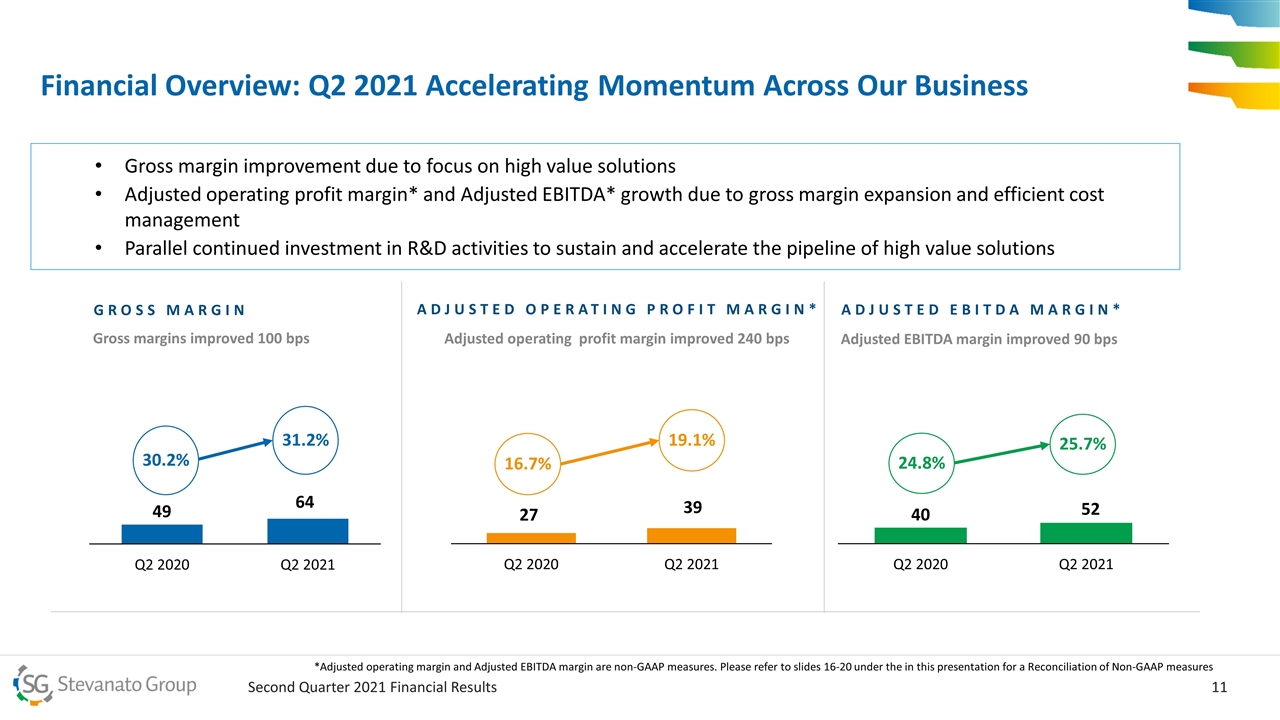
Financial Overview: Q2 2021 Accelerating Momentum Across Our Business overall_0_132573506445777536 columns_7_132584762853721572 3_1_132573506445777536 6_1_132573506445777536 9_1_132573506445777536 12_1_132573506445777536 13_1_132573506445777536 14_1_132573506445777536 15_1_132573506445777536 18_1_132573506445777536 21_1_132573506445777536 19.1% 31.2% GROSS MARGIN ADJUSTED OPERATING PROFIT MARGIN* 25.7% Gross margins improved 100 bps Adjusted operating profit margin improved 240 bps Adjusted EBITDA margin improved 90 bps Gross margin improvement due to focus on high value solutions Adjusted operating profit margin* and Adjusted EBITDA* growth due to gross margin expansion and efficient cost management Parallel continued investment in R&D activities to sustain and accelerate the pipeline of high value solutions 30.2% 16.7% 24.8% ADJUSTED EBITDA MARGIN* *Adjusted operating margin and Adjusted EBITDA margin are non-GAAP measures. Please refer to slides 16-20 under the in this presentation for a Reconciliation of Non-GAAP measures
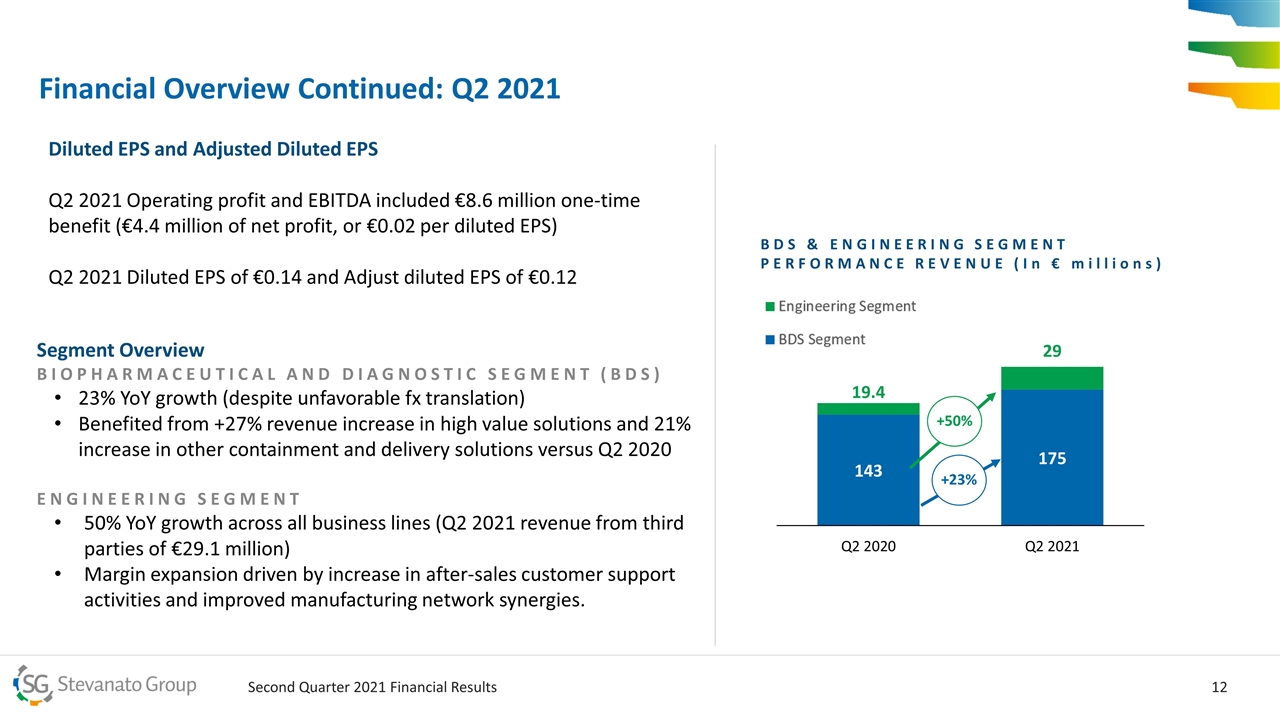
Financial Overview Continued: Q2 2021 Segment Overview BIOPHARMACEUTICAL AND DIAGNOSTIC SEGMENT (BDS) 23% YoY growth (despite unfavorable fx translation) Benefited from +27% revenue increase in high value solutions and 21% increase in other containment and delivery solutions versus Q2 2020 ENGINEERING SEGMENT 50% YoY growth across all business lines (Q2 2021 revenue from third parties of €29.1 million) Margin expansion driven by increase in after-sales customer support activities and improved manufacturing network synergies. +23% +50% BDS & ENGINEERING SEGMENT PERFORMANCE REVENUE (In € millions) Diluted EPS and Adjusted Diluted EPS Q2 2021 Operating profit and EBITDA included €8.6 million one-time benefit (€4.4 million of net profit, or €0.02 per diluted EPS) Q2 2021 Diluted EPS of €0.14 and Adjust diluted EPS of €0.12
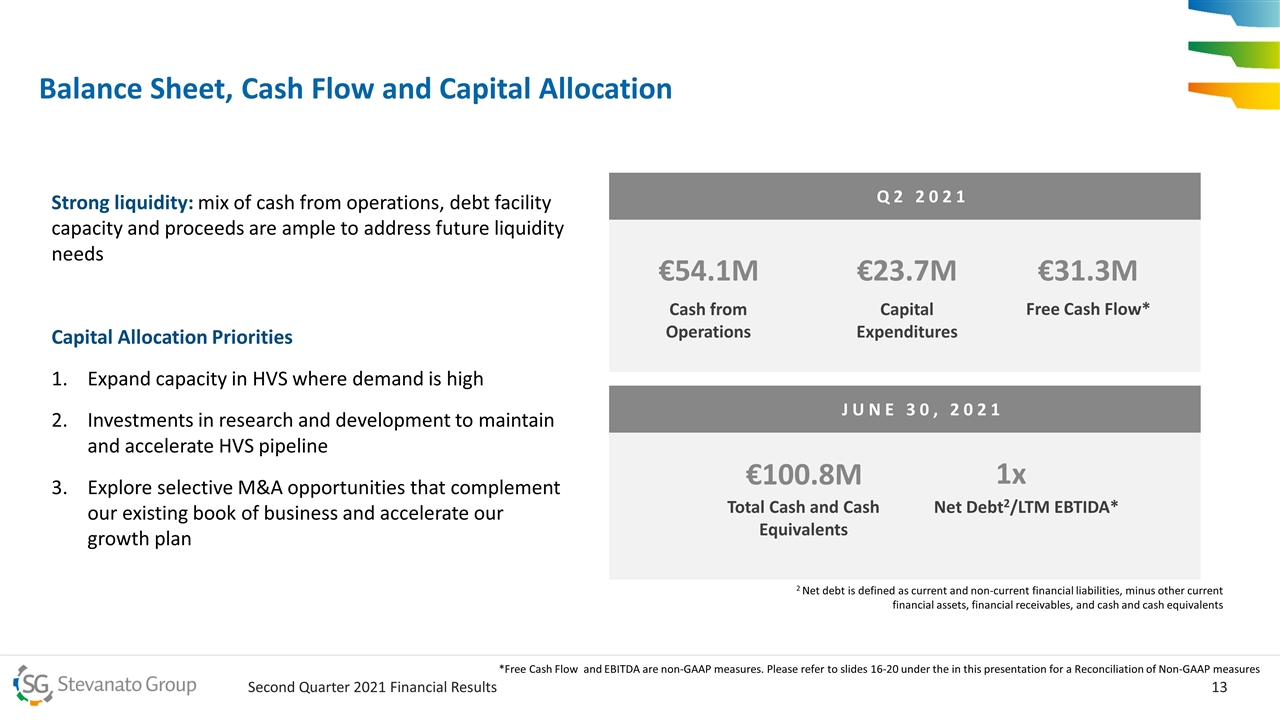
Balance Sheet, Cash Flow and Capital Allocation Strong liquidity: mix of cash from operations, debt facility capacity and proceeds are ample to address future liquidity needs Capital Allocation Priorities Expand capacity in HVS where demand is high Investments in research and development to maintain and accelerate HVS pipeline Explore selective M&A opportunities that complement our existing book of business and accelerate our growth plan Q2 2021 €54.1M Cash from Operations €23.7M Capital Expenditures €31.3M Free Cash Flow* JUNE 30, 2021 €100.8M Total Cash and Cash Equivalents 1x Net Debt2/LTM EBTIDA* 2 Net debt is defined as current and non-current financial liabilities, minus other current financial assets, financial receivables, and cash and cash equivalents *Free Cash Flow and EBITDA are non-GAAP measures. Please refer to slides 16-20 under the in this presentation for a Reconciliation of Non-GAAP measures
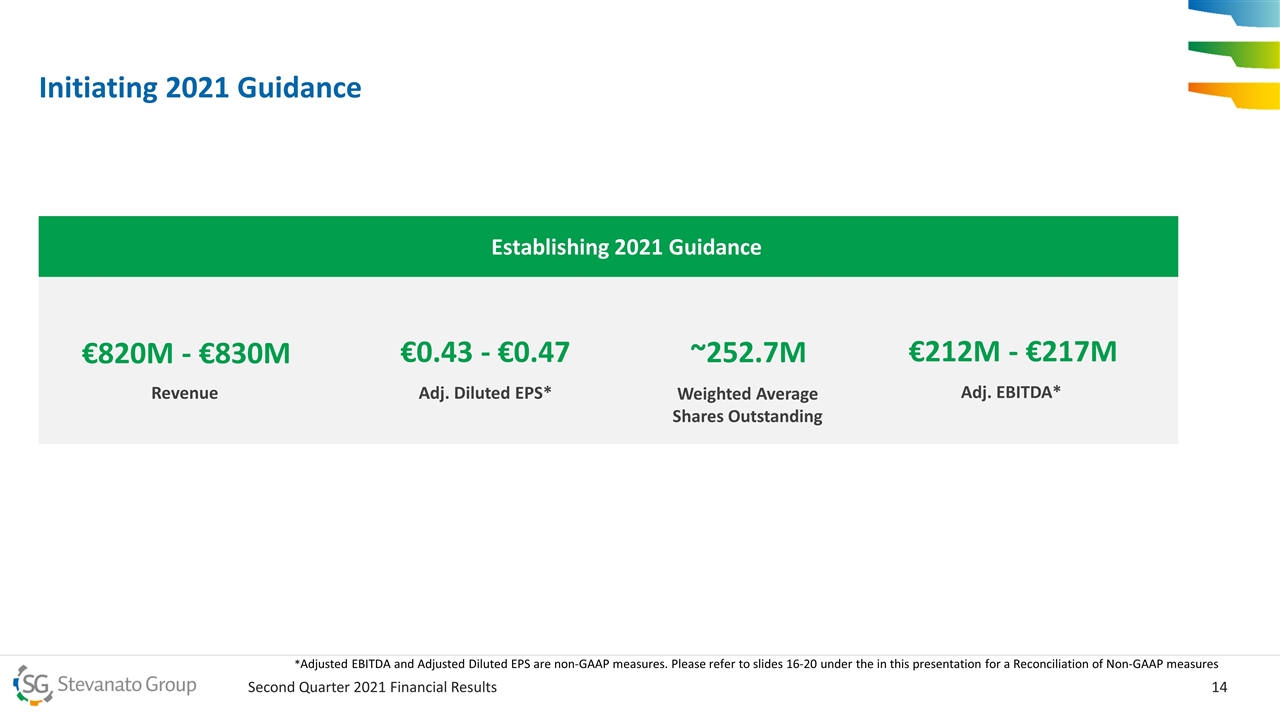
Initiating 2021 Guidance Establishing 2021 Guidance €820M - €830M Revenue €0.43 - €0.47 Adj. Diluted EPS* €212M - €217M Adj. EBITDA* ~252.7M Weighted Average Shares Outstanding *Adjusted EBITDA and Adjusted Diluted EPS are non-GAAP measures. Please refer to slides 16-20 under the in this presentation for a Reconciliation of Non-GAAP measures
Notes to Non-GAAP Financial Measures: This presentation contains non-GAAP measures. Management monitors and evaluates our operating and financial performance using several non-GAAP financial measures, including Constant Currency Revenue, EBITDA, Adjusted EBITDA, Adjusted EBITDA Margin, Adjusted Operating Profit, Adjusted Operating Profit Margin, CAPEX, Adjusted Diluted EPS, Net Debt, and Free Cash Flow. We believe that these non-GAAP financial measures provide useful and relevant information regarding our performance and improve our ability to assess our financial condition. While similar measures are widely used in the industry in which we operate, the financial measures we use may not be comparable to other similarly titled measures used by other companies, nor are they intended to be substitutes for measures of financial performance or financial position as prepared in accordance with IFRS. A reconciliation of these adjusted Non-GAAP financial measures to the comparable GAAP financial measures is included in the accompanying tables.
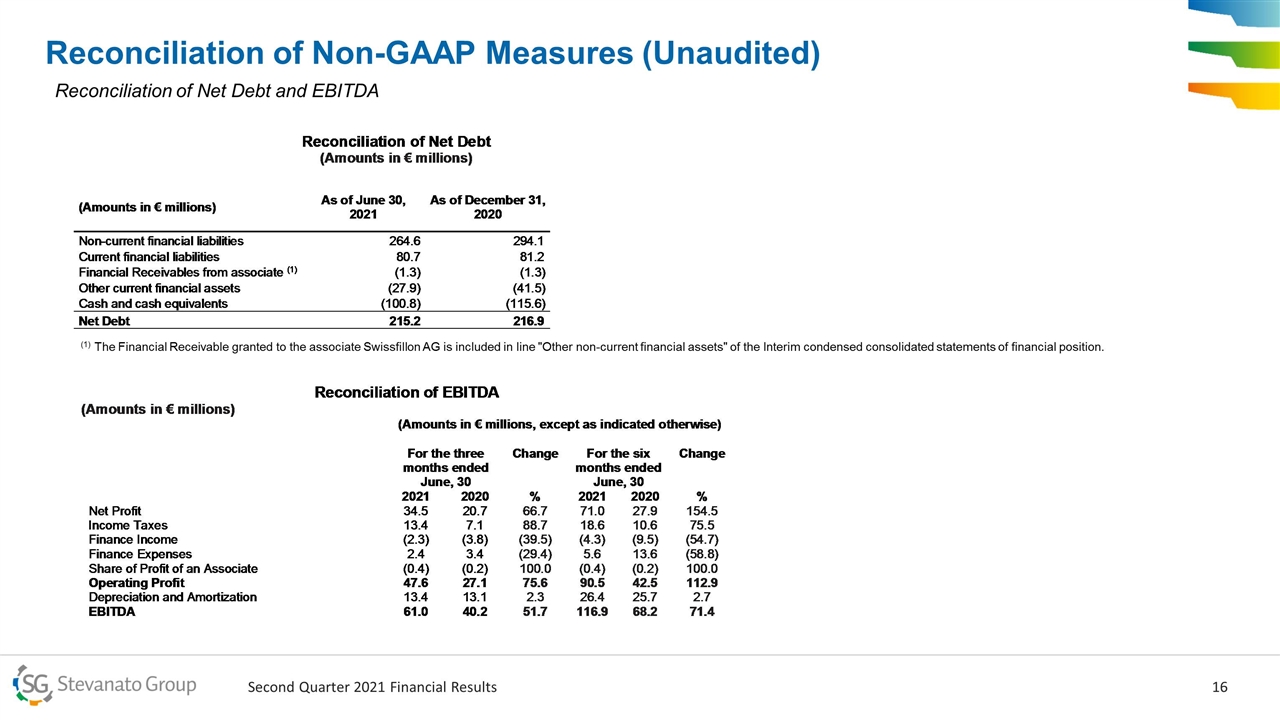
Reconciliation of Non-GAAP Measures (Unaudited) (1) The Financial Receivable granted to the associate Swissfillon AG is included in line "Other non-current financial assets" of the Interim condensed consolidated statements of financial position. Reconciliation of Net Debt and EBITDA
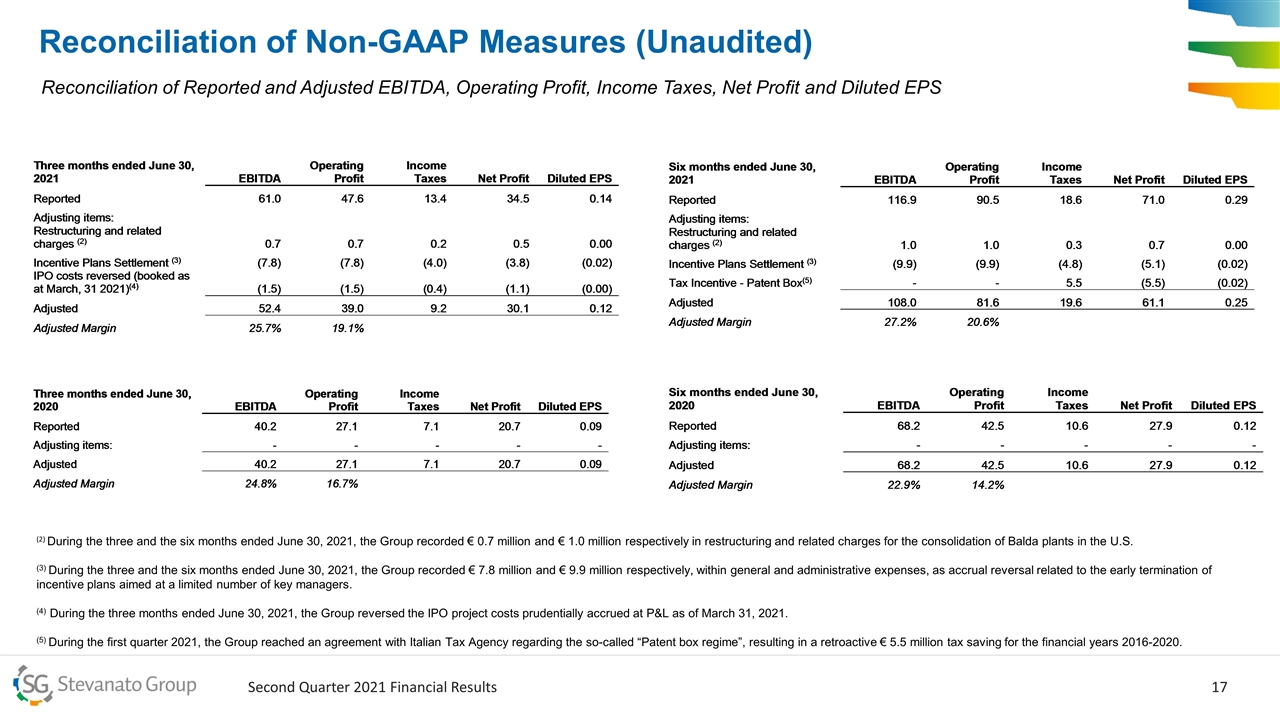
Reconciliation of Non-GAAP Measures (Unaudited) Reconciliation of Reported and Adjusted EBITDA, Operating Profit, Income Taxes, Net Profit and Diluted EPS (2) During the three and the six months ended June 30, 2021, the Group recorded € 0.7 million and € 1.0 million respectively in restructuring and related charges for the consolidation of Balda plants in the U.S. (3) During the three and the six months ended June 30, 2021, the Group recorded € 7.8 million and € 9.9 million respectively, within general and administrative expenses, as accrual reversal related to the early termination of incentive plans aimed at a limited number of key managers. (4) During the three months ended June 30, 2021, the Group reversed the IPO project costs prudentially accrued at P&L as of March 31, 2021. (5) During the first quarter 2021, the Group reached an agreement with Italian Tax Agency regarding the so-called “Patent box regime”, resulting in a retroactive € 5.5 million tax saving for the financial years 2016-2020.
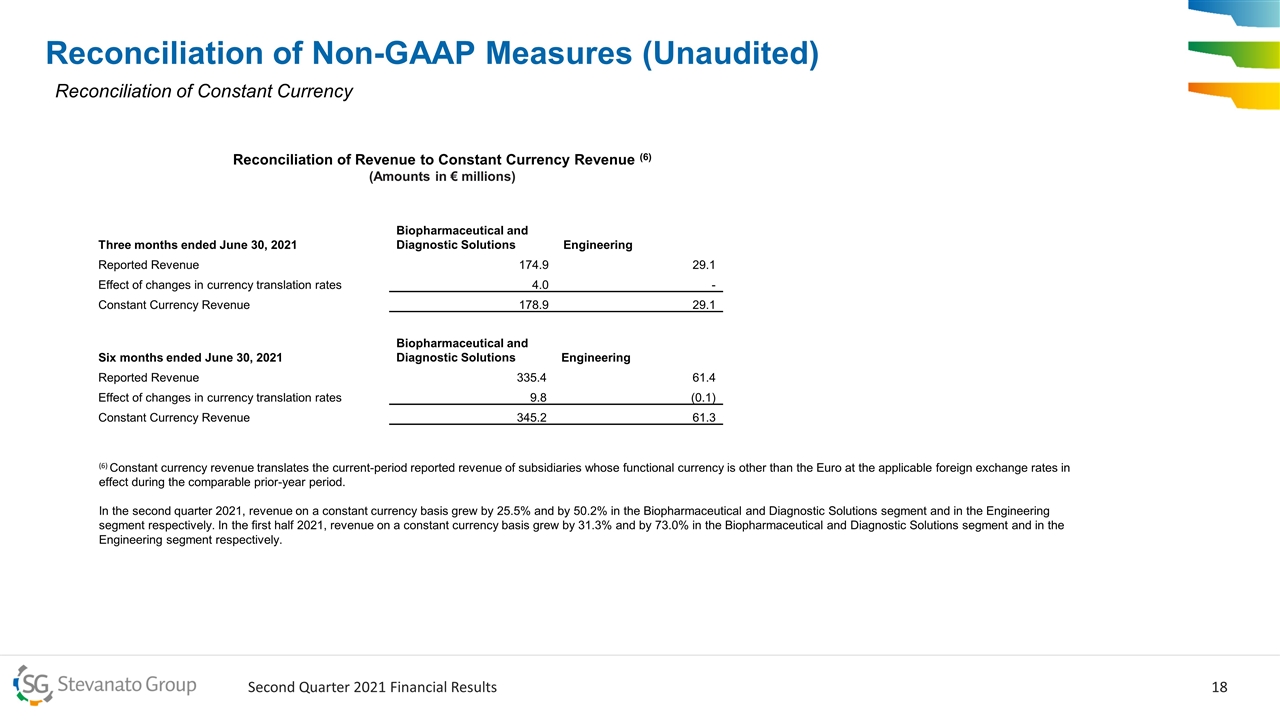
Reconciliation of Non-GAAP Measures (Unaudited) Reconciliation of Constant Currency Three months ended June 30, 2021 Biopharmaceutical and Diagnostic Solutions Engineering Reported Revenue 174.9 29.1 Effect of changes in currency translation rates 4.0 - Constant Currency Revenue 178.9 29.1 Six months ended June 30, 2021 Biopharmaceutical and Diagnostic Solutions Engineering Reported Revenue 335.4 61.4 Effect of changes in currency translation rates 9.8 (0.1) Constant Currency Revenue 345.2 61.3 Reconciliation of Revenue to Constant Currency Revenue (6) (Amounts in € millions) (6) Constant currency revenue translates the current-period reported revenue of subsidiaries whose functional currency is other than the Euro at the applicable foreign exchange rates in effect during the comparable prior-year period. In the second quarter 2021, revenue on a constant currency basis grew by 25.5% and by 50.2% in the Biopharmaceutical and Diagnostic Solutions segment and in the Engineering segment respectively. In the first half 2021, revenue on a constant currency basis grew by 31.3% and by 73.0% in the Biopharmaceutical and Diagnostic Solutions segment and in the Engineering segment respectively.
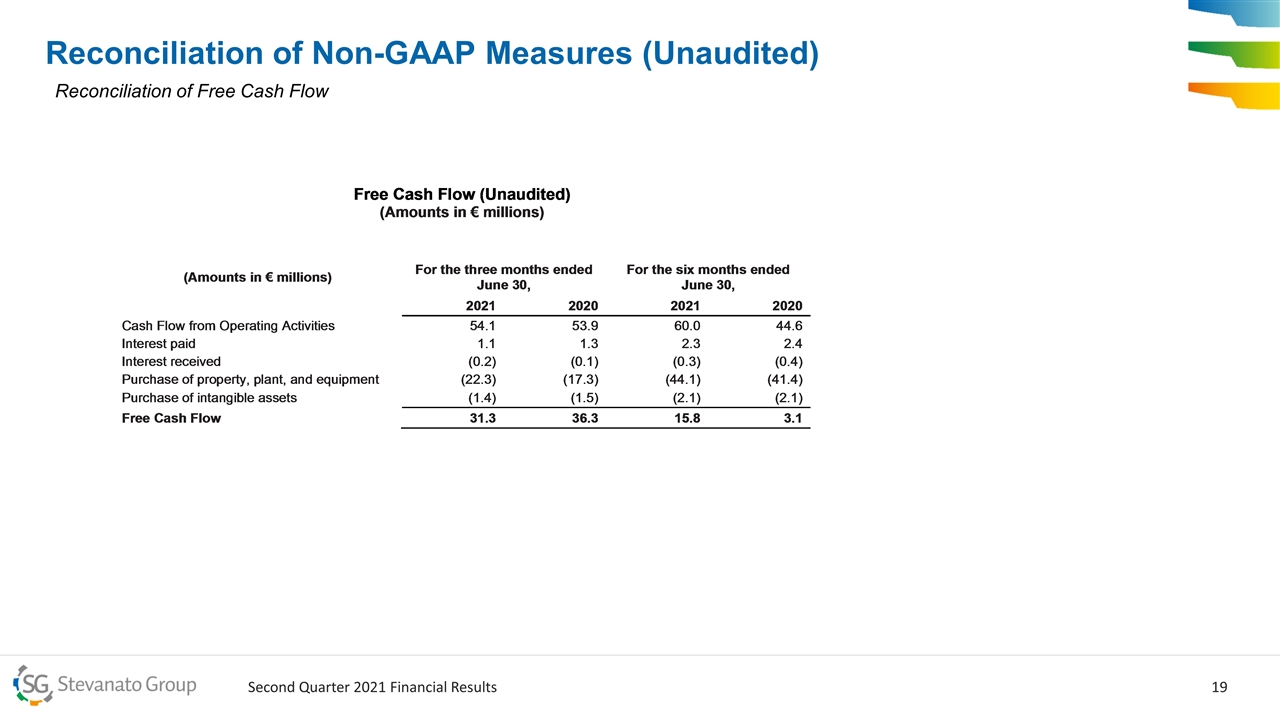
Reconciliation of Non-GAAP Measures (Unaudited) Reconciliation of Free Cash Flow
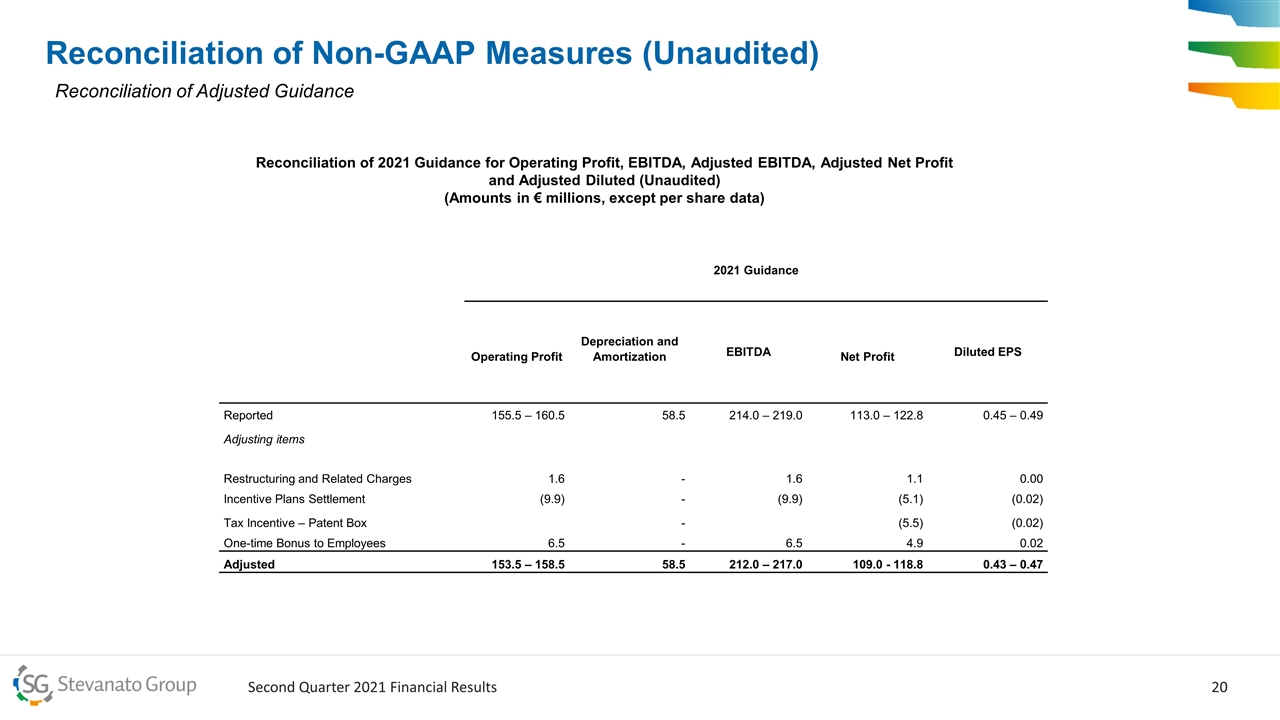
Reconciliation of Non-GAAP Measures (Unaudited) Reconciliation of Adjusted Guidance Reconciliation of 2021 Guidance for Operating Profit, EBITDA, Adjusted EBITDA, Adjusted Net Profit and Adjusted Diluted (Unaudited) (Amounts in € millions, except per share data) 2021 Guidance Operating Profit Depreciation and Amortization EBITDA Net Profit Diluted EPS Reported 155.5 – 160.5 58.5 214.0 – 219.0 113.0 – 122.8 0.45 – 0.49 Adjusting items Restructuring and Related Charges 1.6 - 1.6 1.1 0.00 Incentive Plans Settlement (9.9) - (9.9) (5.1) (0.02) Tax Incentive – Patent Box - (5.5) (0.02) One-time Bonus to Employees 6.5 - 6.5 4.9 0.02 Adjusted 153.5 – 158.5 58.5 212.0 – 217.0 109.0 - 118.8 0.43 – 0.47

Contacts: Media Stevanato Group media@stevanatogroup.com Investor Relations Lisa Miles Lisa.miles@stevanatogroup.com