

Stevanato Group Third Quarter 2022 Financial Results November 8th, 2022 Exhibit 99.1
Forward-Looking Statements This presentation may include forward-looking statements. The words "expect,” “growth”, “rise,” “drive,” “create,” “are managing,” “well positioned,” “continues,” “remain,” “estimate,” and similar expressions (or their negative) identify certain of these forward-looking statements. These forward-looking statements are statements regarding the Company's intentions, beliefs or current expectations concerning, among other things, the investments the Company expects to receive, the expansion of manufacturing capacity, the Company’s plans regarding its presence in the U.S., business strategies, the Company’s capacity to meet future market demands and support preparedness for future public health emergencies, and results of operations. The forward-looking statements in this presentation are based on numerous assumptions regarding the Company’s present and future business strategies and the environment in which the Company will operate in the future. Forward-looking statements involve inherent known and unknown risks, uncertainties and contingencies because they relate to events and depend on circumstances that may or may not occur in the future and may cause the actual results, performance or achievements of the Company to be materially different from those expressed or implied by such forward looking statements. Many of these risks and uncertainties relate to factors that are beyond the Company's ability to control or estimate precisely, such as future market conditions, currency fluctuations, the behavior of other market participants, the actions of regulators and other factors such as the Company's ability to continue to obtain financing to meet its liquidity needs, changes in the political, social and regulatory framework in which the Company operates or in economic or technological trends or conditions. For a description of the risks that could cause the Company’s future results to differ from those expressed in any such forward looking statements, refer to the risk factors discussed in our annual report on Form 20-F/A for the year ended December 31, 2021, filed with the U.S. Securities and Exchange Commission on April 5, 2022. Readers should therefore not place undue reliance on these statements, particularly not in connection with any contract or investment decision. Except as required by law, the company assumes no obligation to update any such forward-looking statements. Non-GAAP Financial Information This presentation contains non-GAAP financial measures. Please refer to the tables included in this presentation for a reconciliation of non-GAAP financial measures. Management monitors and evaluates our operating and financial performance using several non-GAAP financial measures, including Constant Currency Revenue, EBITDA, Adjusted EBITDA, Adjusted EBITDA Margin, Adjusted Operating Profit, Adjusted Operating Profit Margin, Adjusted Net Profit, Adjusted Diluted EPS, Capital Employed, Net Cash, Free Cash Flow and CAPEX. We believe that these non-GAAP financial measures provide useful and relevant information regarding our performance and improve our ability to assess our financial condition. While similar measures are widely used in the industry in which we operate, the financial measures we use may not be comparable to other similarly titled measures used by other companies, nor are they intended to be substitutes for measures of financial performance or financial position as prepared in accordance with IFRS. Safe Harbor Statement Q3 2022 FInancial Results
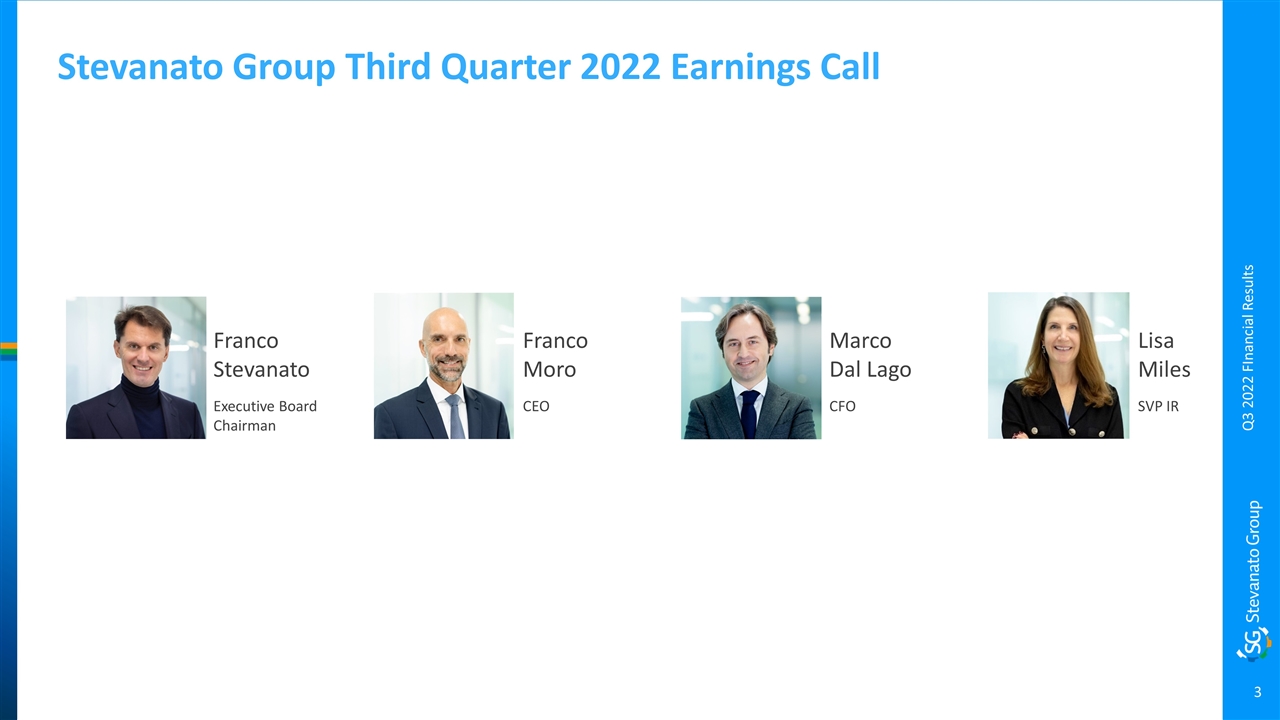
overall_1_132557094257415339 columns_1_132557094257415339 71_1_132561414205897258 77_1_132564036149051284 Stevanato Group Third Quarter 2022 Earnings Call Franco Stevanato Executive Board Chairman Franco Moro CEO Marco Dal Lago CFO Lisa Miles SVP IR Q3 2022 FInancial Results
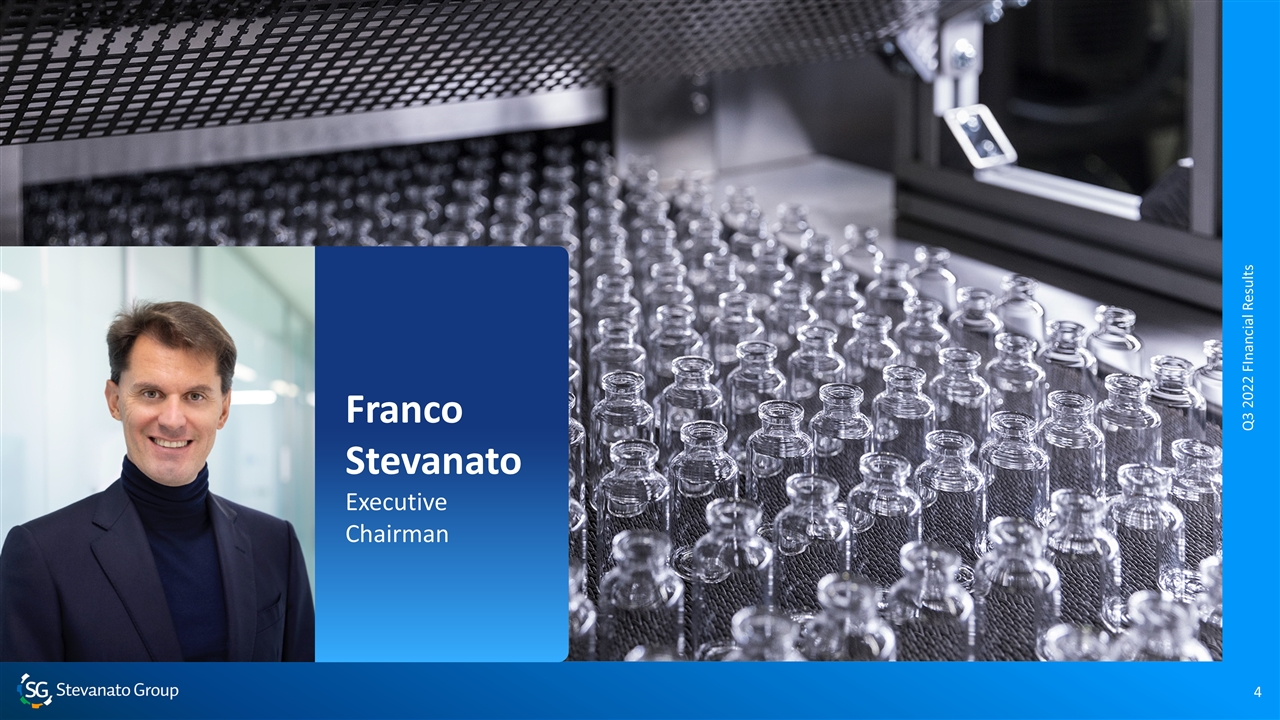
Franco Stevanato Executive Chairman Q3 2022 FInancial Results
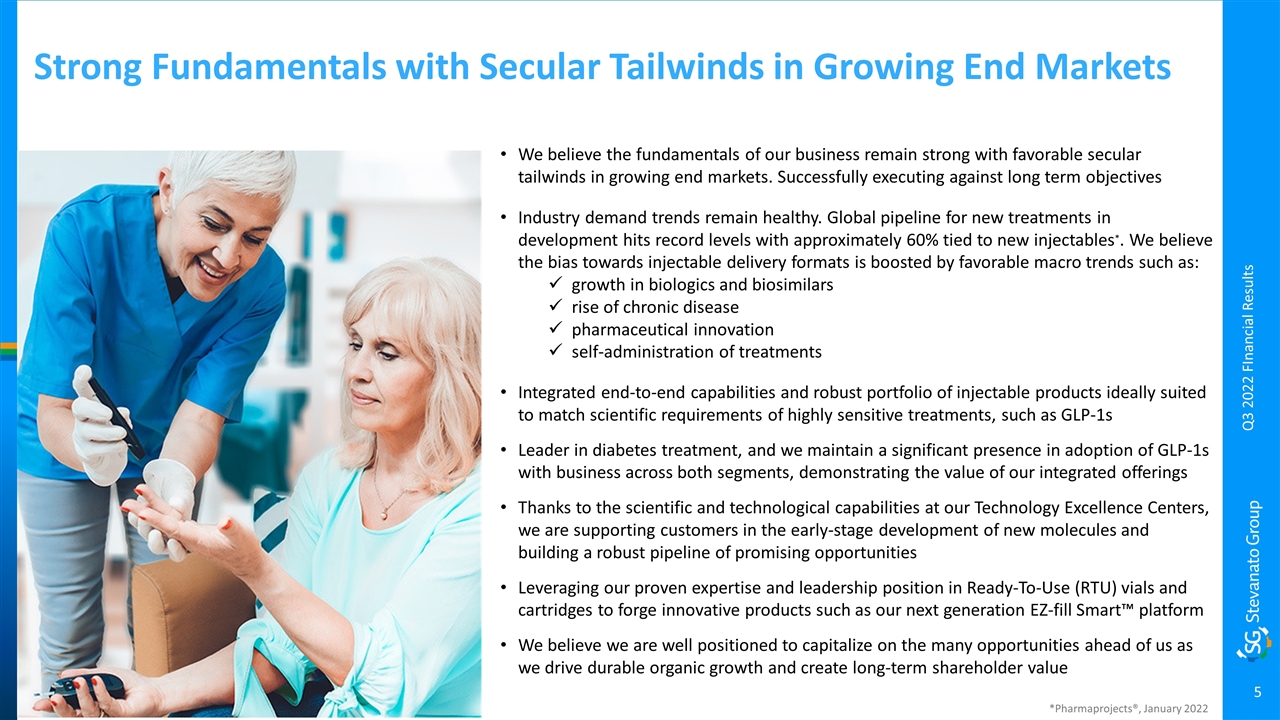
overall_1_132557094257415339 columns_1_132557094257415339 71_1_132561414205897258 77_1_132564036149051284 Strong Fundamentals with Secular Tailwinds in Growing End Markets We believe the fundamentals of our business remain strong with favorable secular tailwinds in growing end markets. Successfully executing against long term objectives Industry demand trends remain healthy. Global pipeline for new treatments in development hits record levels with approximately 60% tied to new injectables*. We believe the bias towards injectable delivery formats is boosted by favorable macro trends such as: growth in biologics and biosimilars rise of chronic disease pharmaceutical innovation self-administration of treatments Integrated end-to-end capabilities and robust portfolio of injectable products ideally suited to match scientific requirements of highly sensitive treatments, such as GLP-1s Leader in diabetes treatment, and we maintain a significant presence in adoption of GLP-1s with business across both segments, demonstrating the value of our integrated offerings Thanks to the scientific and technological capabilities at our Technology Excellence Centers, we are supporting customers in the early-stage development of new molecules and building a robust pipeline of promising opportunities Leveraging our proven expertise and leadership position in Ready-To-Use (RTU) vials and cartridges to forge innovative products such as our next generation EZ-fill Smart™ platform We believe we are well positioned to capitalize on the many opportunities ahead of us as we drive durable organic growth and create long-term shareholder value Q3 2022 FInancial Results *Pharmaprojects®, January 2022
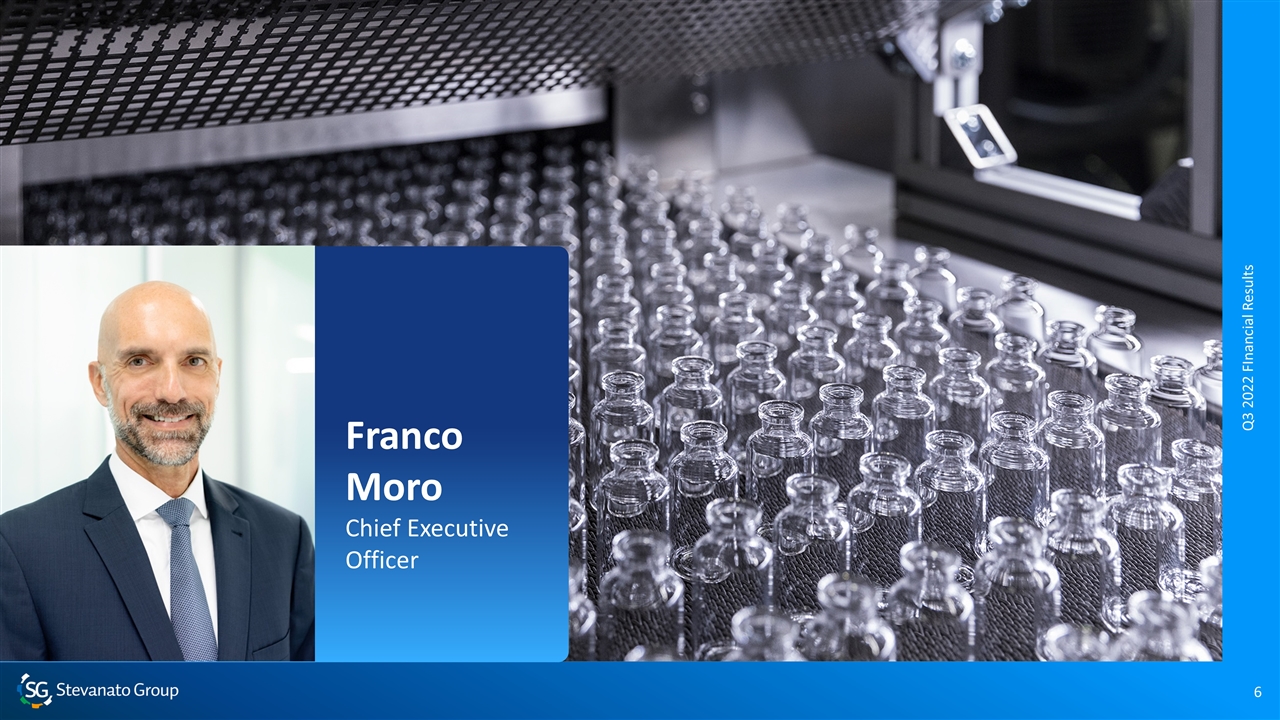
Franco Moro Chief Executive Officer Q3 2022 FInancial Results
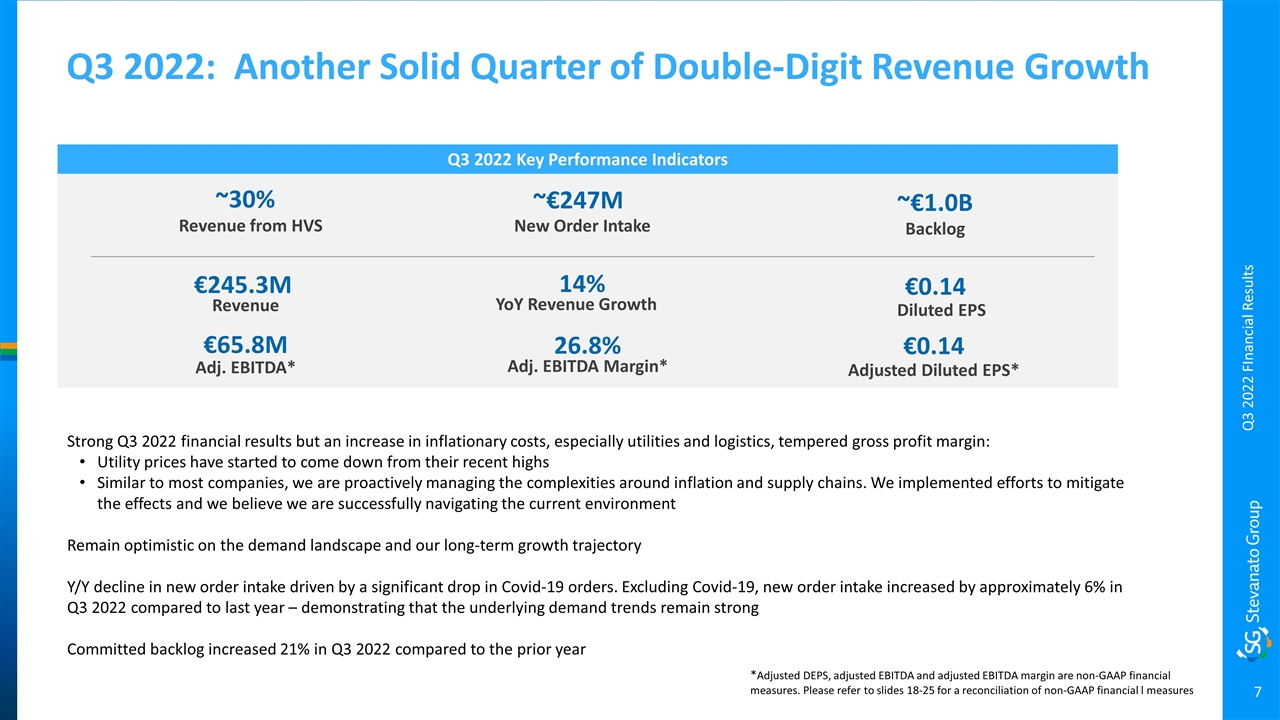
Q3 2022: Another Solid Quarter of Double-Digit Revenue Growth Q3 2022 Key Performance Indicators €245.3M Revenue 14% YoY Revenue Growth €65.8M Adj. EBITDA* 26.8% Adj. EBITDA Margin* €0.14 Diluted EPS ~€247M New Order Intake ~€1.0B Backlog ~30% Revenue from HVS €0.14 Adjusted Diluted EPS* *Adjusted DEPS, adjusted EBITDA and adjusted EBITDA margin are non-GAAP financial measures. Please refer to slides 18-25 for a reconciliation of non-GAAP financial l measures Strong Q3 2022 financial results but an increase in inflationary costs, especially utilities and logistics, tempered gross profit margin: Utility prices have started to come down from their recent highs Similar to most companies, we are proactively managing the complexities around inflation and supply chains. We implemented efforts to mitigate the effects and we believe we are successfully navigating the current environment Remain optimistic on the demand landscape and our long-term growth trajectory Y/Y decline in new order intake driven by a significant drop in Covid-19 orders. Excluding Covid-19, new order intake increased by approximately 6% in Q3 2022 compared to last year – demonstrating that the underlying demand trends remain strong Committed backlog increased 21% in Q3 2022 compared to the prior year Q3 2022 FInancial Results
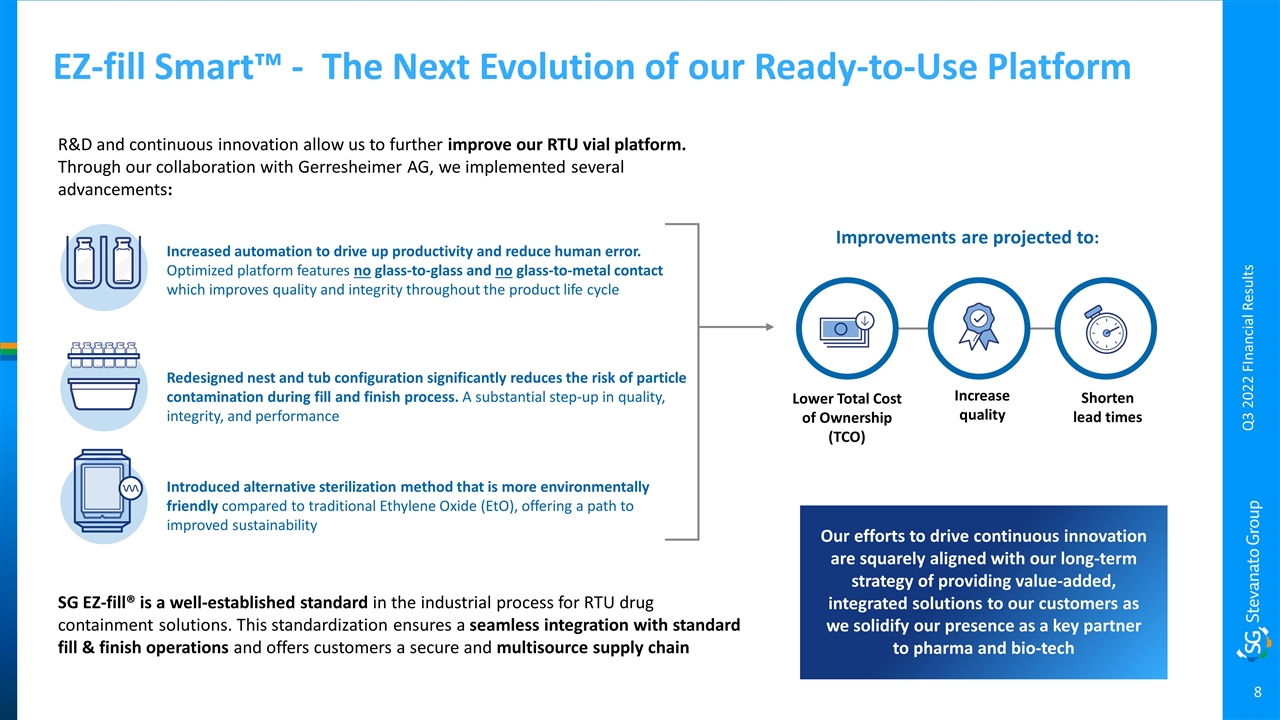
EZ-fill Smart™ - The Next Evolution of our Ready-to-Use Platform SG EZ-fill® is a well-established standard in the industrial process for RTU drug containment solutions. This standardization ensures a seamless integration with standard fill & finish operations and offers customers a secure and multisource supply chain Improvements are projected to: Our efforts to drive continuous innovation are squarely aligned with our long-term strategy of providing value-added, integrated solutions to our customers as we solidify our presence as a key partner to pharma and bio-tech Introduced alternative sterilization method that is more environmentally friendly compared to traditional Ethylene Oxide (EtO), offering a path to improved sustainability R&D and continuous innovation allow us to further improve our RTU vial platform. Through our collaboration with Gerresheimer AG, we implemented several advancements: Increased automation to drive up productivity and reduce human error. Optimized platform features no glass-to-glass and no glass-to-metal contact which improves quality and integrity throughout the product life cycle Redesigned nest and tub configuration significantly reduces the risk of particle contamination during fill and finish process. A substantial step-up in quality, integrity, and performance Lower Total Cost of Ownership (TCO) Increase quality Shorten lead times Q3 2022 FInancial Results
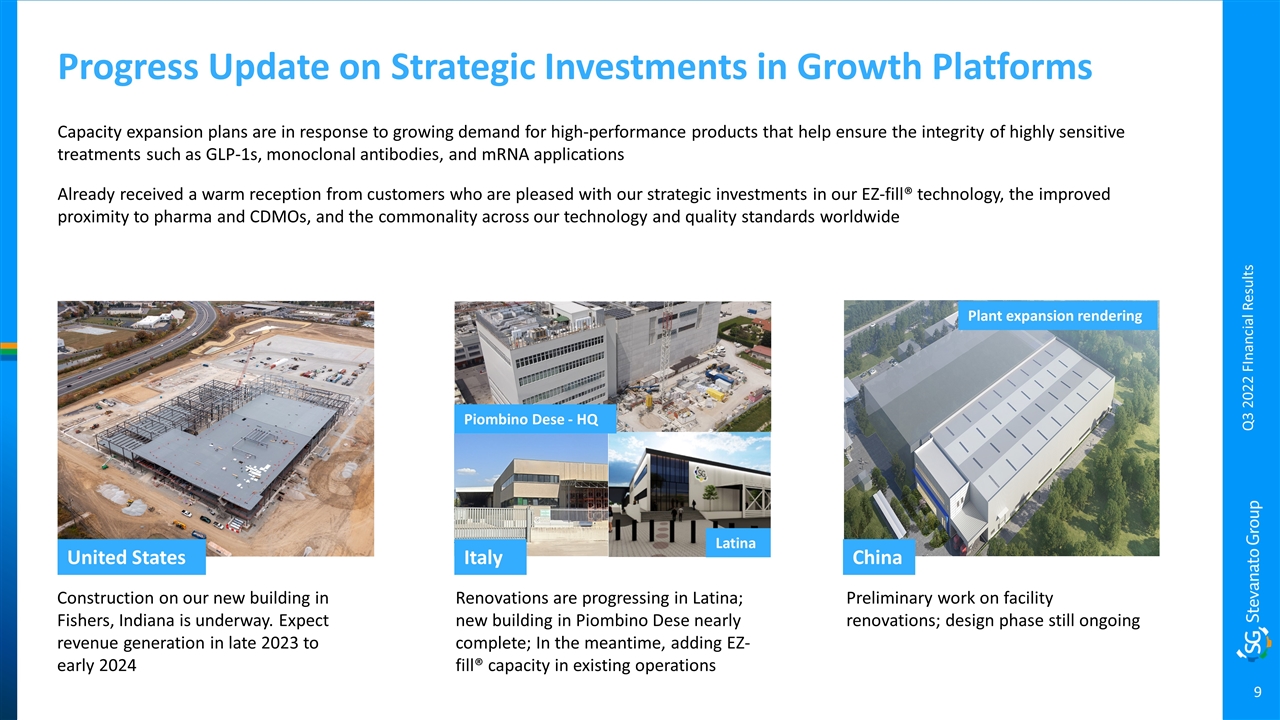
Capacity expansion plans are in response to growing demand for high-performance products that help ensure the integrity of highly sensitive treatments such as GLP-1s, monoclonal antibodies, and mRNA applications Already received a warm reception from customers who are pleased with our strategic investments in our EZ-fill® technology, the improved proximity to pharma and CDMOs, and the commonality across our technology and quality standards worldwide Progress Update on Strategic Investments in Growth Platforms Renovations are progressing in Latina; new building in Piombino Dese nearly complete; In the meantime, adding EZ-fill® capacity in existing operations Construction on our new building in Fishers, Indiana is underway. Expect revenue generation in late 2023 to early 2024 Preliminary work on facility renovations; design phase still ongoing United States China Q3 2022 FInancial Results Italy Piombino Dese - HQ Latina Plant expansion rendering
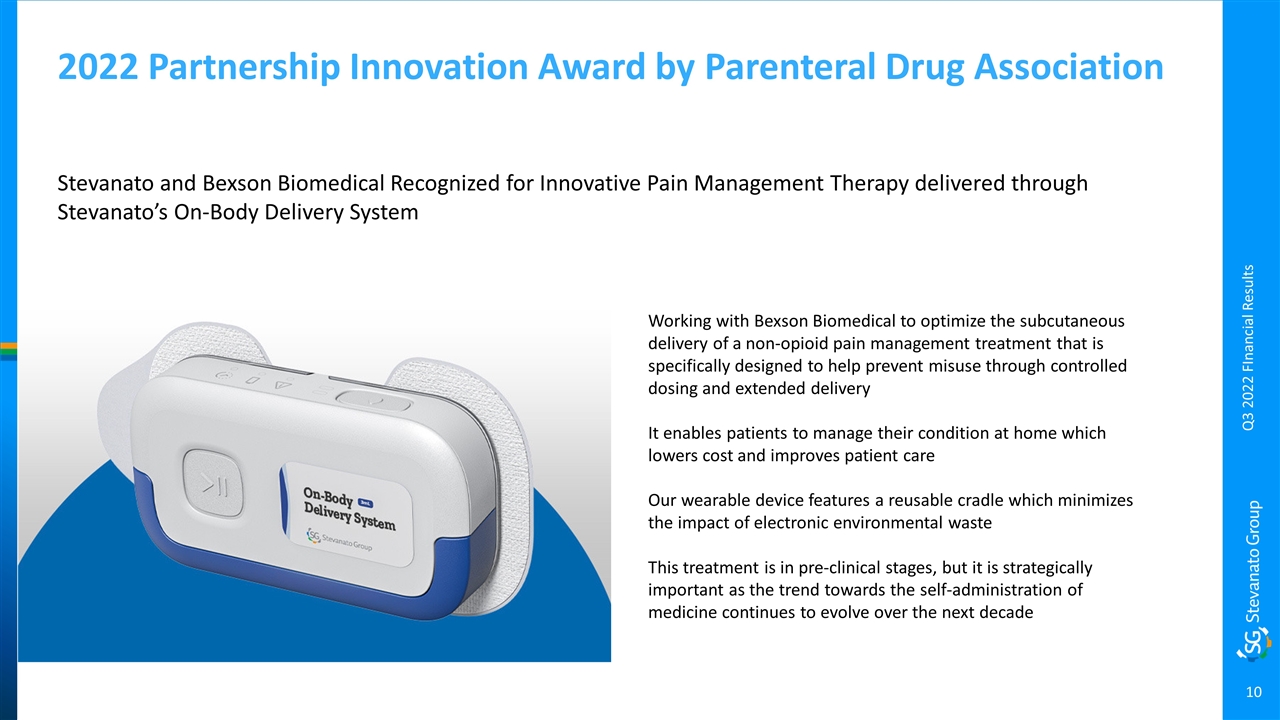
Working with Bexson Biomedical to optimize the subcutaneous delivery of a non-opioid pain management treatment that is specifically designed to help prevent misuse through controlled dosing and extended delivery It enables patients to manage their condition at home which lowers cost and improves patient care Our wearable device features a reusable cradle which minimizes the impact of electronic environmental waste This treatment is in pre-clinical stages, but it is strategically important as the trend towards the self-administration of medicine continues to evolve over the next decade Stevanato and Bexson Biomedical Recognized for Innovative Pain Management Therapy delivered through Stevanato’s On-Body Delivery System 2022 Partnership Innovation Award by Parenteral Drug Association Q3 2022 FInancial Results
Marco Dal Lago Chief Financial Officer Q3 2022 FInancial Results
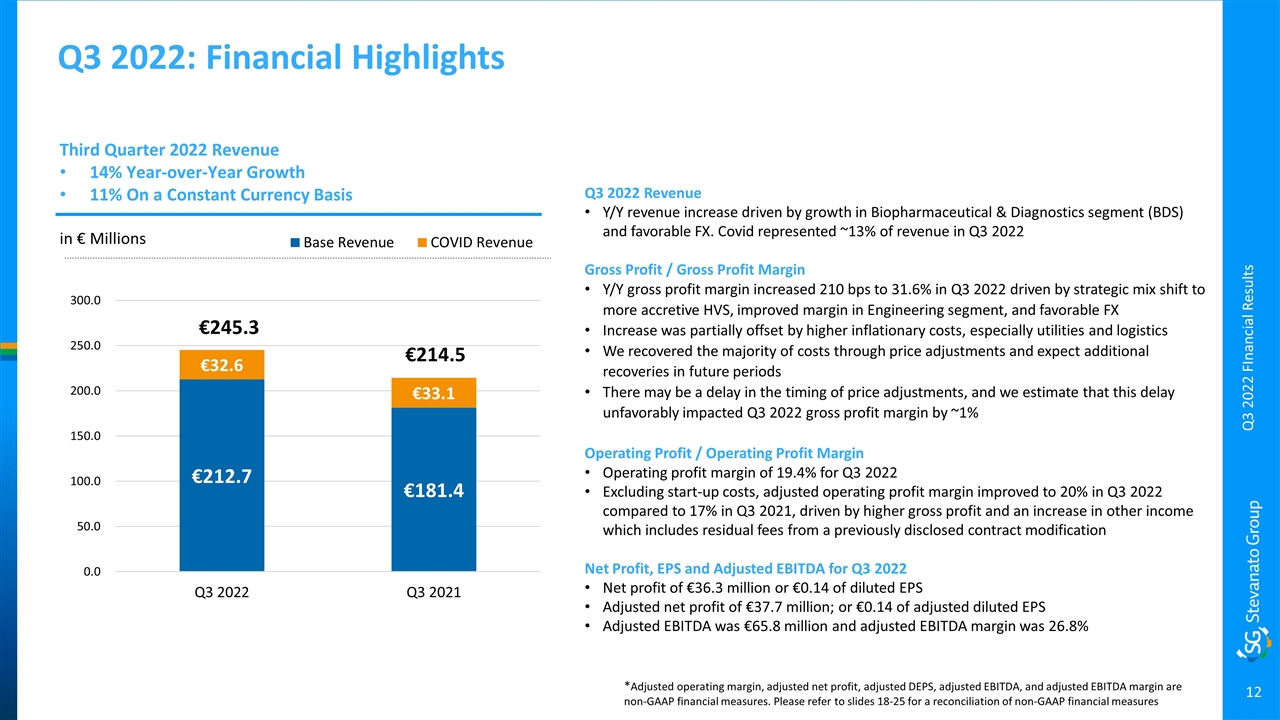
Q3 2022: Financial Highlights €245.3 Third Quarter 2022 Revenue 14% Year-over-Year Growth 11% On a Constant Currency Basis in € Millions Q3 2022 Revenue Y/Y revenue increase driven by growth in Biopharmaceutical & Diagnostics segment (BDS) and favorable FX. Covid represented ~13% of revenue in Q3 2022 Gross Profit / Gross Profit Margin Y/Y gross profit margin increased 210 bps to 31.6% in Q3 2022 driven by strategic mix shift to more accretive HVS, improved margin in Engineering segment, and favorable FX Increase was partially offset by higher inflationary costs, especially utilities and logistics We recovered the majority of costs through price adjustments and expect additional recoveries in future periods There may be a delay in the timing of price adjustments, and we estimate that this delay unfavorably impacted Q3 2022 gross profit margin by ~1% Operating Profit / Operating Profit Margin Operating profit margin of 19.4% for Q3 2022 Excluding start-up costs, adjusted operating profit margin improved to 20% in Q3 2022 compared to 17% in Q3 2021, driven by higher gross profit and an increase in other income which includes residual fees from a previously disclosed contract modification Net Profit, EPS and Adjusted EBITDA for Q3 2022 Net profit of €36.3 million or €0.14 of diluted EPS Adjusted net profit of €37.7 million; or €0.14 of adjusted diluted EPS Adjusted EBITDA was €65.8 million and adjusted EBITDA margin was 26.8% *Adjusted operating margin, adjusted net profit, adjusted DEPS, adjusted EBITDA, and adjusted EBITDA margin are non-GAAP financial measures. Please refer to slides 18-25 for a reconciliation of non-GAAP financial measures Q3 2022 FInancial Results €214.5
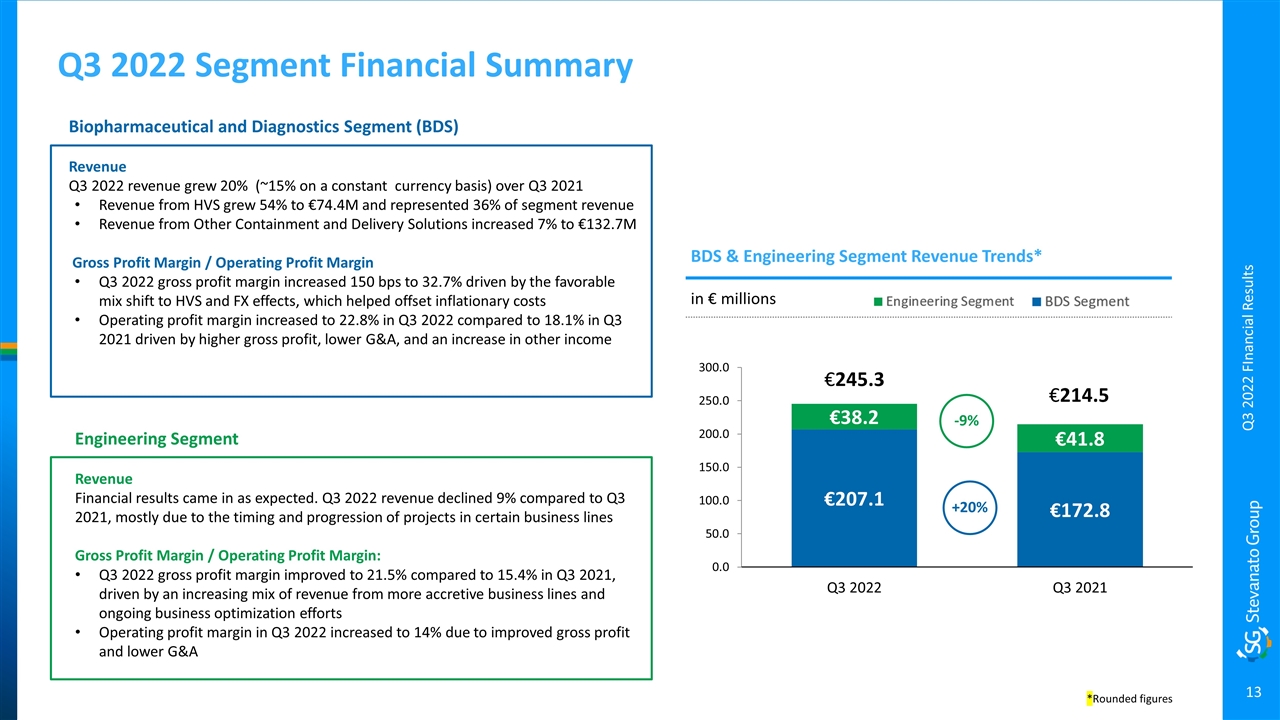
Q3 2022 Segment Financial Summary Engineering Segment Revenue Financial results came in as expected. Q3 2022 revenue declined 9% compared to Q3 2021, mostly due to the timing and progression of projects in certain business lines Gross Profit Margin / Operating Profit Margin: Q3 2022 gross profit margin improved to 21.5% compared to 15.4% in Q3 2021, driven by an increasing mix of revenue from more accretive business lines and ongoing business optimization efforts Operating profit margin in Q3 2022 increased to 14% due to improved gross profit and lower G&A BDS & Engineering Segment Revenue Trends* in € millions +20% -9% €245.3 Biopharmaceutical and Diagnostics Segment (BDS) Revenue Q3 2022 revenue grew 20% (~15% on a constant currency basis) over Q3 2021 Revenue from HVS grew 54% to €74.4M and represented 36% of segment revenue Revenue from Other Containment and Delivery Solutions increased 7% to €132.7M Gross Profit Margin / Operating Profit Margin Q3 2022 gross profit margin increased 150 bps to 32.7% driven by the favorable mix shift to HVS and FX effects, which helped offset inflationary costs Operating profit margin increased to 22.8% in Q3 2022 compared to 18.1% in Q3 2021 driven by higher gross profit, lower G&A, and an increase in other income Q3 2022 FInancial Results *Rounded figures
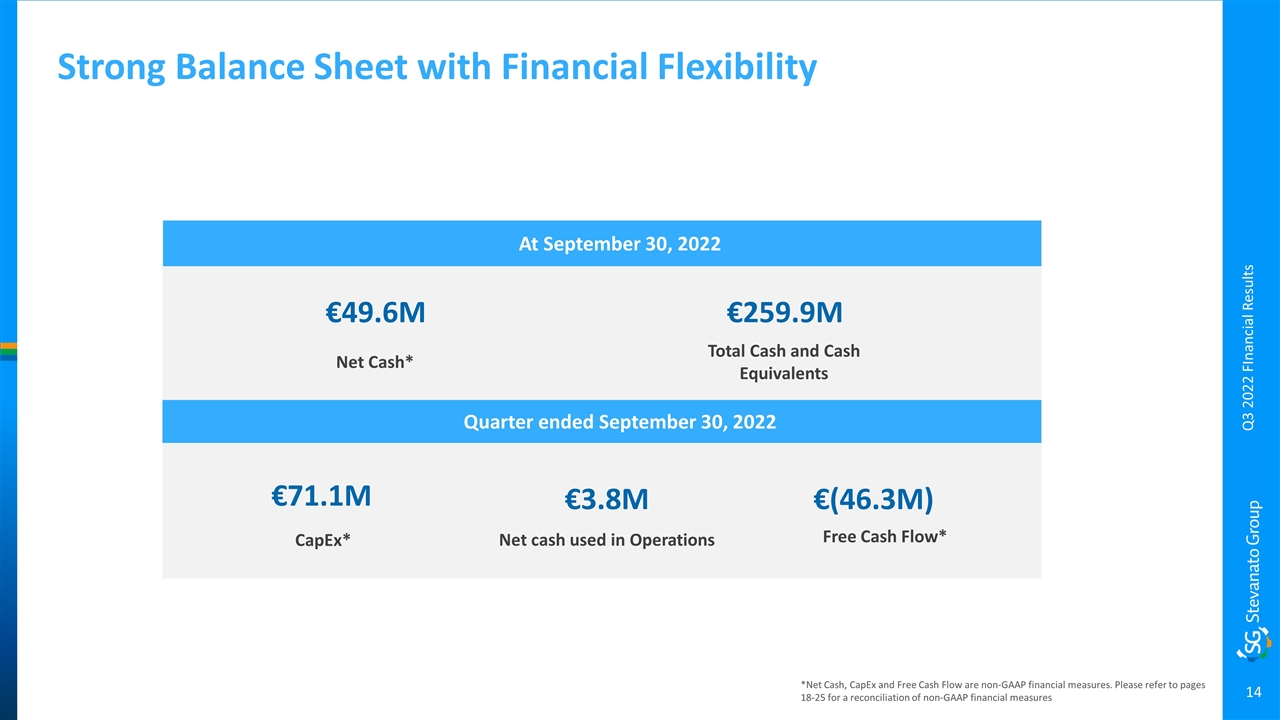
Strong Balance Sheet with Financial Flexibility *Net Cash, CapEx and Free Cash Flow are non-GAAP financial measures. Please refer to pages 18-25 for a reconciliation of non-GAAP financial measures At September 30, 2022 €49.6M Net Cash* €71.1M CapEx* €3.8M Net cash used in Operations €(46.3M) Free Cash Flow* €259.9M Total Cash and Cash Equivalents Quarter ended September 30, 2022 Q3 2022 FInancial Results
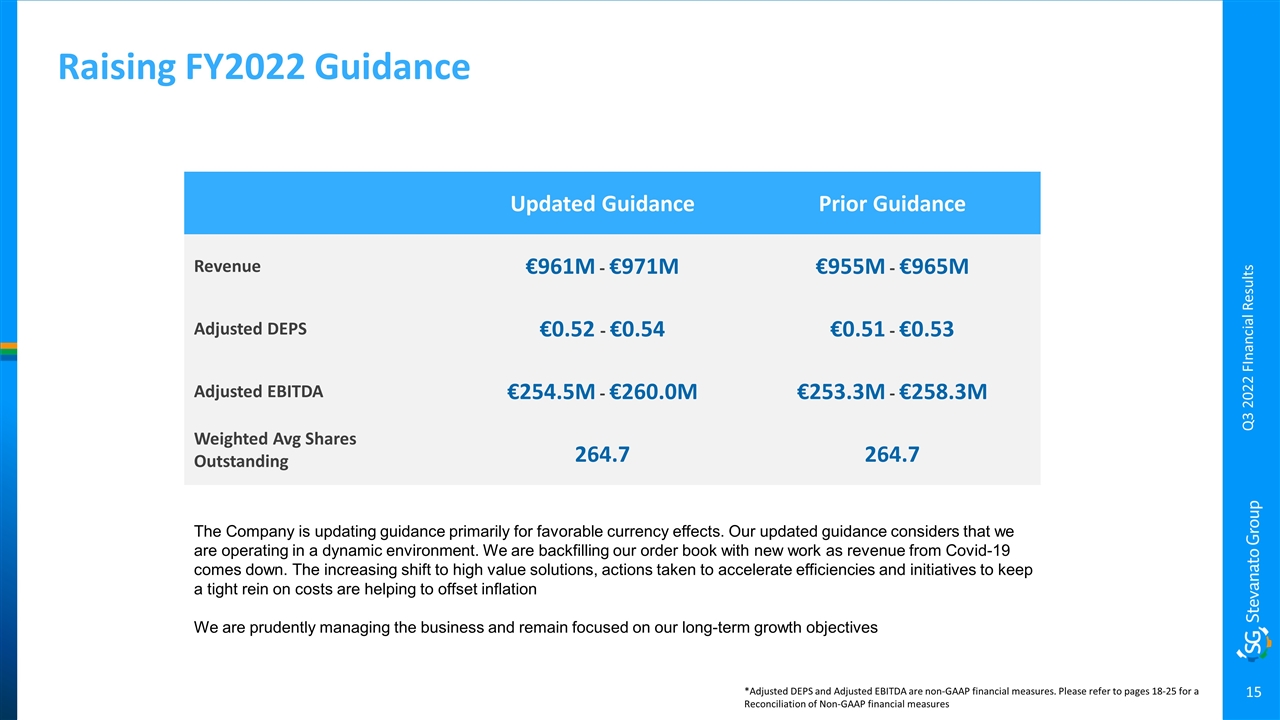
Raising FY2022 Guidance *Adjusted DEPS and Adjusted EBITDA are non-GAAP financial measures. Please refer to pages 18-25 for a Reconciliation of Non-GAAP financial measures Updated Guidance Prior Guidance Revenue €961M - €971M €955M - €965M Adjusted DEPS €0.52 - €0.54 €0.51 - €0.53 Adjusted EBITDA €254.5M - €260.0M €253.3M - €258.3M Weighted Avg Shares Outstanding 264.7 264.7 Q3 2022 FInancial Results The Company is updating guidance primarily for favorable currency effects. Our updated guidance considers that we are operating in a dynamic environment. We are backfilling our order book with new work as revenue from Covid-19 comes down. The increasing shift to high value solutions, actions taken to accelerate efficiencies and initiatives to keep a tight rein on costs are helping to offset inflation We are prudently managing the business and remain focused on our long-term growth objectives
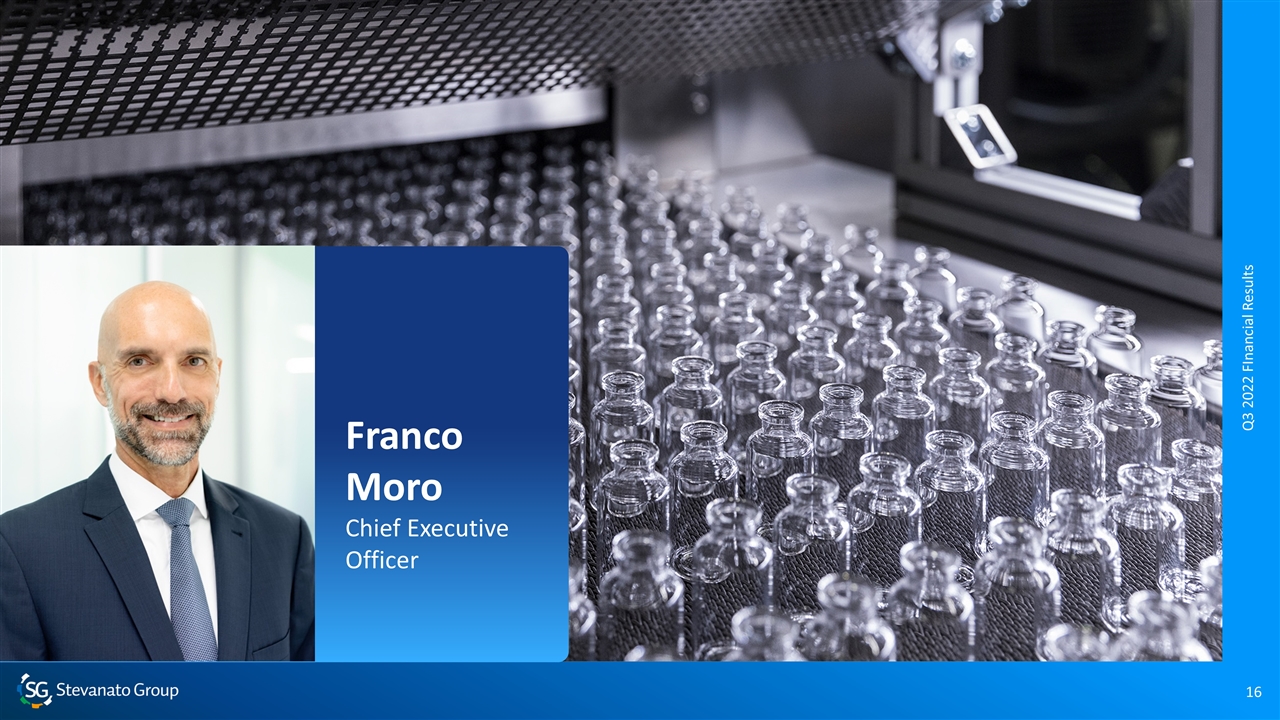
Franco Moro Chief Executive Officer Q3 2022 FInancial Results
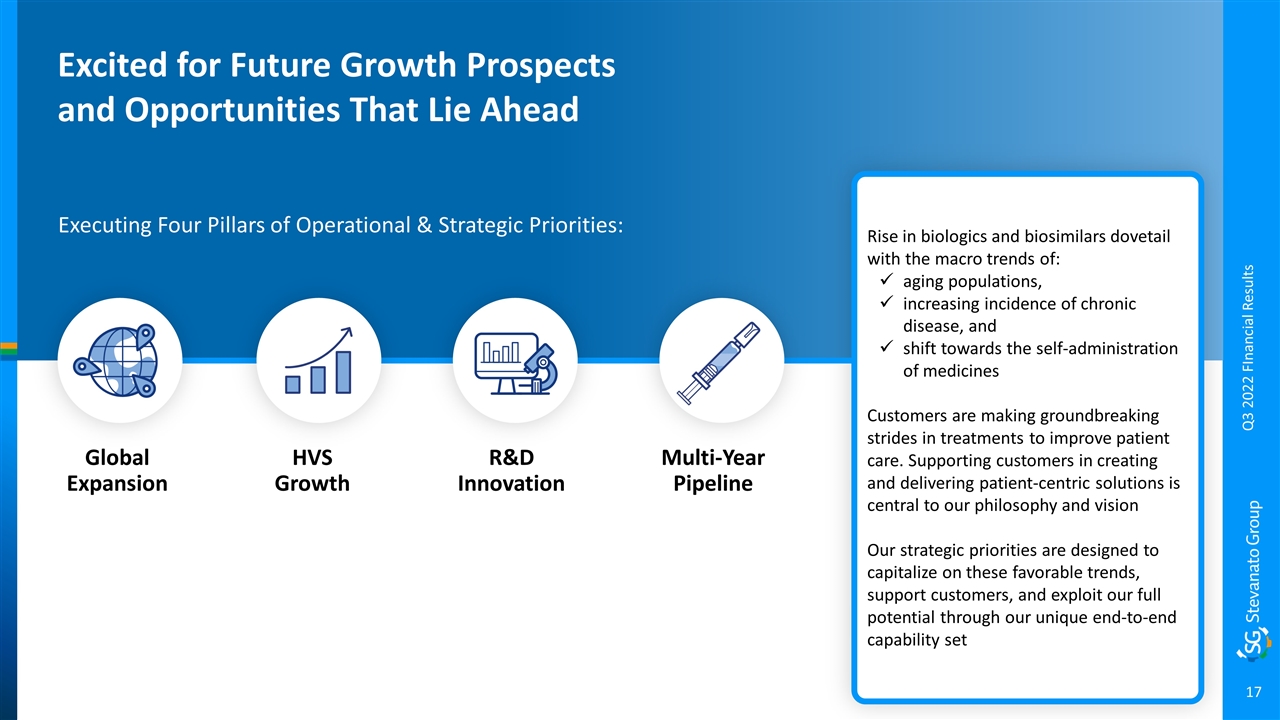
Excited for Future Growth Prospects and Opportunities That Lie Ahead HVS Growth R&D Innovation Multi-Year Pipeline Global Expansion Rise in biologics and biosimilars dovetail with the macro trends of: aging populations, increasing incidence of chronic disease, and shift towards the self-administration of medicines Customers are making groundbreaking strides in treatments to improve patient care. Supporting customers in creating and delivering patient-centric solutions is central to our philosophy and vision Our strategic priorities are designed to capitalize on these favorable trends, support customers, and exploit our full potential through our unique end-to-end capability set Executing Four Pillars of Operational & Strategic Priorities: Q3 2022 FInancial Results
Reconciliation of Non-GAAP Financial Measures (Unaudited) Notes to Non-GAAP Financial Measures: This presentation contains non-GAAP financial measures. Please refer to the tables included in this presentation for a reconciliation of non-GAAP measures. Management monitors and evaluates our operating and financial performance using several non-GAAP financial measures, including Constant Currency Revenue, EBITDA, Adjusted EBITDA, Adjusted EBITDA Margin, Adjusted Operating Profit, Adjusted Operating Profit Margin, Adjusted Net Profit, Adjusted Diluted EPS, Capital Employed, Net Cash, Free Cash Flow, and CapEx. We believe that these non-GAAP financial measures provide useful and relevant information regarding our performance and improve our ability to assess our financial condition. While similar measures are widely used in the industry in which we operate, the financial measures we use may not be comparable to other similarly titled measures used by other companies, nor are they intended to be substitutes for measures of financial performance or financial position as prepared in accordance with IFRS. Q3 2022 FInancial Results
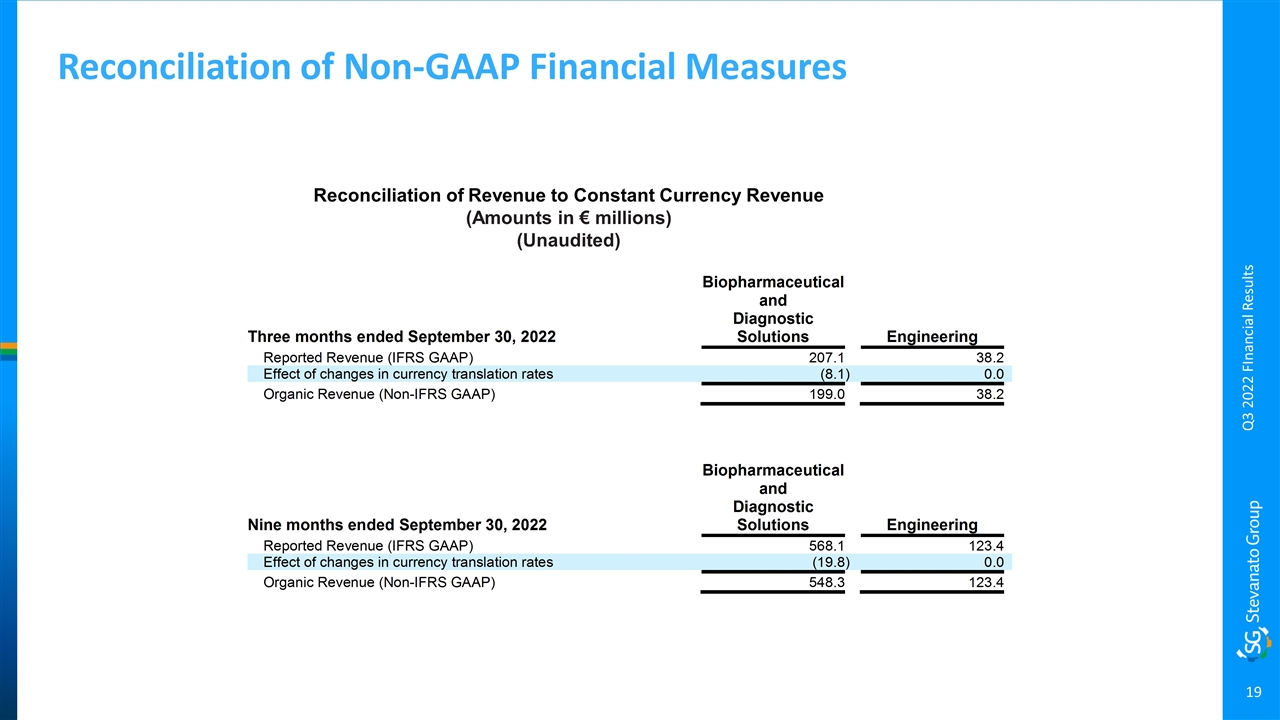
Reconciliation of Non-GAAP Financial Measures Reconciliation of Revenue to Constant Currency Revenue (Amounts in € millions) (Unaudited) Q3 2022 FInancial Results
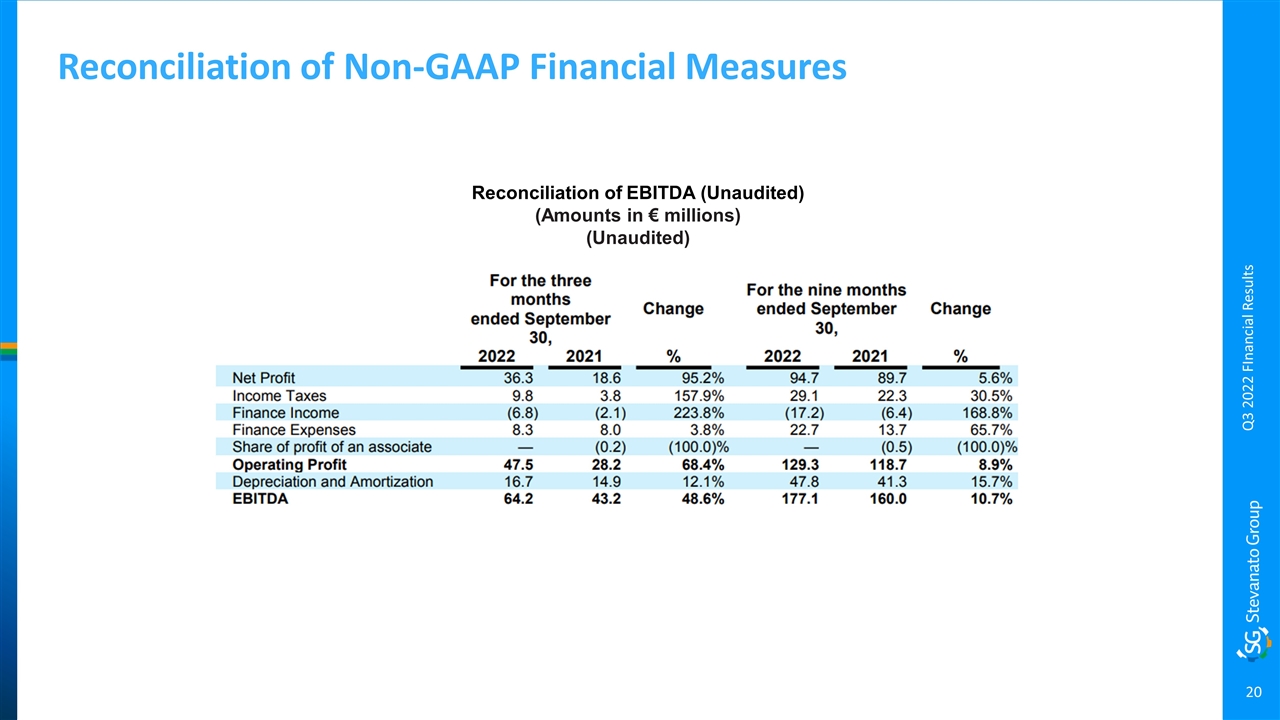
Reconciliation of Non-GAAP Financial Measures Reconciliation of EBITDA (Unaudited) (Amounts in € millions) (Unaudited) Q3 2022 FInancial Results
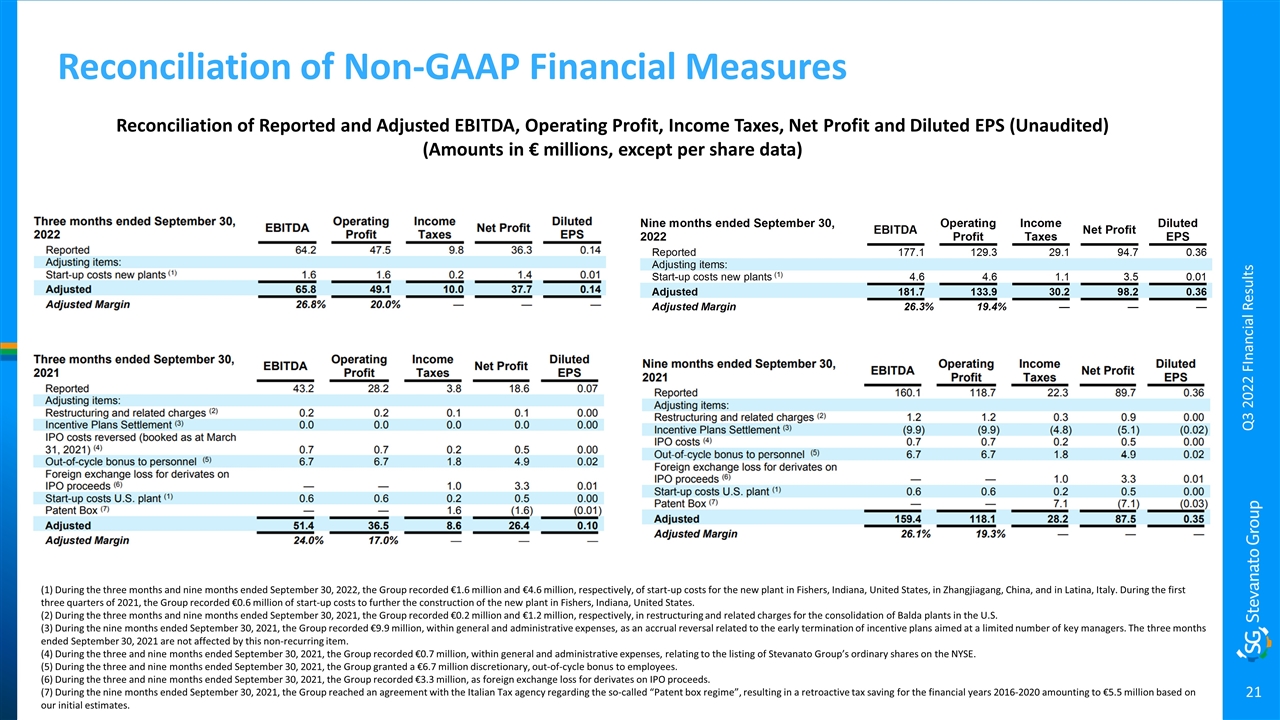
Reconciliation of Reported and Adjusted EBITDA, Operating Profit, Income Taxes, Net Profit and Diluted EPS (Unaudited) (Amounts in € millions, except per share data) Reconciliation of Non-GAAP Financial Measures (1) During the three months and nine months ended September 30, 2022, the Group recorded €1.6 million and €4.6 million, respectively, of start-up costs for the new plant in Fishers, Indiana, United States, in Zhangjiagang, China, and in Latina, Italy. During the first three quarters of 2021, the Group recorded €0.6 million of start-up costs to further the construction of the new plant in Fishers, Indiana, United States. (2) During the three months and nine months ended September 30, 2021, the Group recorded €0.2 million and €1.2 million, respectively, in restructuring and related charges for the consolidation of Balda plants in the U.S. (3) During the nine months ended September 30, 2021, the Group recorded €9.9 million, within general and administrative expenses, as an accrual reversal related to the early termination of incentive plans aimed at a limited number of key managers. The three months ended September 30, 2021 are not affected by this non-recurring item. (4) During the three and nine months ended September 30, 2021, the Group recorded €0.7 million, within general and administrative expenses, relating to the listing of Stevanato Group’s ordinary shares on the NYSE. (5) During the three and nine months ended September 30, 2021, the Group granted a €6.7 million discretionary, out-of-cycle bonus to employees. (6) During the three and nine months ended September 30, 2021, the Group recorded €3.3 million, as foreign exchange loss for derivates on IPO proceeds. (7) During the nine months ended September 30, 2021, the Group reached an agreement with the Italian Tax agency regarding the so-called “Patent box regime”, resulting in a retroactive tax saving for the financial years 2016-2020 amounting to €5.5 million based on our initial estimates. Q3 2022 FInancial Results
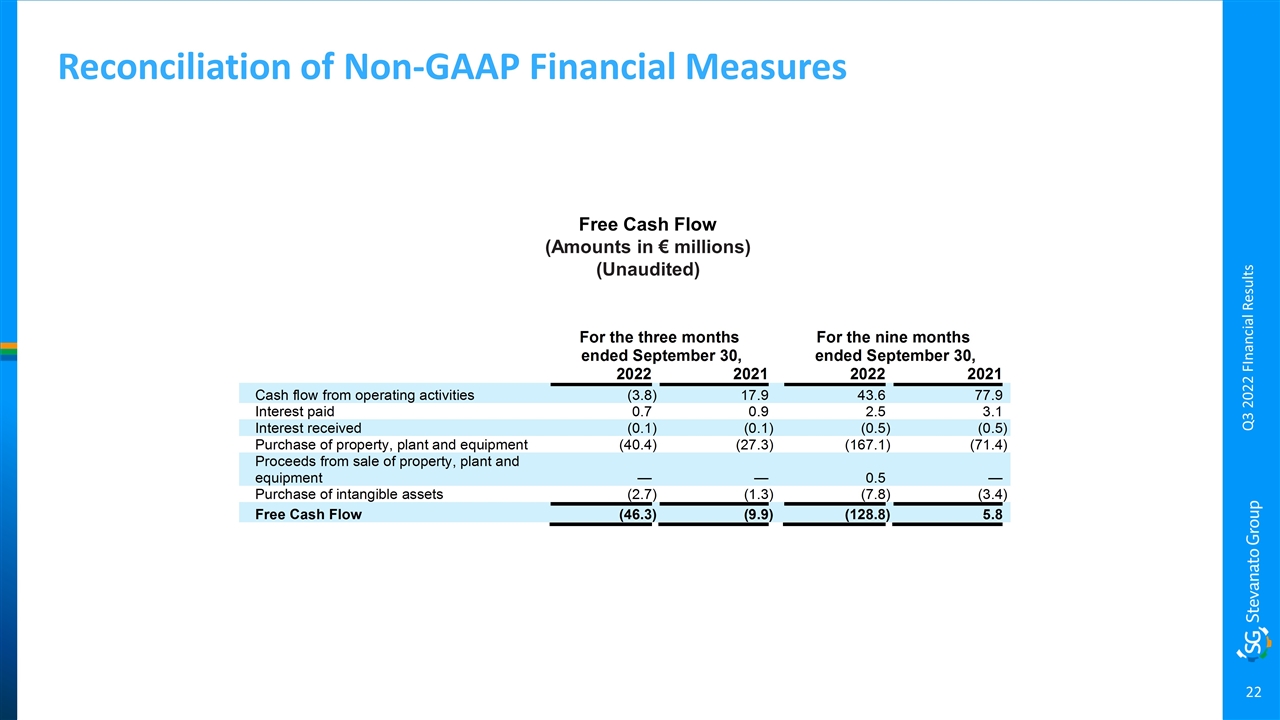
Reconciliation of Non-GAAP Financial Measures Free Cash Flow (Amounts in € millions) (Unaudited) Q3 2022 FInancial Results
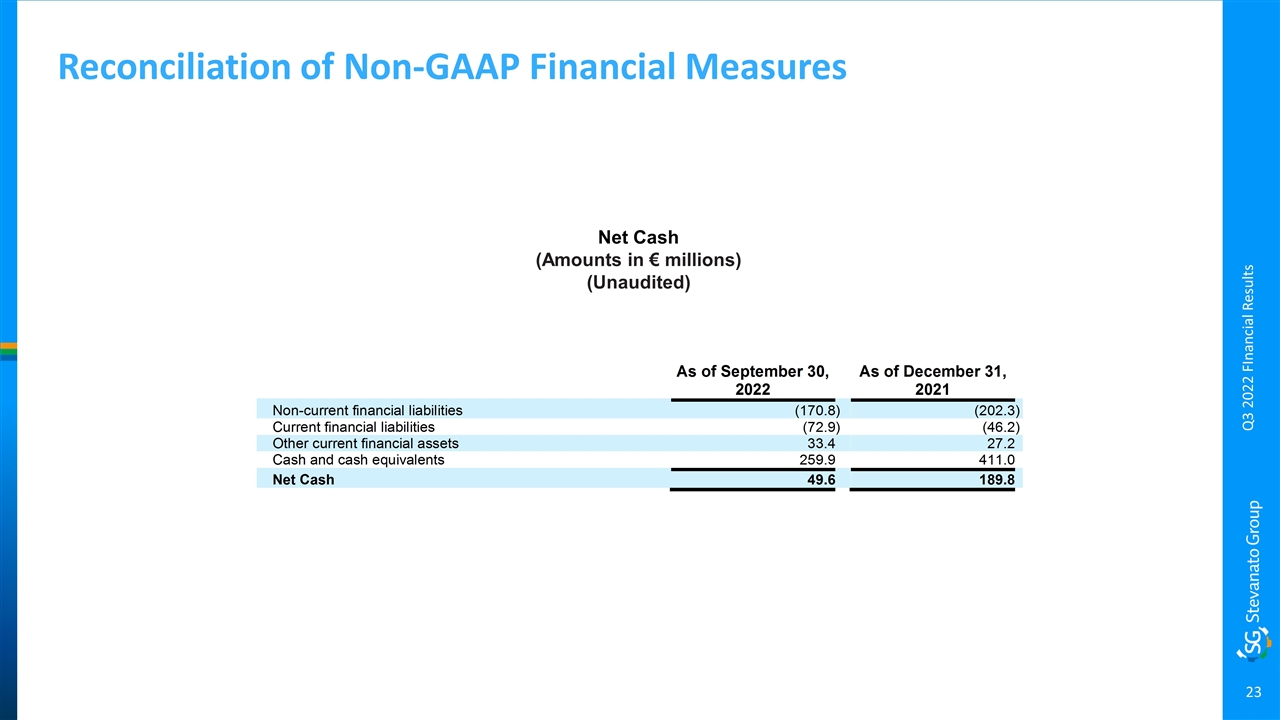
Reconciliation of Non-GAAP Financial Measures Net Cash (Amounts in € millions) (Unaudited) Q3 2022 FInancial Results
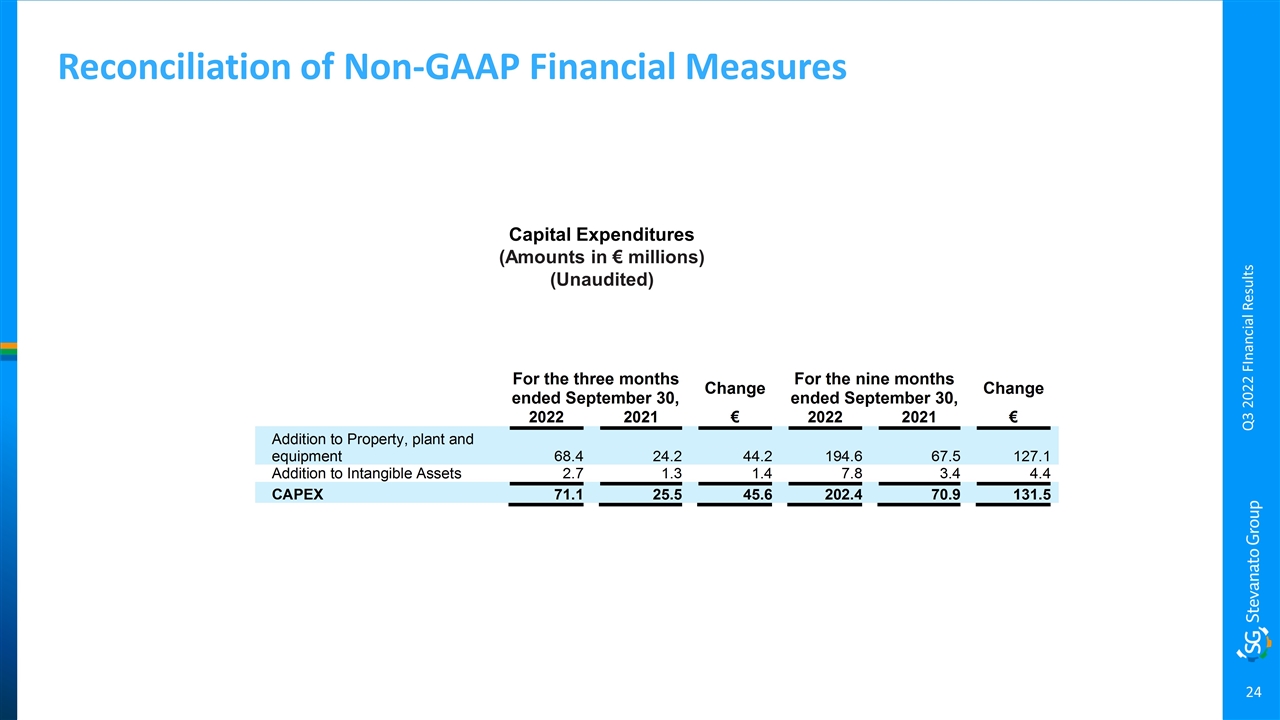
Reconciliation of Non-GAAP Financial Measures Capital Expenditures (Amounts in € millions) (Unaudited) Q3 2022 FInancial Results
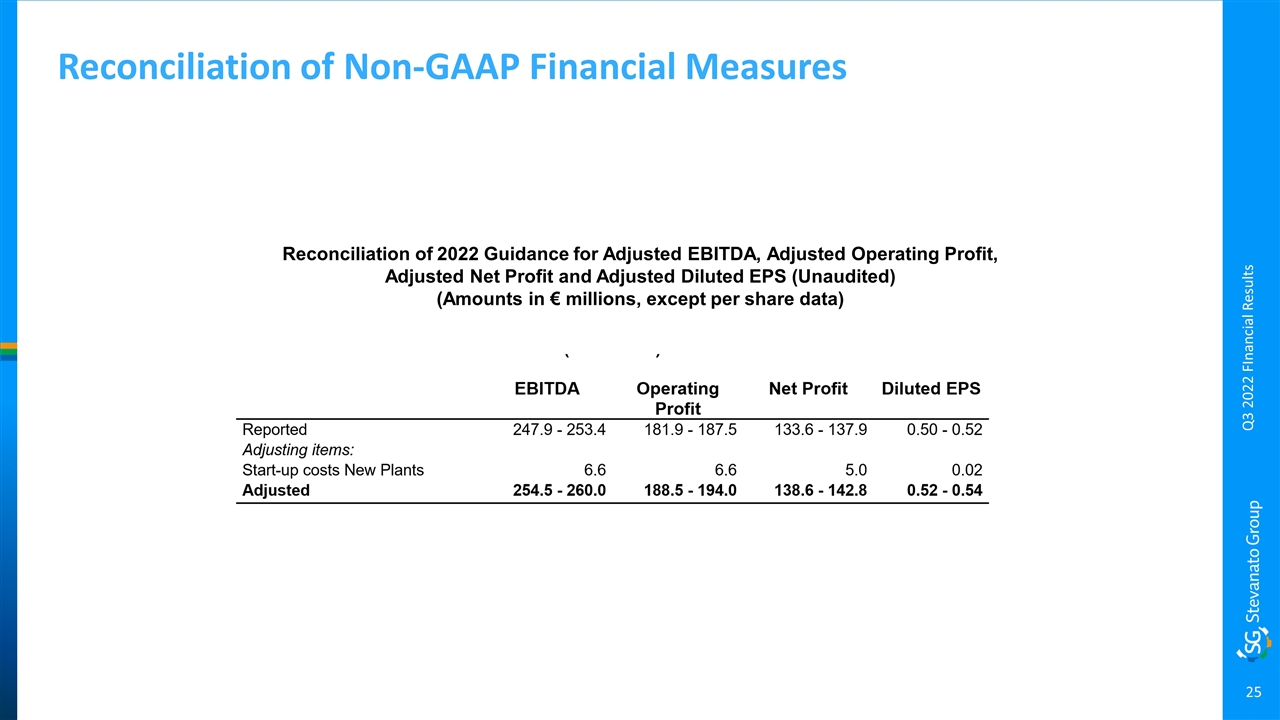
Reconciliation of Non-GAAP Financial Measures Reconciliation of 2022 Guidance for Adjusted EBITDA, Adjusted Operating Profit, Adjusted Net Profit and Adjusted Diluted EPS (Unaudited) (Amounts in € millions, except per share data) Q3 2022 FInancial Results