
Stevanato Group Q1 2023 Financial Results May 4th, 2023 Exhibit 99.1
Forward-Looking Statements This presentation may include forward-looking statements. The words "expect,” “growing”, “favorable,” “driving,” “remain,” “advance,” “rising,” “durable,” “strong,” “increasing,” “well-positioned,” “sustained,” “continued,” “expected,” “creating,” “emerging,” “continue,” “see,” “believe,” “assumes,” and similar expressions (or their negative) identify certain of these forward-looking statements. These forward-looking statements are statements regarding the Company's intentions, beliefs or current expectations concerning, among other things, the investments the Company expects to make, the expansion of manufacturing capacity, the Company’s plans regarding its presence in the U.S., its capital expenditure guidance, business strategies, the Company’s capacity to meet future market demands and support preparedness for future public health emergencies, and results of operations. The forward-looking statements in this presentation are based on numerous assumptions regarding the Company’s present and future business strategies and the environment in which the Company will operate in the future. Forward-looking statements involve inherent known and unknown risks, uncertainties and contingencies because they relate to events and depend on circumstances that may or may not occur in the future and may cause the actual results, performance or achievements of the Company to be materially different from those expressed or implied by such forward looking statements. Many of these risks and uncertainties relate to factors that are beyond the Company's ability to control or estimate precisely, such as future market conditions, currency fluctuations, the behavior of other market participants, the actions of regulators and other factors such as the Company's ability to continue to obtain financing to meet its liquidity needs, changes in the political, social and regulatory framework in which the Company operates or in economic or technological trends or conditions. For a description of the risks that could cause the Company’s future results to differ from those expressed in any such forward looking statements, refer to the risk factors discussed in the Company’s most recent annual report on Form 20-F filed with the U.S. Securities and Exchange Commission on March 2, 2023. Readers should therefore not place undue reliance on these statements, particularly not in connection with any contract or investment decision. Except as required by law, the Company assumes no obligation to update any such forward-looking statements. Non-GAAP Financial Information This presentation contains non-GAAP financial measures. Please refer to the tables included in this presentation for a reconciliation of non-GAAP financial measures. Management monitors and evaluates its operating and financial performance using several non-GAAP financial measures, including Constant Currency Revenue, EBITDA, Adjusted EBITDA, Adjusted EBITDA Margin, Adjusted Operating Profit, Adjusted Operating Profit Margin, Adjusted Net Profit, Adjusted Diluted EPS, Capital Employed, Net Cash, Free Cash Flow and CAPEX. The Company believes that these non-GAAP financial measures provide useful and relevant information regarding its performance and improve its ability to assess its financial condition. While similar measures are widely used in the industry in which the Company operates, the financial measures it uses may not be comparable to other similarly titled measures used by other companies, nor are they intended to be substitutes for measures of financial performance or financial position as prepared in accordance with IFRS. Safe Harbor Statement Q1 2023 Financial Results
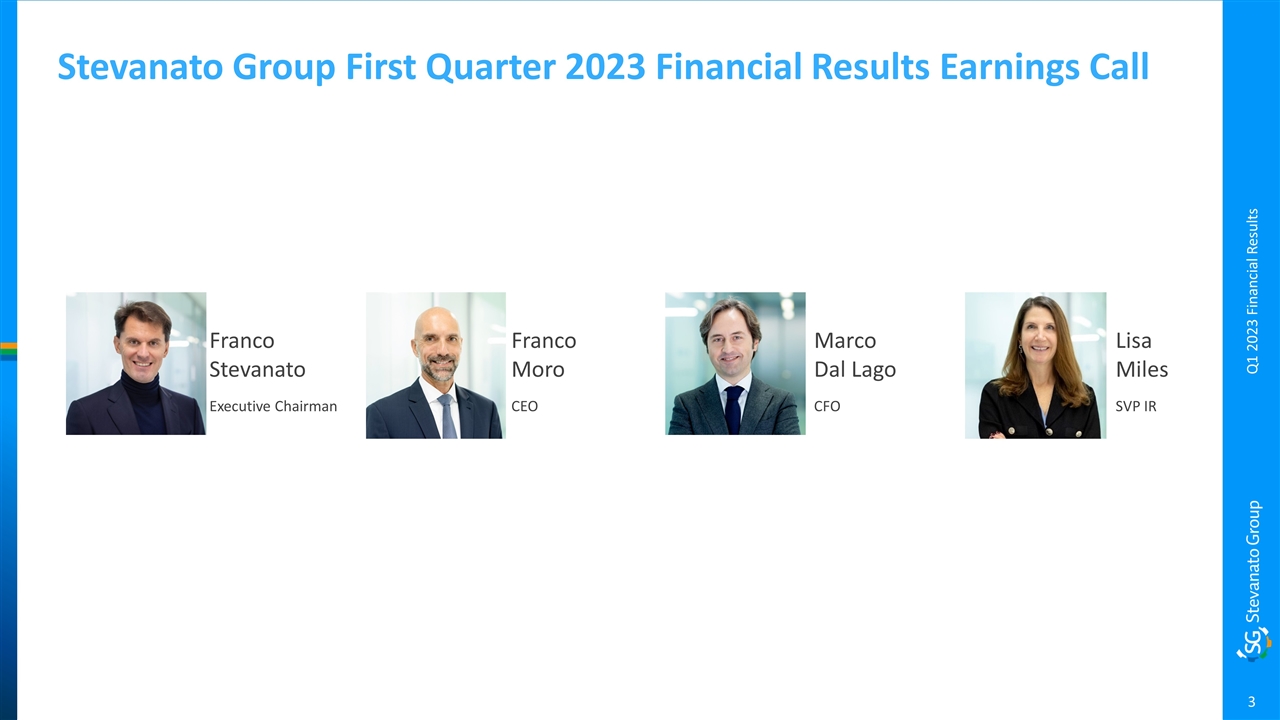
Stevanato Group First Quarter 2023 Financial Results Earnings Call Franco Stevanato Executive Chairman Franco Moro CEO Marco Dal Lago CFO Lisa Miles SVP IR Q1 2023 Financial Results
Franco Stevanato Executive Chairman Q1 2023 Financial Results
Successfully Executing on Multi-Year Strategic Plan Solid first quarter results confirm the positive momentum exiting 2022. Fundamentals of our business remain strong as we advance our strategic priorities to capitalize on rising demand to drive durable growth We are a partner of choice for customers with a history of embedding science, technology, and industry expertise to drive continuous advancements that has led to a highly differentiated product portfolio Our mission-critical products are built into the regulatory filings, creating a captive customer base We operate in growing end markets with strong secular tailwinds and an increasing presence in biologics, the fastest growing market segment. See ample opportunities in treatment classes such as GLP1s, monoclonal antibodies, mRNA applications, and biosimilars We are present in GLP1s since 2010: well-positioned to support customers in the upcoming new GLP1 indications. Just one of the many favorable tailwinds in the growing biologics market Unique value proposition combining global footprint, differentiated product portfolio, and integrated end-to-end solutions, provides us with sustained competitive advantages We are ideally poised to seize opportunities in front of us to drive long-term organic growth and build shareholder value Q1 2023 Financial Results Driving sustainable, long-term, organic growth

Franco Moro Chief Executive Officer Q1 2023 Financial Results
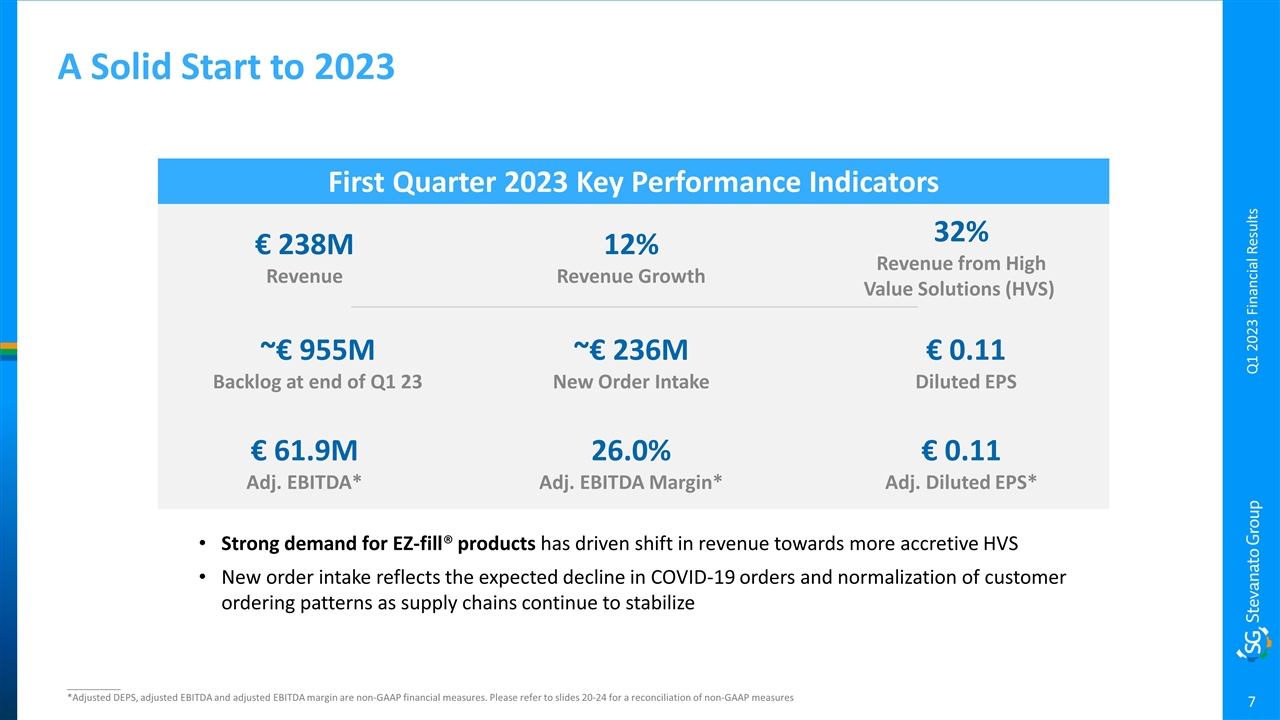
A Solid Start to 2023 First Quarter 2023 Key Performance Indicators Strong demand for EZ-fill® products has driven shift in revenue towards more accretive HVS New order intake reflects the expected decline in COVID-19 orders and normalization of customer ordering patterns as supply chains continue to stabilize __________ *Adjusted DEPS, adjusted EBITDA and adjusted EBITDA margin are non-GAAP financial measures. Please refer to slides 20-24 for a reconciliation of non-GAAP measures Q1 2023 Financial Results € 238M Revenue 32% Revenue from High Value Solutions (HVS) € 61.9M Adj. EBITDA* 12% Revenue Growth 26.0% Adj. EBITDA Margin* € 0.11 Adj. Diluted EPS* € 0.11 Diluted EPS ~€ 236M New Order Intake ~€ 955M Backlog at end of Q1 23

Leveraging Strategic Collaborations Working with market leaders to advance drug delivery programs Q1 2023 Financial Results Collaboration offers a complete, end-to-end supply chain solution around our proprietary on-body delivery system Leveraging best-in-class complementary capabilities supporting clients from drug development to commercialization STVN: Proprietary on-body drug delivery system; ready-to-use EZ-fill® cartridges; assembly equipment TMO: Fill-and-finish; final assembly services Partnering to develop and manufacture high-performing Alba® pre-fillable syringes for Recipharm’s soft mist inhaler The combination of Stevanato's Alba® platform and Recipharm’s innovative technology delivers sensitive biologics more efficiently to the respiratory airways, and provides enhanced stability and safety Stevanato's Alba® platform is purpose built for biologics because it significantly reduces any potential interaction between the drug and the container
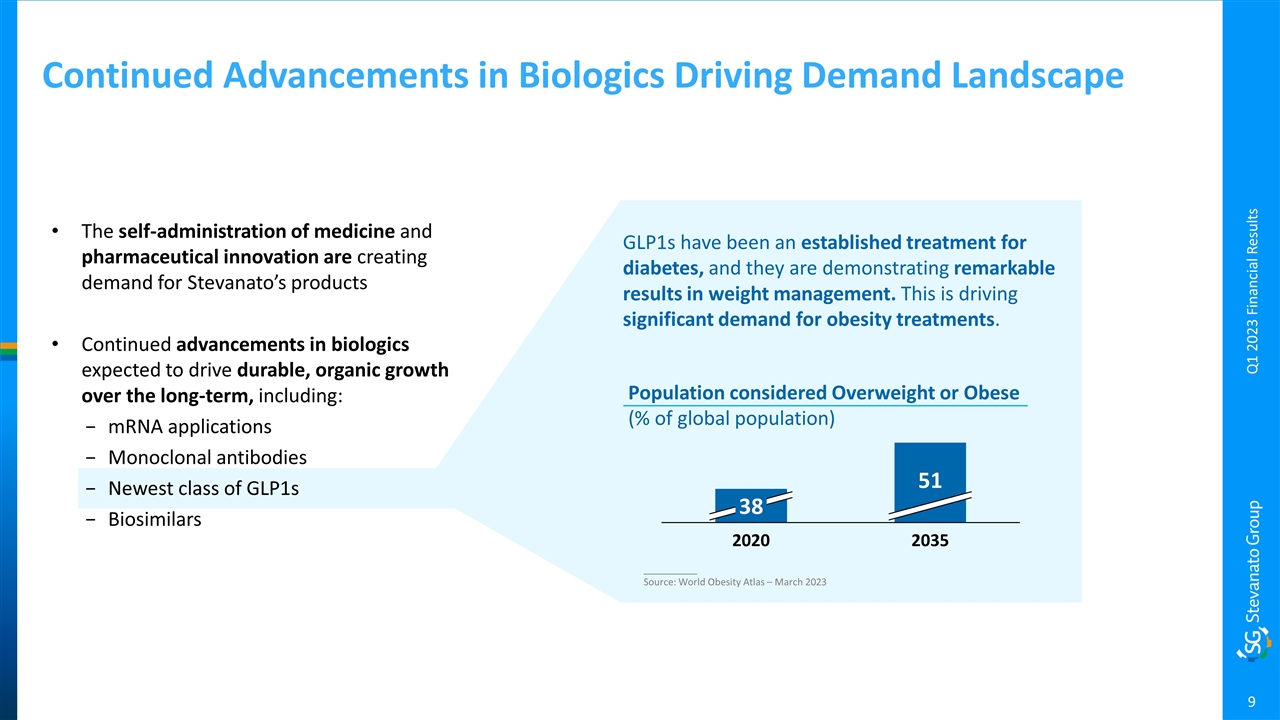
The self-administration of medicine and pharmaceutical innovation are creating demand for Stevanato’s products Continued advancements in biologics expected to drive durable, organic growth over the long-term, including: mRNA applications Monoclonal antibodies Newest class of GLP1s Biosimilars Continued Advancements in Biologics Driving Demand Landscape Q1 2023 Financial Results __________ Source: World Obesity Atlas – March 2023 GLP1s have been an established treatment for diabetes, and they are demonstrating remarkable results in weight management. This is driving significant demand for obesity treatments. Population considered Overweight or Obese (% of global population)
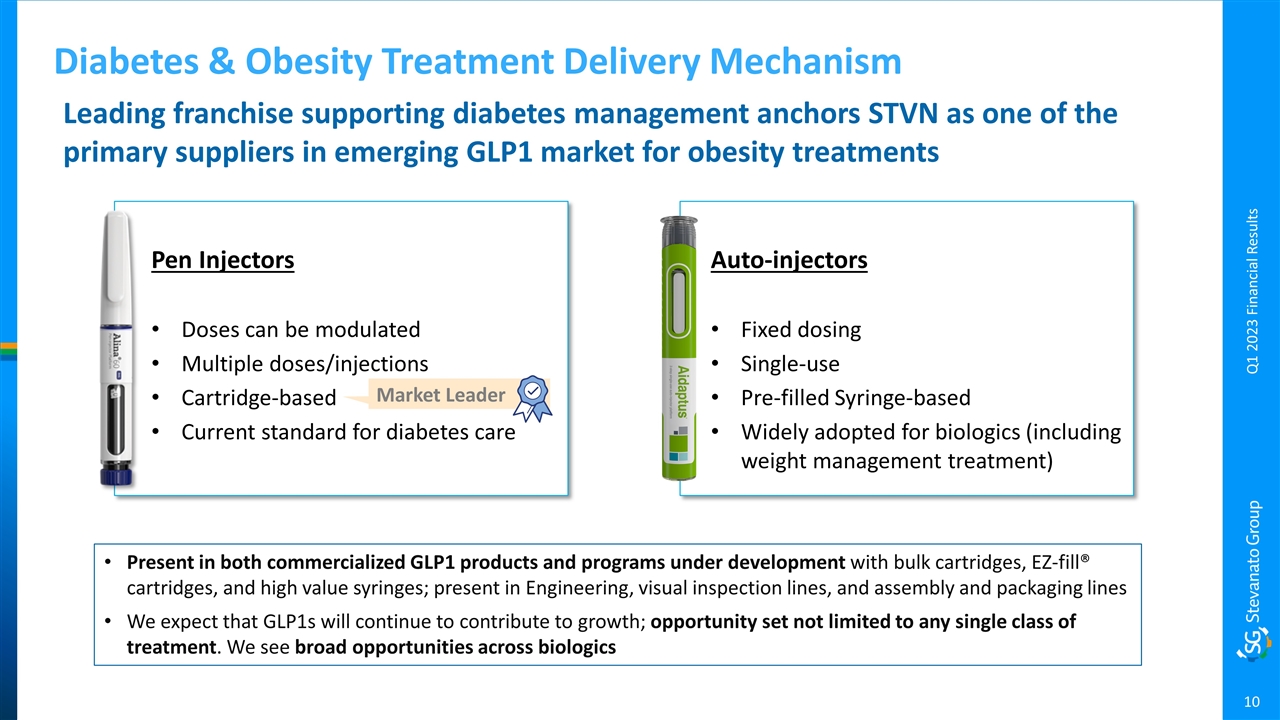
Diabetes & Obesity Treatment Delivery Mechanism Q1 2023 Financial Results Pen Injectors Doses can be modulated Multiple doses/injections Cartridge-based Current standard for diabetes care Auto-injectors Fixed dosing Single-use Pre-filled Syringe-based Widely adopted for biologics (including weight management treatment) Market Leader Present in both commercialized GLP1 products and programs under development with bulk cartridges, EZ-fill® cartridges, and high value syringes; present in Engineering, visual inspection lines, and assembly and packaging lines We expect that GLP1s will continue to contribute to growth; opportunity set not limited to any single class of treatment. We see broad opportunities across biologics Leading franchise supporting diabetes management anchors STVN as one of the primary suppliers in emerging GLP1 market for obesity treatments
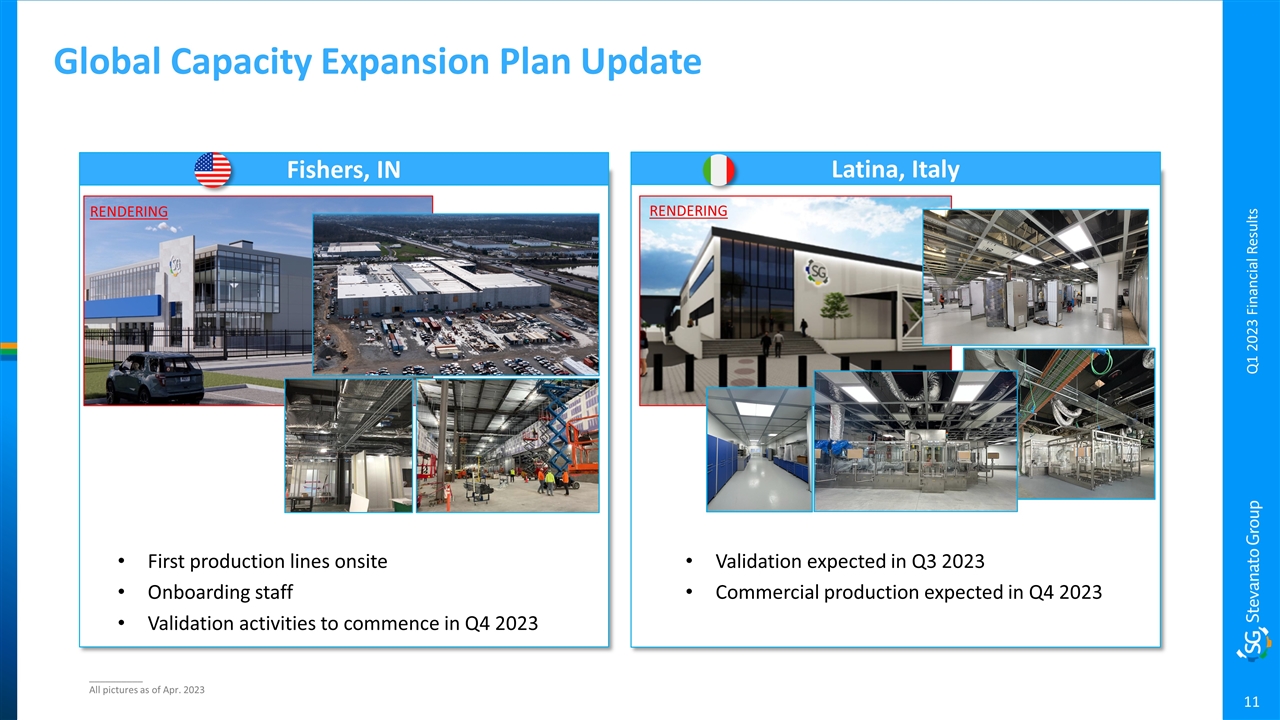
Global Capacity Expansion Plan Update RENDERING Q1 2023 Financial Results RENDERING Fishers, IN Latina, Italy First production lines onsite Onboarding staff Validation activities to commence in Q4 2023 Validation expected in Q3 2023 Commercial production expected in Q4 2023 __________ All pictures as of Apr. 2023

Substantial Progress in Building Durable Organic Growth Successfully shifting revenue mix toward High Value Solutions Strategic collaborations to leverage STVN strengths to meet growing demand Well positioned to capitalize on favorable industry trends, such as the expected increase in GLP1s On track with our capacity expansion in the U.S. and Europe Q1 2023 Financial Results
Marco Dal Lago Chief Financial Officer Q1 2023 Financial Results

Q1 2023: Financial Highlights __________ *All comparisons refer to Q1 2022 unless otherwise specified Adjusted operating profit margin, adjusted net profit, adjusted DEPS, adjusted EBITDA and adjusted EBITDA margin are non-GAAP financial measures. Please refer to slides 20-24 for a reconciliation of non-GAAP measures (€ Million) Q1 2023 Revenue Q1 2023 Margins Q1 2023 Q1 2022 Gross Profit Margin 32.0% 31.8% Operating Profit Margin 17.1% 17.9% Q1 2023 Financial Results () () Revenue increase driven by growth in both segments, shift toward HVS (on constant currency basis, +11% yoy) Revenue from Covid-19 decreased 57% and represented ~4% of Revenue Revenue from HVS increased 25% to € 76.7M; driven by strong demand for EZ-fill® products Gross Profit Margin increased 20 basis points to 32.0%, mainly driven by more accretive HVS, and to a lesser extent, margin improvement in the Engineering segment, offset by expected rise in industrial costs and higher depreciation as new plants come into service. These temporary inefficiencies are expected to continue throughout 2023 Operating Profit Margin decreased to 17.1%, due to higher SG&A expenses to support growth initiatives Excluding start-up costs, adjusted operating profit margin* was 18.3%, consistent with last year On the bottom line: Net Profit of € 28.3M, or € 0.11 of diluted EPS (includes € 0.01 unfavorable impact due to unexpected strengthening of the MXN against EUR and USD) Excluding start-up costs, Adjusted Net Profit* of € 30.4M, or € 0.11 of adjusted diluted EPS* Adjusted EBITDA* of € 61.9M; adjusted EBITDA margin* of 26%, up 50 bps yoy
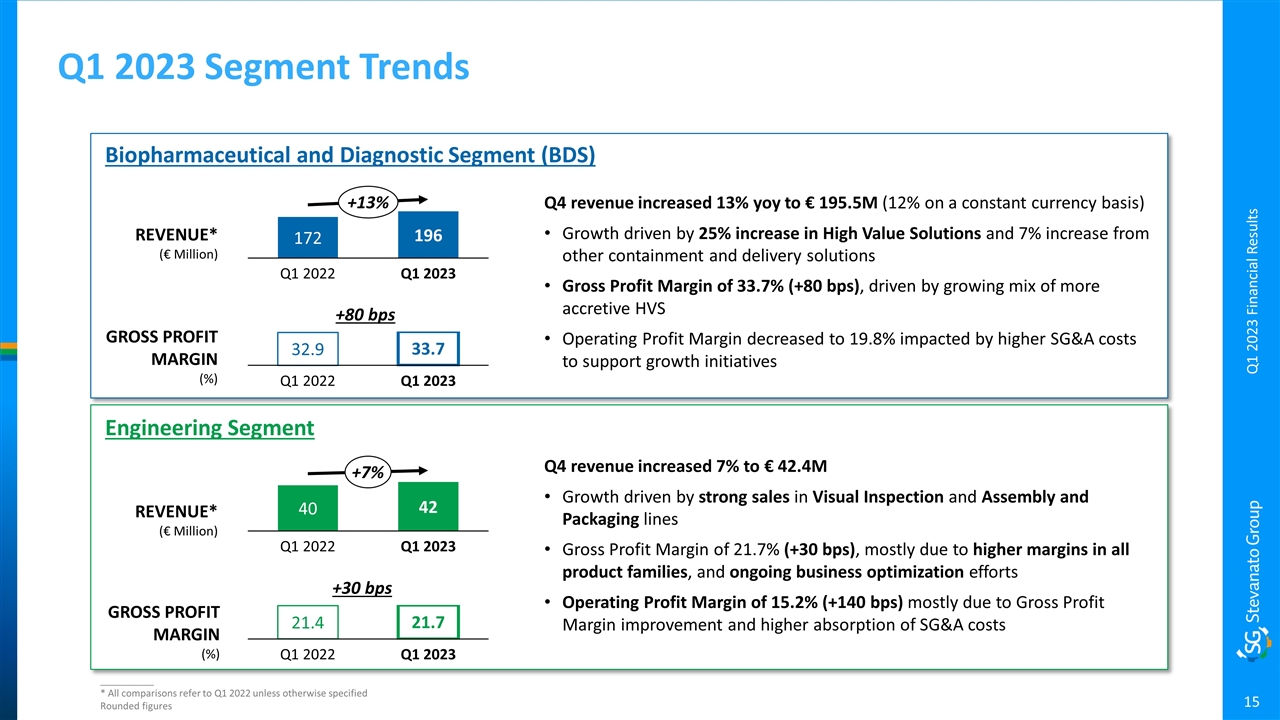
Q1 2023 Segment Trends __________ * All comparisons refer to Q1 2022 unless otherwise specified Rounded figures Q4 revenue increased 13% yoy to € 195.5M (12% on a constant currency basis) Growth driven by 25% increase in High Value Solutions and 7% increase from other containment and delivery solutions Gross Profit Margin of 33.7% (+80 bps), driven by growing mix of more accretive HVS Operating Profit Margin decreased to 19.8% impacted by higher SG&A costs to support growth initiatives Biopharmaceutical and Diagnostic Segment (BDS) REVENUE* (€ Million) GROSS PROFIT MARGIN (%) Engineering Segment Q4 revenue increased 7% to € 42.4M Growth driven by strong sales in Visual Inspection and Assembly and Packaging lines Gross Profit Margin of 21.7% (+30 bps), mostly due to higher margins in all product families, and ongoing business optimization efforts Operating Profit Margin of 15.2% (+140 bps) mostly due to Gross Profit Margin improvement and higher absorption of SG&A costs REVENUE* (€ Million) GROSS PROFIT MARGIN (%) +30 bps +80 bps Q1 2023 Financial Results
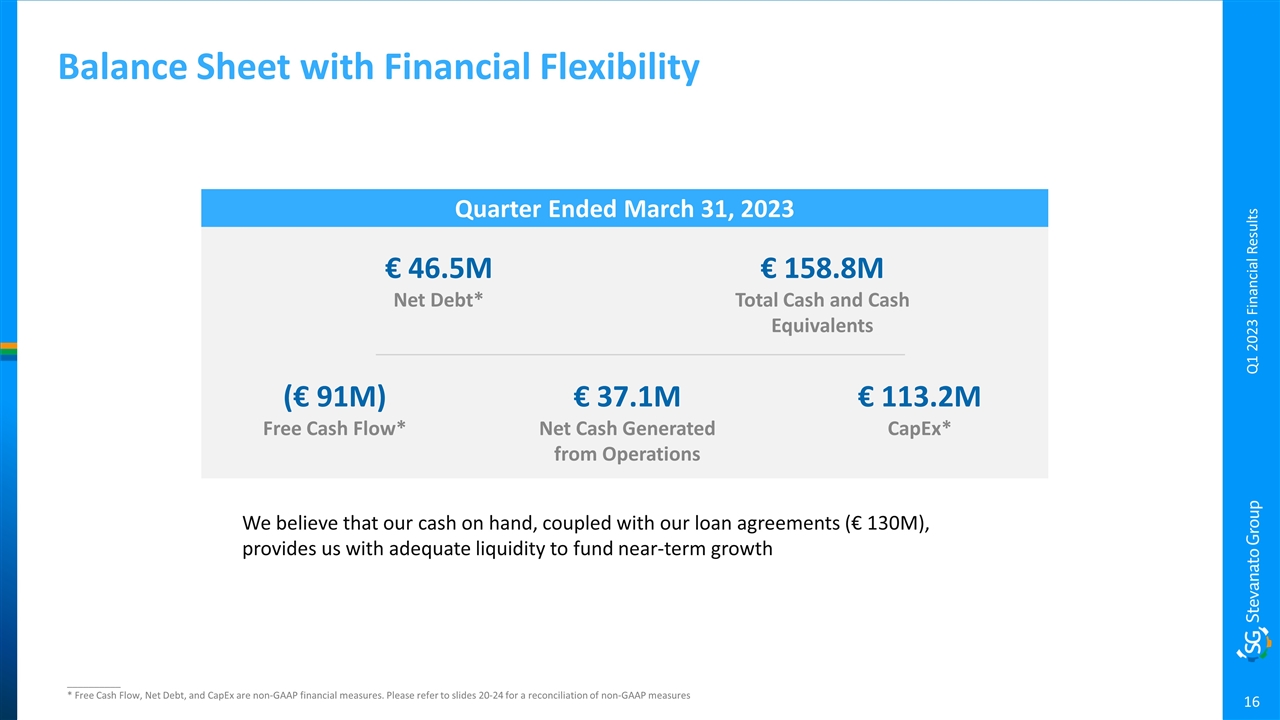
Balance Sheet with Financial Flexibility Quarter Ended March 31, 2023 We believe that our cash on hand, coupled with our loan agreements (€ 130M), provides us with adequate liquidity to fund near-term growth __________ * Free Cash Flow, Net Debt, and CapEx are non-GAAP financial measures. Please refer to slides 20-24 for a reconciliation of non-GAAP measures Q1 2023 Financial Results (€ 91M) Free Cash Flow* € 46.5M Net Debt* € 158.8M Total Cash and Cash Equivalents € 113.2M CapEx* € 37.1M Net Cash Generated from Operations
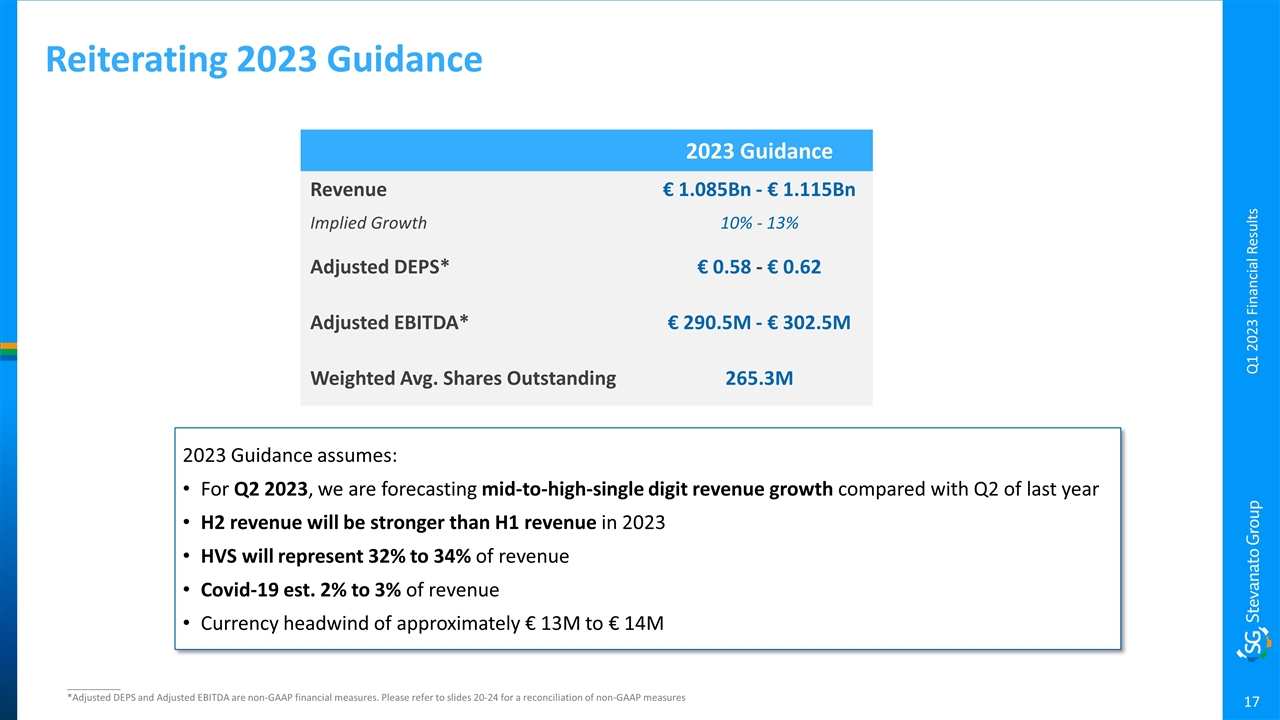
2023 Guidance assumes: For Q2 2023, we are forecasting mid-to-high-single digit revenue growth compared with Q2 of last year H2 revenue will be stronger than H1 revenue in 2023 HVS will represent 32% to 34% of revenue Covid-19 est. 2% to 3% of revenue Currency headwind of approximately € 13M to € 14M Reiterating 2023 Guidance __________ *Adjusted DEPS and Adjusted EBITDA are non-GAAP financial measures. Please refer to slides 20-24 for a reconciliation of non-GAAP measures 2023 Guidance Revenue € 1.085Bn - € 1.115Bn Implied Growth 10% - 13% Adjusted DEPS* € 0.58 - € 0.62 Adjusted EBITDA* € 290.5M - € 302.5M Weighted Avg. Shares Outstanding 265.3M Q1 2023 Financial Results

Franco Moro Chief Executive Officer Q1 2023 Financial Results
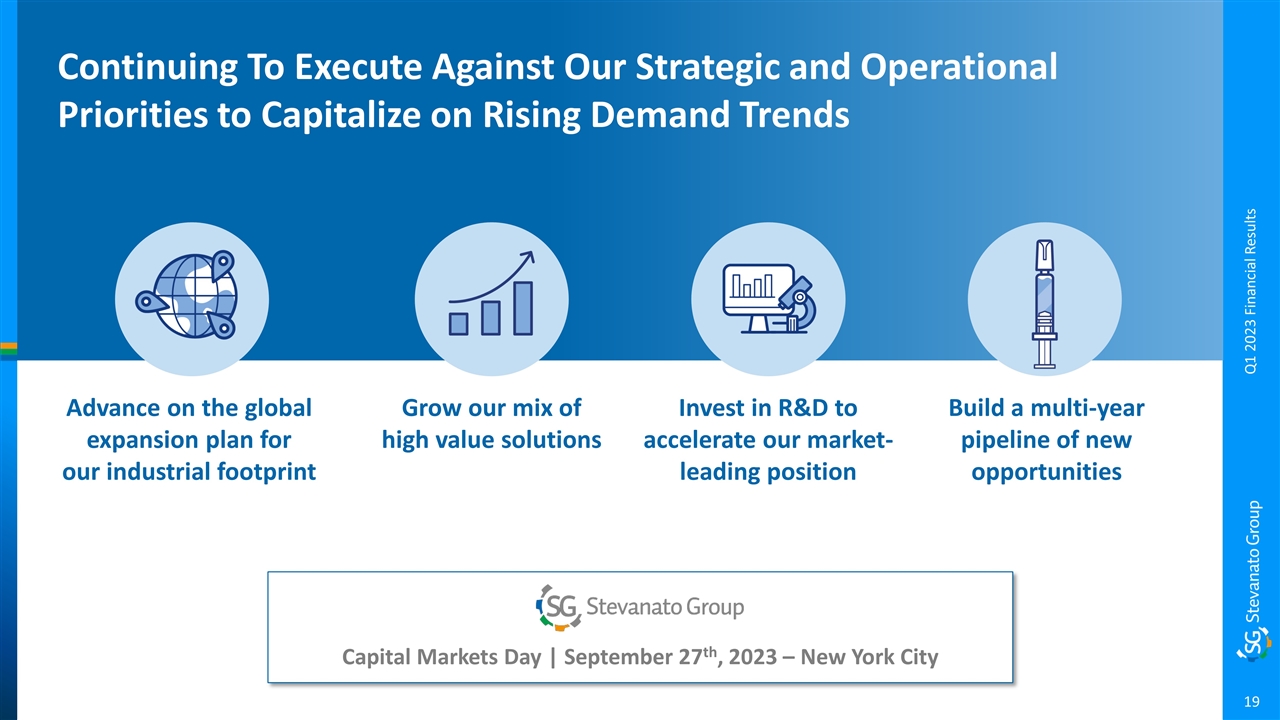
Continuing To Execute Against Our Strategic and Operational Priorities to Capitalize on Rising Demand Trends Advance on the global expansion plan for our industrial footprint Grow our mix of high value solutions Invest in R&D to accelerate our market-leading position Build a multi-year pipeline of new opportunities Q1 2023 Financial Results Capital Markets Day | September 27th, 2023 – New York City
Reconciliation of Non-GAAP Financial Measures (Unaudited) This presentation contains non-GAAP financial measures. Please refer to the tables included in this presentation for a reconciliation of non-GAAP measures. Management monitors and evaluates our operating and financial performance using several non-GAAP financial measures, including Constant Currency Revenue, EBITDA, Adjusted EBITDA, Adjusted EBITDA Margin, Adjusted Operating Profit, Adjusted Operating Profit Margin, Adjusted Net Profit, Adjusted Diluted EPS, Capital Employed, Net Cash, Free Cash Flow, and CapEx. We believe that these non-GAAP financial measures provide useful and relevant information regarding our performance and improve our ability to assess our financial condition. While similar measures are widely used in the industry in which we operate, the financial measures we use may not be comparable to other similarly titled measures used by other companies, nor are they intended to be substitutes for measures of financial performance or financial position as prepared in accordance with IFRS. Notes to Non-GAAP Financial Measures Q1 2023 Financial Results

Reconciliation of Non-GAAP Financial Measures Reconciliation of Revenue to Constant Currency Revenue (Amounts in € millions) (Unaudited) Q1 2023 Financial Results Reconciliation of EBITDA (Amounts in € millions) (Unaudited) Three months ended March 31, 2023Biopharmaceutical and Diagnostic SolutionsEngineeringReported Revenue (IFRS GAAP)195.542.4Effect of changes in currency translation rates(2.2)0.0Organic Revenue (Non-IFRS GAAP)193.342.5For the three monthsended March 31,Change20232022%Net Profit28.327.81.8%Income Taxes7.88.5-8.2%Finance Income(4.4)(3.0)46.7%Finance Expenses9.04.695.7%Operating Profit40.637.97.1%Depreciation and Amortization18.415.221.1%EBITDA59.053.111.1%
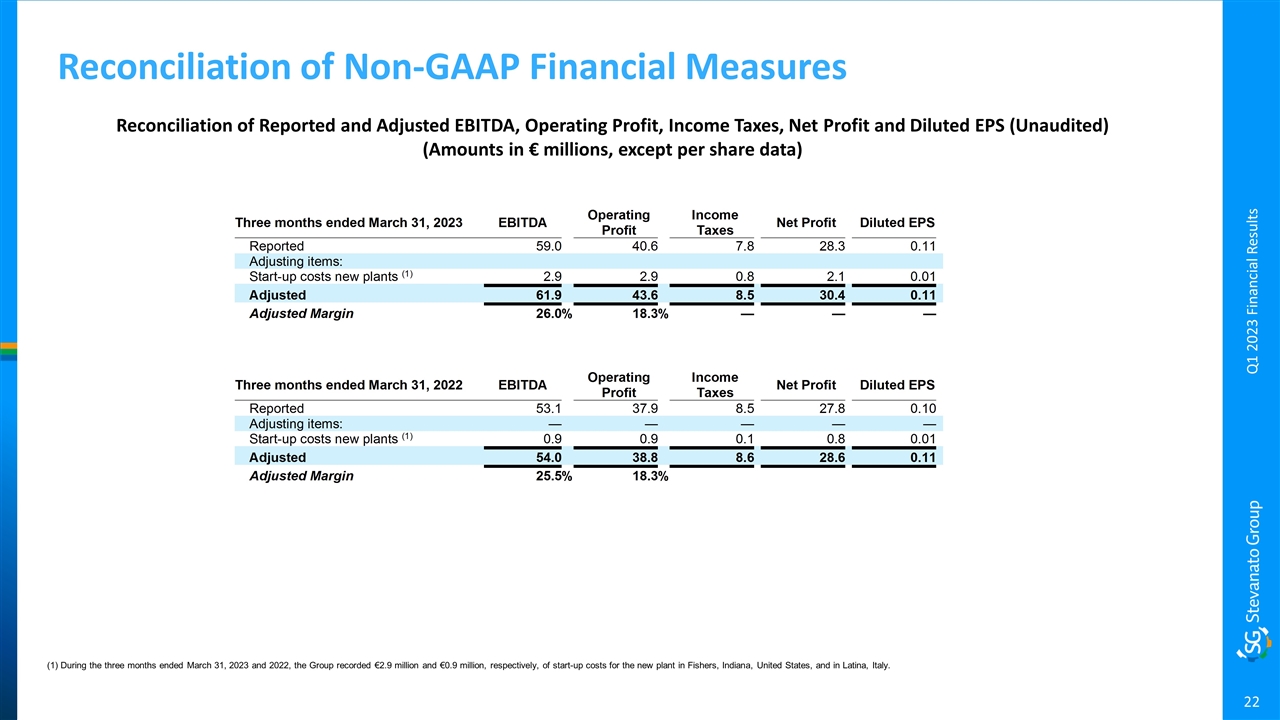
Reconciliation of Reported and Adjusted EBITDA, Operating Profit, Income Taxes, Net Profit and Diluted EPS (Unaudited) (Amounts in € millions, except per share data) Reconciliation of Non-GAAP Financial Measures (1) During the three months ended March 31, 2023 and 2022, the Group recorded €2.9 million and €0.9 million, respectively, of start-up costs for the new plant in Fishers, Indiana, United States, and in Latina, Italy. Q1 2023 Financial ResultsThree months ended March 31, 2023EBITDAOperating ProfitIncome TaxesNet ProfitDiluted EPSReported59.040.67.828.30.11Adjusting items:Start-up costs new plants (1)2.92.90.82.10.01Adjusted61.943.68.530.40.11Adjusted Margin26.0%18.3%———Three months ended March 31, 2022EBITDAOperating ProfitIncome TaxesNet ProfitDiluted EPSReported53.137.98.527.80.10Adjusting items:—————Start-up costs new plants (1)0.90.90.10.80.01Adjusted54.038.88.628.60.11Adjusted Margin25.5%18.3%
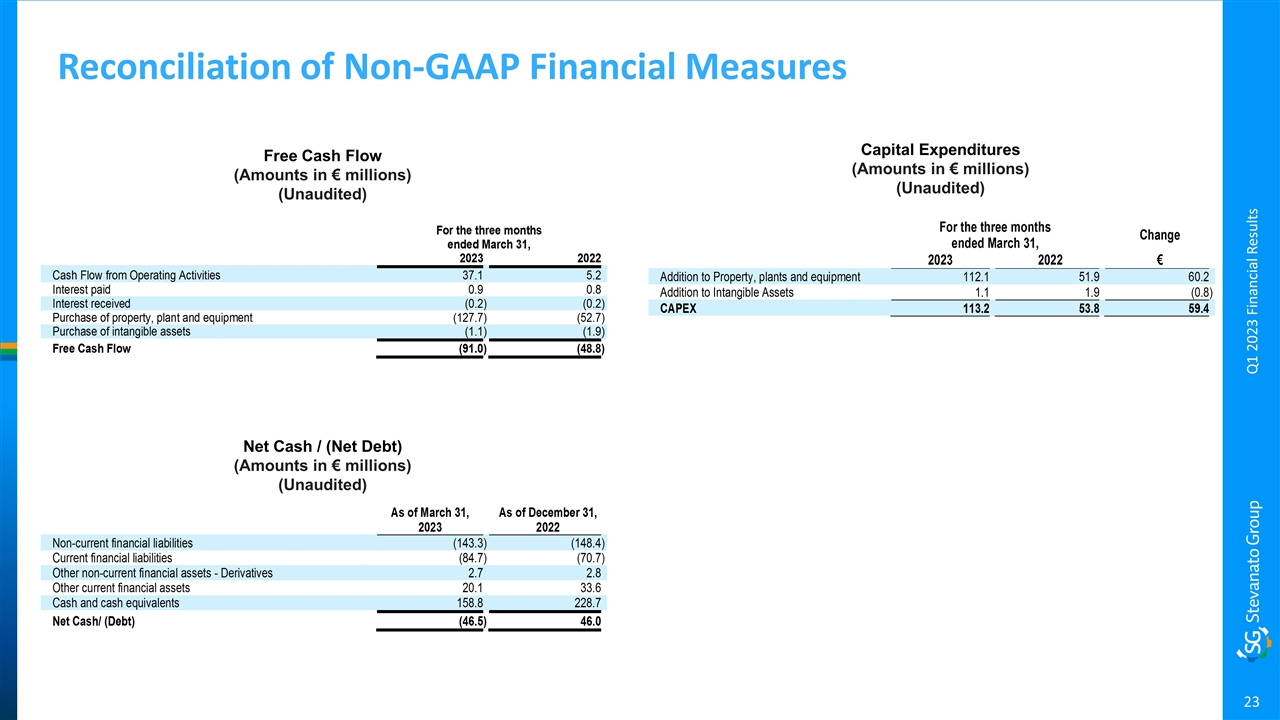
Reconciliation of Non-GAAP Financial Measures Free Cash Flow (Amounts in € millions) (Unaudited) Q1 2023 Financial Results Net Cash / (Net Debt) (Amounts in € millions) (Unaudited) Capital Expenditures (Amounts in € millions) (Unaudited) For the three monthsended March 31,20232022Cash Flow from Operating Activities37.15.2Interest paid0.90.8Interest received(0.2)(0.2)Purchase of property, plant and equipment(127.7)(52.7)Purchase of intangible assets(1.1)(1.9)Free Cash Flow(91.0)(48.8)As of March 31,As of December 31,20232022Non-current financial liabilities(143.3)(148.4)Current financial liabilities(84.7)(70.7)Other non-current financial assets - Derivatives2.72.8Other current financial assets20.133.6Cash and cash equivalents158.8228.7Net Cash/ (Debt)(46.5)46.0For the three monthsended March 31,Change20232022€Addition to Property, plants and equipment112.151.960.2Addition to Intangible Assets1.11.9(0.8)CAPEX113.253.859.4
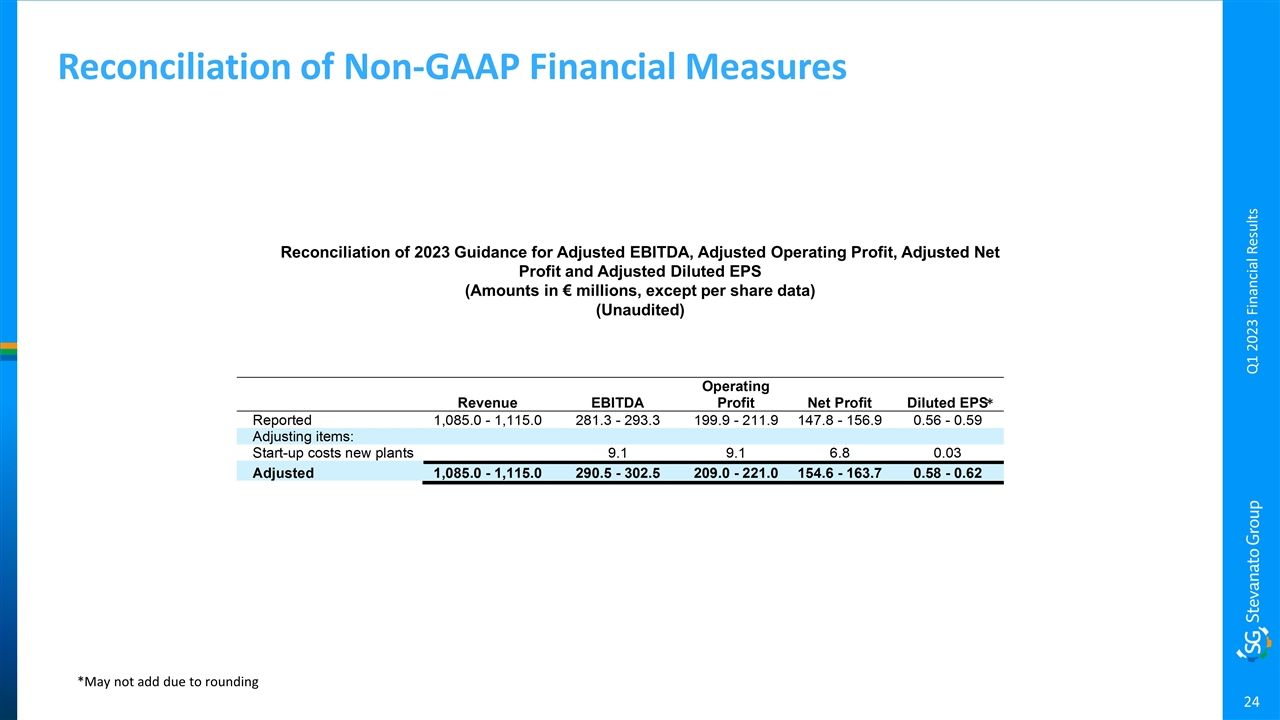
Reconciliation of Non-GAAP Financial Measures Reconciliation of 2023 Guidance for Adjusted EBITDA, Adjusted Operating Profit, Adjusted Net Profit and Adjusted Diluted EPS (Amounts in € millions, except per share data) (Unaudited) Q1 2023 Financial Results *May not add due to rounding *